
It’s hard for insurance carriers today to offer stand-out products and pricing. But there is one area in which you can still really differentiate in Insurance: Customer experience.
Historically a high-churn industry, Insurance is now more focused on nurturing customer loyalty and securing customer retention.
As a result, carriers are all vying to provide the slickest, most satisfying and ‘Amazon-like’ digital customer experience possible.
So how well are they doing? Read the Digital Experience Benchmark report to find out.
The report sets out the current benchmark for CX excellence in Insurance and the Financial Services industry in general. (If you’d like to know more before you read, check out our article that lays out 5 reasons to read the report.)
In this article, we’ll run through five strategies for improving the insurance customer experience suggested by findings in our report, and explain how to use digital experience analytics (DXA) to execute them.
1. Optimize your insurance customer experience for all channels and devices
The 2023 Financial Services Digital Experience report shows that traffic to financial services sites is overwhelmingly organic (89.1%) and desktop-based (61.1%).
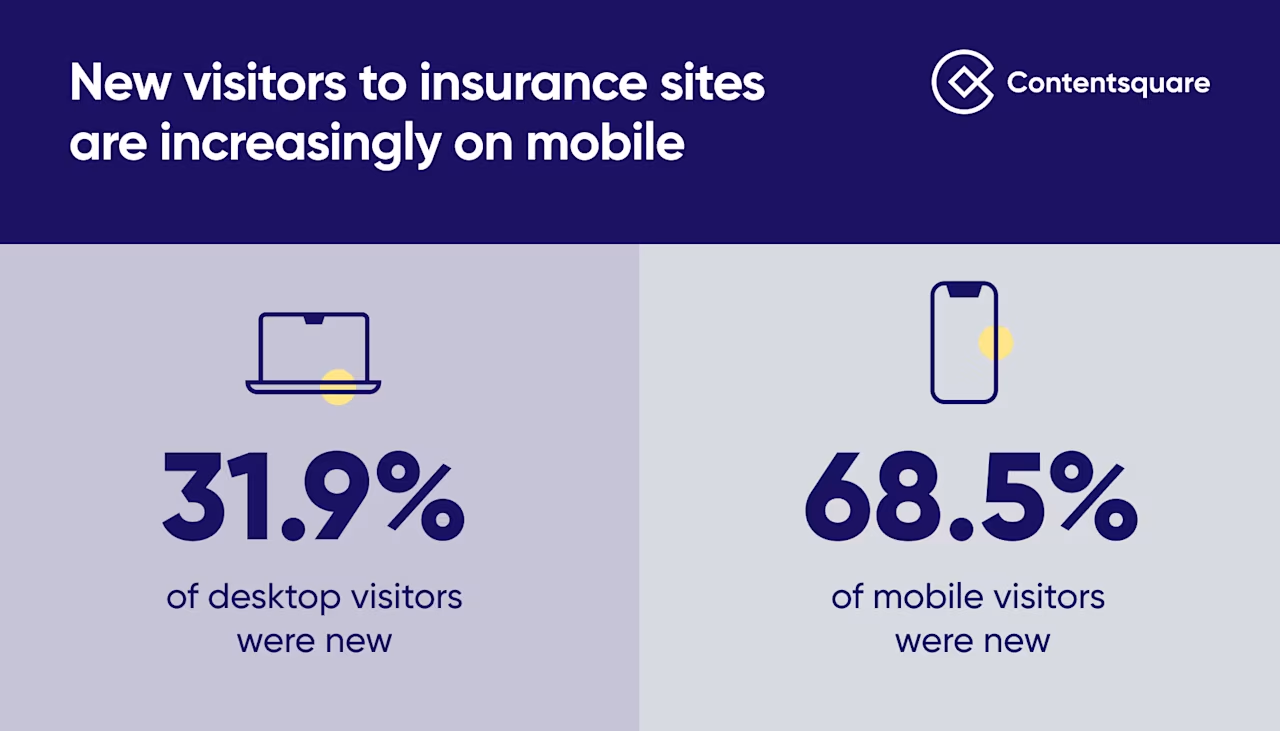
But mobile traffic is increasingly important: Paid mobile web traffic jumped +11.3% and 55.2% of new visitors to financial services sites were on mobile. And in Insurance, the percentage of desktop visitors who were new dropped from 38.6% in 2021 to 31.9% in 2022.
What to do and how DXA helps
The complexity of traffic to insurance sites means that, while you certainly should be optimizing your web experience for mobile (particularly for new visitors) you really have to optimize for every traffic source and channel.
Monitoring experiences via a digital experience analytics platform that enables segmented analysis will help you understand how different user groups behave on your site.
Contentsquare’s Customer Journey Mapping tool will let you see at a glance how the paths typically taken by new visitors differ from returning visitors, how mobile users and desktop users differ, how new mobile users differ from returning mobile users… And so on.
And you can dig in deeper, too, analyzing experiences page-by-page, applying Zone-based Heatmaps to see where different visitor groups are clicking and scrolling on your site.
2. Encourage user activity to cut bounces and improve engagement on insurance customer experience
One of the most powerful metrics uncovered in our Benchmark report is user activity—the proportion of time per session users are clicking, scrolling, swiping and typing.
Compared to financial services sites with the lowest level of activity, financial services sites with the highest level of activity per session see:
-58% lower bounce rates
+41% deeper sessions (i.e. more pages viewed per session)
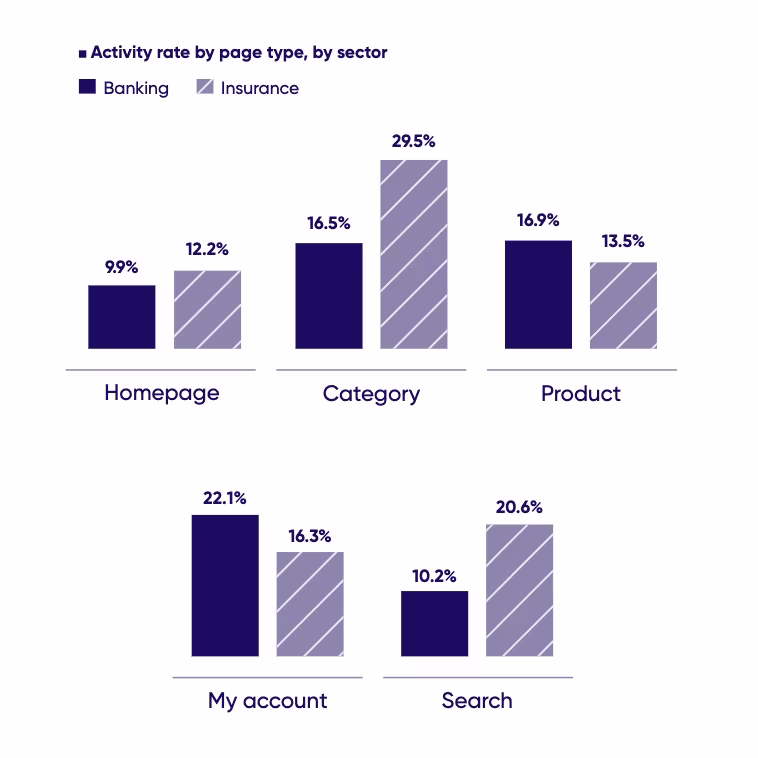
The most active page types on insurance sites are Category and search pages. This makes sense, given that customer acquisition remains the biggest focus of insurance sites. (With search being used to zero-in on products.)
What to do and how DXA helps
With insurance carriers pivoting to a retention model, monitoring activity levels on ‘my account’ pages could be pivotal to gauging the success of customer retention strategies.
In any case, carriers should use DXA to closely monitor activity levels throughout their customer journeys. Pages with high levels of activity are ripe for testing and content optimization; pages with low activity levels could require more interactive options to encourage more engagement from visitors.
3. Pinpoint and eliminate friction from your insurance customer experience
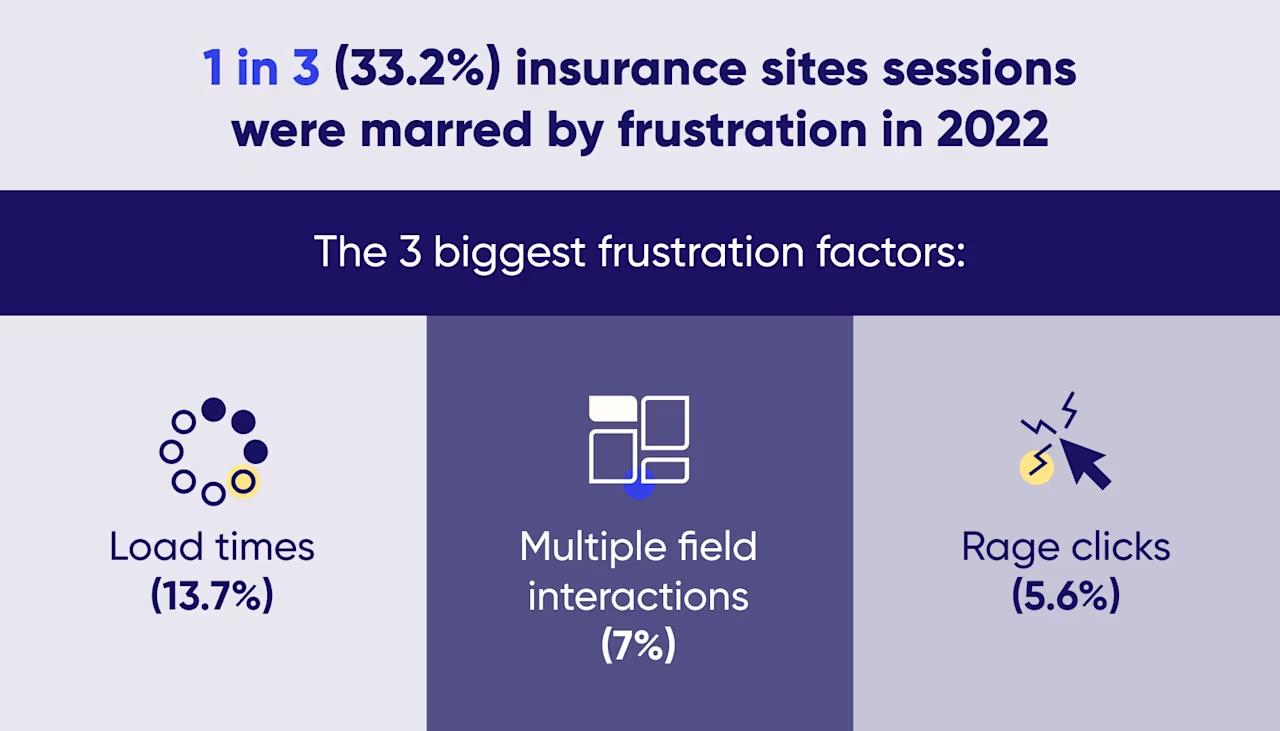
User frustration was a feature just over a third of insurance site sessions in 2022. That’s even worse than in Banking, where ‘only’ a little over a quarter of sessions frustrated site users in some way.
While both sectors were equally impacted by slow page loads, the most prominent frustration factor highlighted in our Benchmark report, insurance site visitors exhibited several symptoms of frustration more frequently than banking site visitors, including multiple field interactions (7%) and rage clicks (5.6%).
These symptoms tend to be caused by long, complex forms and rigid digital journeys—both lamentably commonplace features in insurance site experiences.
What to do and how DXA helps
Insurance carriers need to up their game when it comes to detecting and rooting out frustration in their digital customer experiences.
As well as using a speed analysis tool to combat the most common and damaging form of frustration, carriers can use AI-enhanced error analysis tools like CS Find & Fix to detect symptoms of poorly designed, rigid or broken experiences in their customer journeys as soon as they happen.
An important, Insurance-specific priority should be removing frustration from online forms. Contentsquare’s Form Analysis product can show you which fields are causing errors, struggles or confusion—without having to deploy custom tags for capturing interactions.
4. Track session consumption metrics to understand where to make changes
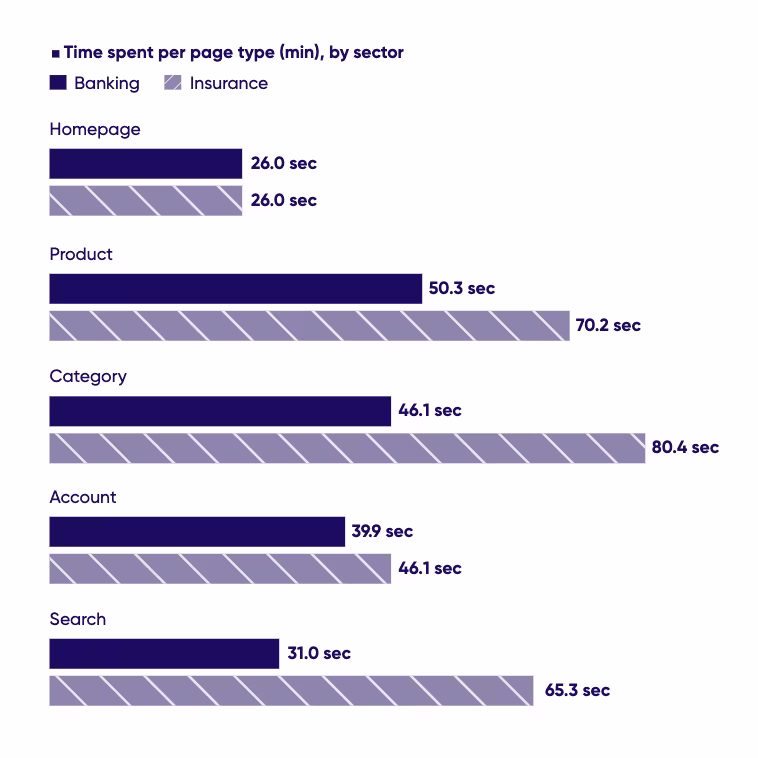
Visitors to insurance websites consume more content than visitors to banking sites—and, in fact, more than visitors to most sectors.
They spend more time per page than visitors to banking sites—on every major page type other than the homepage. (Spending the most time on product and category pages.)
Insurance sites also have a notably high scroll rate: 63.3%. That’s significantly higher than the scroll rate on banking sites (52.5%) and the average scroll rate across the 9 industries featured in our Global Benchmark report (50%).
It makes sense that insurance site visitors consume more content. Insurance products are complicated, and insurance sites tend to contain a density of detail, often below the fold.
What to do and how DXA helps
While the scroll rate for insurance sites is far above the average, at 63.3% it still averages only about two-thirds. Therefore, critical content and calls to action should be placed as high up pages as possible.
It should also be noted that users spending longer on pages is a potentially ambiguous signal. It could indicate absorption and engagement in content—or confusion, hesitation, or boredom.
Traditional analytics tools can’t give you the full context you need to understand the nuances of customer behavior; digital experience analytics does.
To take just one example, our DXA platform’s Session Replay capability enables businesses to record and play back user sessions. Looking at things from a customer’s perspective helps you understand their behavior, and how your content is influencing it.
5. Insurance customer experience: watch out for—and zero-in on—high bounce rates
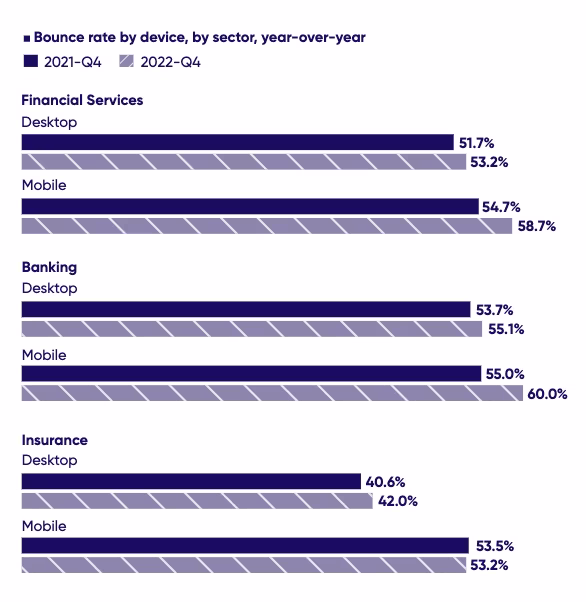
While bounce rates rose in FinServ overall, particularly on mobile devices, which saw bounce rates rise 4%, from 54.7% to 58.7% year-on-year, this rise was largely attributable to Banking.
In Insurance, bounce rates rose by 2% on desktop (to 42%, much lower than Banking’s 53.2%), but they actually decreased slightly on mobile (from 53.5% to 53.2%).
What to do and how DXA helps
Bounce rates might not have gone up much in Insurance last year, but they’re still high—and insurance carriers can’t rest on their laurels. They should be looking to reduce bounce rates wherever possible.
That means increasing engagement and user activity and reducing user frustration at every stage of the customer journey. That’s why you need digital experience analytics.
Only DXA will give you the macro and micro view of that journey to understand what’s frustrating and engaging site visitors and (through Impact Quantification) how their frustration and engagement is impacting your bottom line.
Improve the insurance customer experience with Contentsquare
Generally speaking, the insurance customer experience currently being provided by most carriers needs to be optimized from end-to-end to secure customer loyalty and drive growth in this era of intense competition and economic uncertainty.
Contentsquare’s digital experience analytics platform can make that optimization happen, fast.
Watch this 6 minute product demo to see for yourself how Contentsquare helps businesses in all sectors build better, more human (and more profitable) experiences.
![[Visual] Jack Law](http://images.ctfassets.net/gwbpo1m641r7/6K99ulcVqLqKGyNZUaPiF8/145af0b27131005d862c790ddcafb3c5/Jack_Law.jpg?w=1280&q=85&fit=scale&fm=avif)
Jack has been creating and copywriting content on both agency and client-side for seven years and he’s ‘just getting warmed up’. When he’s not creating content, Jack enjoys climbing walls, reading books, playing video games, obsessing over music and drinking Guinness.