
With competition heating up in the Financial Services industry, the firms that differentiate and win in 2023 will be those that—with the help of an analytics solution—deliver amazing digital customer experiences.
A great financial services customer experience (CX) can make a big difference to a firm’s bottom line. According to a recent Forrester report, a mere 1-point improvement on the Forrester CX Index score can lead to an incremental $123 million in revenue for a large multichannel bank—and $92 million in revenue for a direct bank.¹
And great customer experiences are far from uniform. The same Forrester report found that more than one-third of direct and multichannel bank customers believed their bank’s CX to be either poor or very poor.
But how do you know if the CX your firm is serving its customers is one of the great ones, one of the poor ones, or something in between? And what does a great financial services customer experience even look like?
That’s precisely what you’ll find out by reading the Digital Experience Benchmark report.
It gives an overview of customer behavior on banking and insurance sites in 2022, including all the most important digital KPIs for driving customer happiness and growth in 2023.
To create this report, we’ve applied our analysis to a massive dataset, compromising of:
9.4 billion page views
2.7 billion sessions
135 sites
26 countries
We’ve translated our findings into easily comprehensible graphs and charts, ready-made for use in reports to your team and executives.
And we’ve included a wealth of strategic insights to help you take on the competition going forward, whether they’re major firms or ‘neo’ newbies. (Thank us later.)
What more do you need to know? If the answer is ‘a little more, please’, we’ve got you covered: Without further ado, here’s five great reasons to download, read and share our report as soon as humanly possible.
1. Get to know your audience via 2022’s web traffic trends
This year, digital leaders in FinServ are tasked with investing in tech to improve CX and drive revenue—but also with tightening up spending in the face of a probable recession.
Knowing your audience will help you invest in things visitors (and customers) actually want, and avoid wasting time and money on things they don’t. It’ll also help you to deliver something your customers increasingly expect: Personalization.
Our report will help you understand who’s visiting your website (and your competitors’ sites), how they’re getting there and what devices they’re using.
It includes all 2022’s key traffic trends, including:
Percentage of traffic share by source (including paid vs. unpaid)
Percentage of new vs. returning visitors
Percentage of traffic driven by desktop vs. mobile
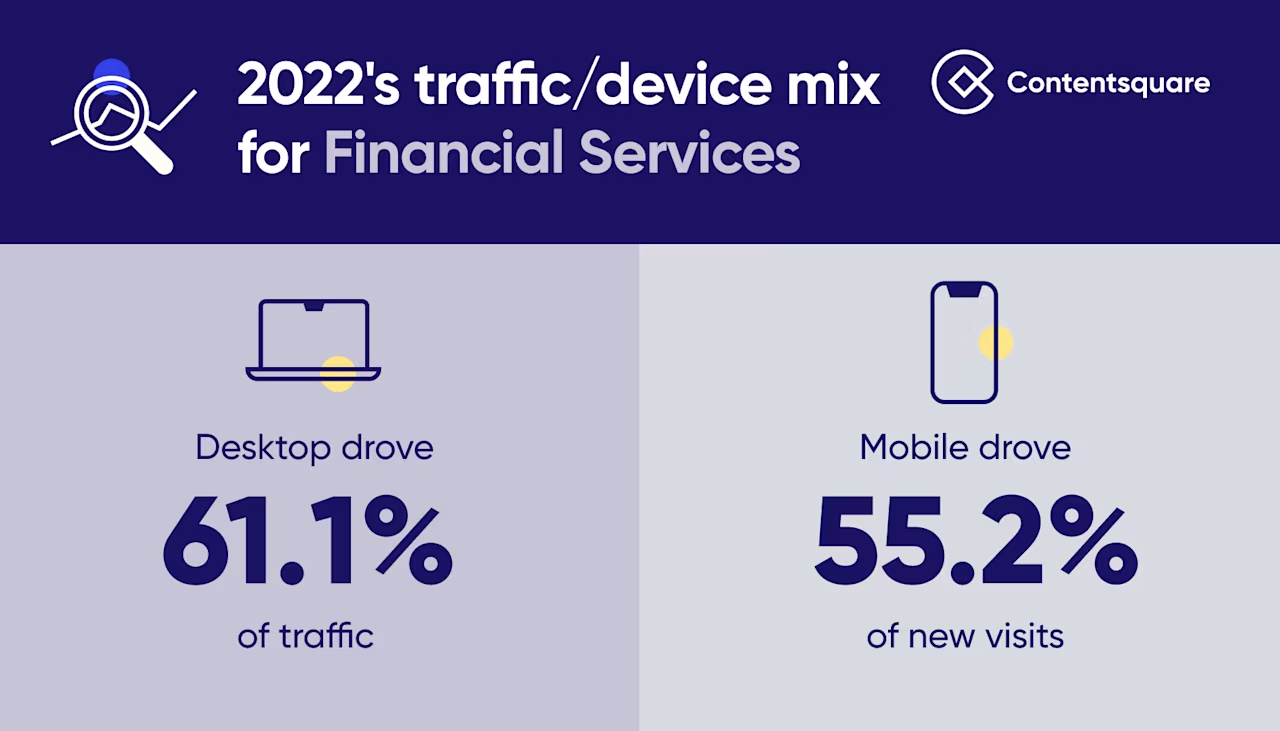
To pick out just one example of a traffic-based insight from our report, we reveal that while desktop dominated traffic (61.1% of it) in 2022, mobile web drove 55.2% of new visits.
But why was this the case? And what does this mean for your digital team’s efforts in 2023?
Well, you’ll have to read the 2023 Financial Services Digital Experience Benchmark report to find out more.
2. Understand why bounces are increasing and where they’re happening
In case you weren’t aware, a bounce is a one-and-done visit: A visitor arrives on your site and ‘bounces’ right back off it again without viewing another page.
Bounce rates rose across Financial Services last year. Most notably, they rose 4 percentage points on mobile (from 54.7% to 58.7%)—and 5 percentage points overall on banking sites (from 55% to 60%).
This certainly sounds like bad news—but is it?
Well, not necessarily. As we explain in our report, the meaning of a bounce varies depending on what sort of page it’s happening on. It certainly can signal disaster, but it can also be reflective of the sort of traffic you’d expect to arrive on a page, and/or what you expect users will try to do.
In order to give you the most nuanced picture possible of bounce rates in FinServ, we’ve sliced-and-diced them in multiple ways, showing you:
Bounce rates, year-over-year, by device and sector
Mobile bounce rates, by sector
Bounce rate by page type, by device
Bounce rate by page type
Bounce rate by page, by sub industry
However, with all that about nuance said, while a rising bounce rate might not be disastrous, it’s never ideal.
So you’re probably wondering: What can financial services firms like mine do to bring bounces down—and engagement up? That’s exactly what the next three reasons to read our report are all about.
3. Meet the frustration factors marring your financial services customer experience
A hefty chunk of bounces are caused by friction in the customer journey. By ‘friction’, we mean anything that stops website users from advancing smoothly along the path you want them to proceed along—whether that’s a path to conversion, retention or anything else.
Whether friction is caused by a malfunctioning button, a confusing site design or unclear copy, it breeds frustration. Frustration is not something you want your users to feel; it can easily cause them to exit your experience—often after viewing just one page.
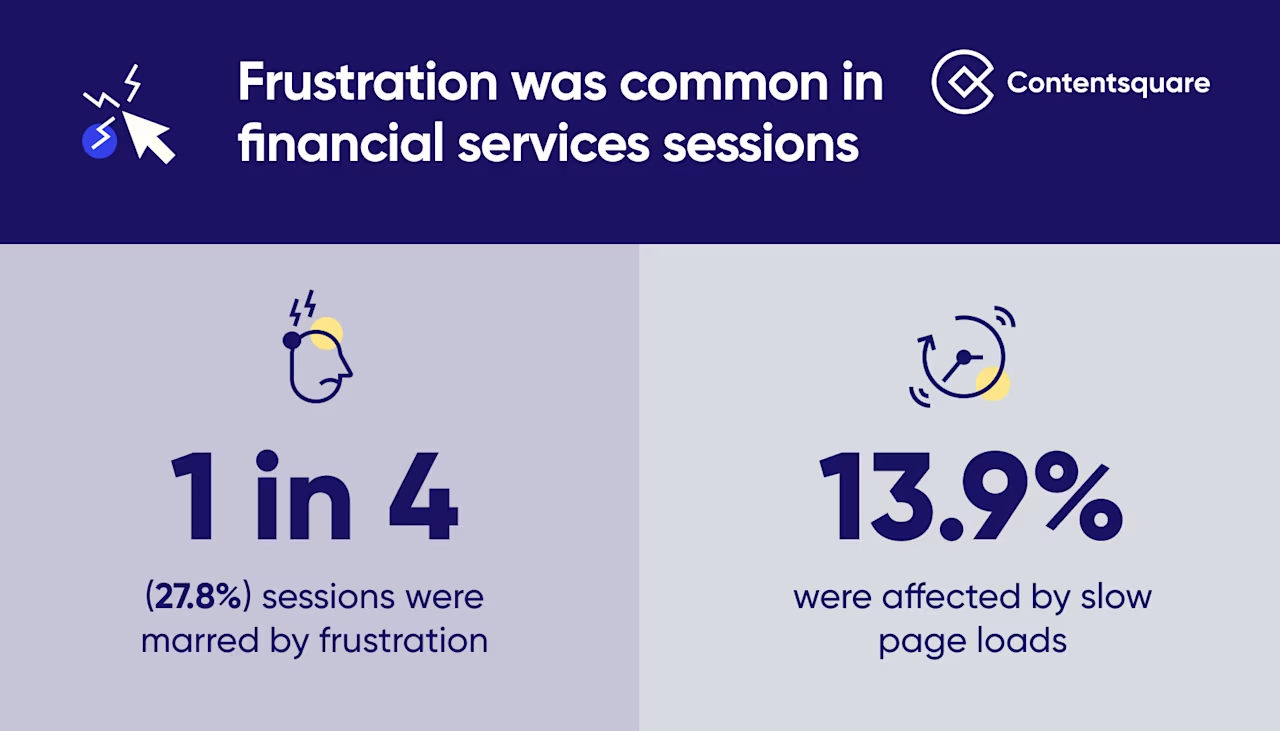
As things stand, frustration is way too common an emotion felt by visitors to financial services websites. Our report reveals that frustration impacts more than 1 in 4 (27.8%) of all FinServ website sessions (fortunately, that’s lower than most other industries, which see more than 1 in 3 visits causing frustration).
The causes of frustration are numerous. The 2023 Financial Services Digital Experience Benchmark report lists the five most common and impactful frustration factors affecting both banking and insurance websites.
You should read the report to get to know, loathe and address them all.
But let’s start with public enemy number one…
4. Learn why site speed is higher stakes than ever for financial services customer experiences
Frustration caused by slow page loads affected 13.9% of financial services sessions in 2022. All these slow page loads undoubtedly helped fuel bounces, as another finding in our report suggests…
Financial services sites with load times over 2 seconds had a 56.5% bounce rate. Financial services sites with the fastest load times (of less than 1 second) had a 51.4% bounce rate.
The good news is that firms seem to be well aware of the importance of site speed, given that site load time decreased by -9.1% year-over-year across all devices.
On the other hand, some of the most heavily trafficked page types for both banking and insurance firms have some of the highest average load times.
The data in our report should help bolster your case—if it needs bolstering—for ratcheting up your site performance as much as possible. Clearly, financial services sites are faster than ever, and users’ expectations for load times are set to get ever more unforgiving.
5. Discover the bounce-thwarting power of user activity
A fast-loading page might stop many users from bouncing off your site, but the effort to stop them from exiting doesn’t stop there.
Removing the friction points we discussed above will help discourage users from leaving, but you also need to engage them as much as possible.
By ‘engage’, we don’t just mean the mental engagement involved in sparking their interest in your products and services and nurturing their desire to act on this—we also mean encouraging them to physically interact with your site.
Our report shows that encouraging users to click, scroll, swipe and type while navigating through your website makes them stick around—and delve deeper.
Compared to sites with the lowest levels of activity, sites with high user activity see -58% lower bounce rates and +41% deeper sessions (with session depth measured by how many pages a user views per session).
To learn more about activity—including which page types see the most activity for both Banking and Insurance, you should know by now what you need to read…
Optimize your financial services customer experience for ROI with Contentsquare
Armed with the insights that our 2023 Financial Services Digital Experience Benchmark report is frankly overflowing with, you’ll be able to make many improvements to your financial services customer experience. But how will you measure those improvements—and prove them?
It might not be easy. According to Forrester, 54% of CX pros are unable to prove the ROI of their projects. In this time of acute economic uncertainty, that inability to prove impact could spell doom for your CX programs.
To successfully improve your digital customer experience—and prove you’ve done it—you’ll need to measure all the metrics we talk about above, plus the metrics we didn’t have room for.
You can do that with Contentsquare’s Digital Analytics Cloud, our platform that tracks and gives insights into customer behavior at every stage of your customer journeys.
By using Contentsquare to monitor and optimize your journeys, you can generate serious ROI.
Just ask Forrester. They recently published a report on the Total Economic Impact™ of Contentsquare over three years.
The report found that a composite organization—based on extensive interviews with five of our customers—achieved an amazing 602% ROI from Contentsquare and payback in six months.
Yes: 602%. Download Forrester’s TEI report on Contentsquare to see for yourself just how great for your CX, ROI and salary bump Contentsquare can be.
![[Visual] Jack Law](http://images.ctfassets.net/gwbpo1m641r7/6K99ulcVqLqKGyNZUaPiF8/145af0b27131005d862c790ddcafb3c5/Jack_Law.jpg?w=1280&q=85&fit=scale&fm=avif)
Jack has been creating and copywriting content on both agency and client-side for seven years and he’s ‘just getting warmed up’. When he’s not creating content, Jack enjoys climbing walls, reading books, playing video games, obsessing over music and drinking Guinness.