Quickly understand the impact of good and bad digital experiences
Want to see how a good experience pays off? Quantify how many customers experience a specific event—then learn how it impacts conversions, revenue, and more. Effectively prioritize your workload by identifying high-impact improvements.
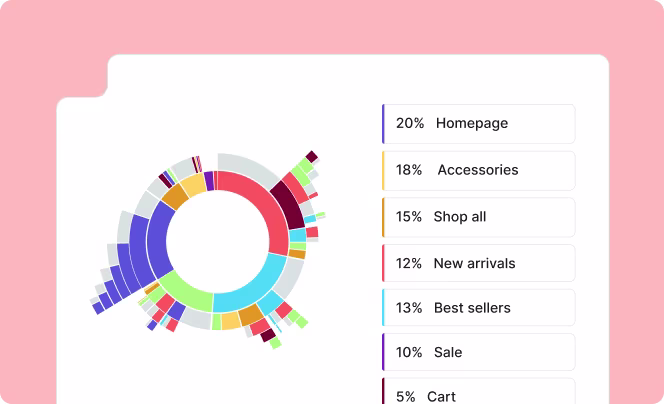
See what the most impactful experiences are on your site, then double down on them
See which audience segments carry out specific behaviors or experience certain events
Find out which potential changes will make the biggest difference to your site or app
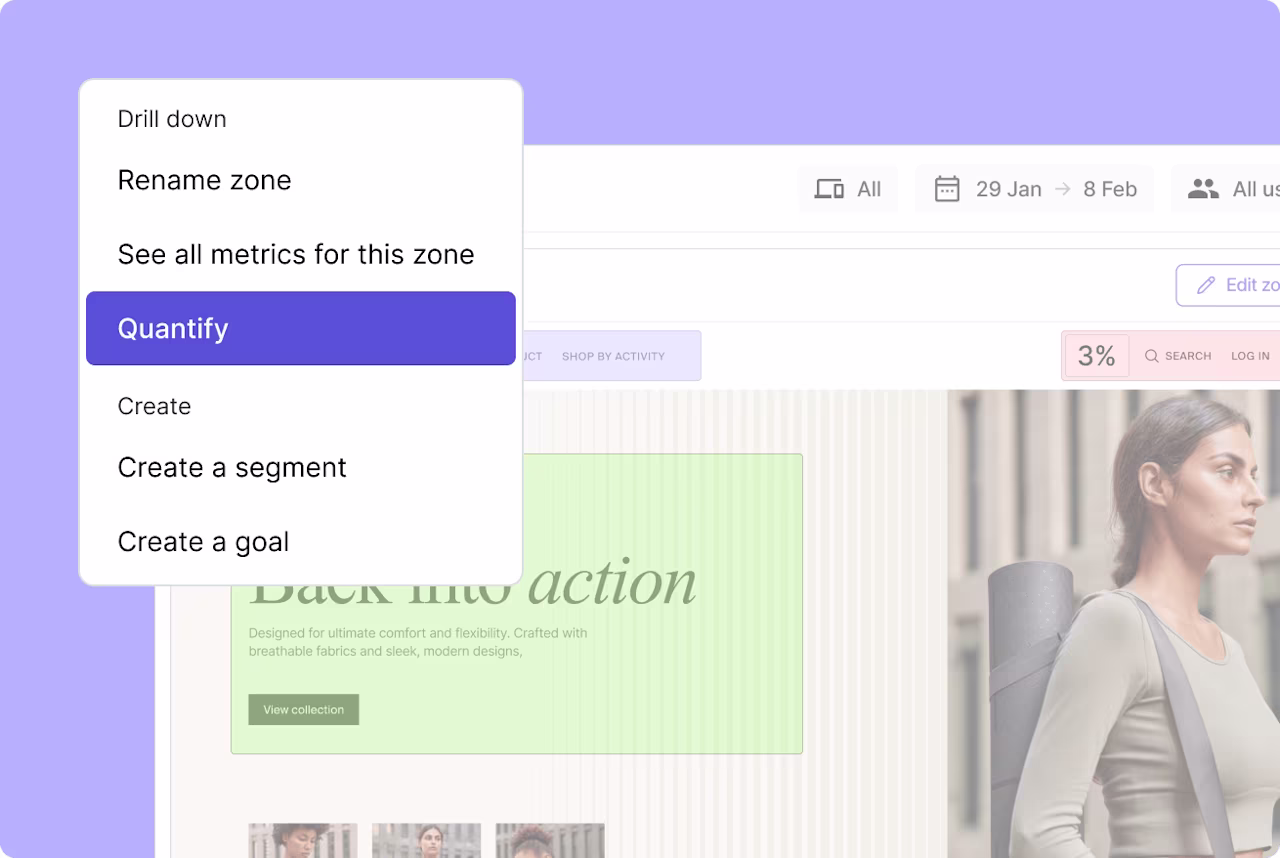
Find insights your way
Get insights ‘bottom up’ by starting with a single event and quantifying how many others experienced it. Or go ‘top down’ by starting with your biggest issues or opportunities and drilling down to individual customer experiences.

Instantly measure impact
Wondering how parts of your digital experience affect business outcomes? See how pages and page elements impact conversion, revenue, subscriptions, and more.
Go deep into demographic details
Compare impact across different groups to find out which users are most affected by an issue, event, or behavior. Measure impact across specific browsers, devices, and more to identify the root cause.

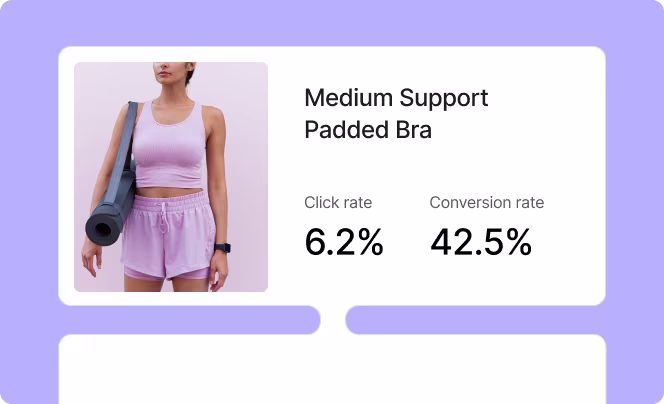
Link behaviors to metrics
Now you can shine a light on how any user behavior impacts your business. For example, see how many users clicked a link or took a specific path to your checkout. Compare them with users who did a different action to see which group converted better.

Get your teams aligned on the highest priority tasks
See how any potential change affects your revenue
Quantify the impact of insights you find in other Contentsquare tools with 1-click. Immediately identify how any behavior, event, or issue impacts revenue, so you can gauge the return on investment of potential changes.


Make better decisions about upcoming tasks by assessing impact
Avoid investing too many resources in low-impact problems and opportunities. Impact Quantification lets you understand how important any discovery is, so you can help your teams prioritize effectively.
Compare performance to set realistic business benchmarks
Use Impact Quantification to compare how different segments contribute to business goals. See the best results from different traffic sources, devices, time periods, and more to set internal benchmarks.

Discover more
Make data-driven decisions by understanding how users progress through your site, page by page, from entry to exit.
Boost revenue from key placements by understanding the driving factors impacting your product, brand, and category sales.
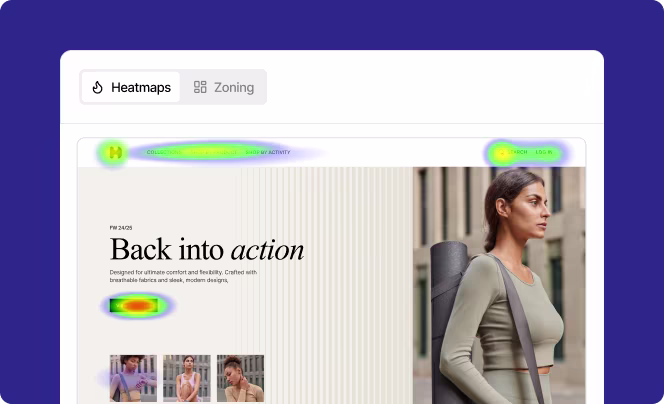
See where users click, hover, and scroll, so you can understand where users get distracted—and what grabs their attention.
View the session replay for any individual survey response to get the full picture of the user's experience.
Frequently asked questions
A problem-solving website addresses users' challenges by providing information, solutions, or resources related to specific issues. These websites aim to guide users through problem-solving processes, offering helpful insights and assistance.