Take a product tour
Get to grips with Contentsquare fundamentals with this 6 minute product tour.


The company attracts tens of thousands of customers daily, and any opportunity to improve customer experience is a potential revenue generator. Investing in digital experience analytics is helping them reduce customer friction and better understand their customers.
Speaking at CX Circle Melbourne, Kelly Truong, MyDeal’s Experience Design Lead, shared how Contentsquare helps MyDeal’s UX team track non-interactions, proactively spot frustration and make data-driven decisions.
Here are three tips from MyDeal to help you optimize your customer journey.
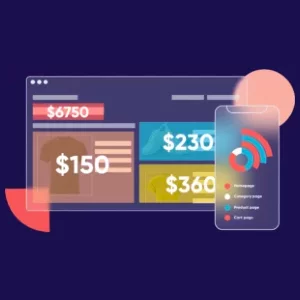
Experience metrics like hesitation time, attractiveness rate, and scroll rate hold clues to why your customers behave the way they do and how you can improve their digital experience to drive conversions.
However, traditional web analytics platforms don’t track these non-interactions. You’ll need to do some serious guesswork based on your existing data or set up specific event tags to collect the data.
Both options aren’t ideal in the long run. Here’s how MyDeal navigated this sticky situation.
Challenge
Data tracking was a pain for Kelly’s team before Contentsquare. Their existing tools couldn’t collect data retroactively, so they had to know the goals and digital components they wanted to monitor beforehand.
As a result, they didn’t have any data on questions they didn’t expect—relying on assumptions, industry best practices, and gut feel to fill the gaps.
In Kelly’s eyes, this was not proactive or effecient, so they turned to Contentsquare to get the answers they needed.
Action:
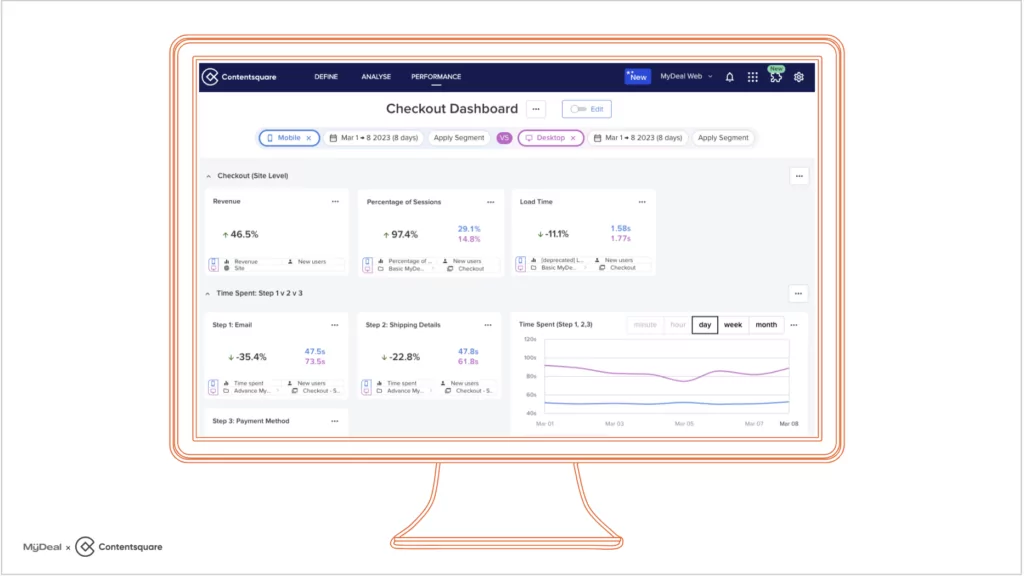
On Contentsquare, Kelly’s team first created workspaces for each of their key pages to monitor performance across pages and zones. The team also made custom alerts to detect performance anomalies.
What’s more, Contentsquare’s tagless implementation meant Kelly no longer needed to painstakingly pre-plan event tags to get data. Contentsquare automatically captures every click, scroll, hover, and swipe, helping Kelly’s team answer questions they weren’t expecting with confidence.
Results:
Kelly and her team can now track the non-interactions they need to analyze what visitors found engaging, helpful, or frustrating. Together with Contentsquare’s Journey Analysis and Session Replay features, she has a 360-degree view of how customers use their digital platforms.

The new experience metrics Kelly can access to measure customer behavior with Contentsquare
These insights unlocked a more flexible and efficient way for her team to work. At a glance, Kelly knows what’s working and needs improvement, helping her team address issues more proactively. It’s also easier for Kelly’s team to choose specific segments or journeys to optimize further, allowing the UX team to be more proactive and less reactive.
Every minute customers spend having a frustrating experience on your website can be thousands of dollars in revenue lost. And according to our 2023 Digital Experience Benchmark Report, more than one in three website visits cause frustration, affecting engagement and conversion.
Thus, spotting and solving any frustration quickly is vital, especially on your product, category, and checkout pages. Here’s how Kelly’s team used Contentsquare to spot frustrations and devise a solution to avoid revenue loss.
Challenge:
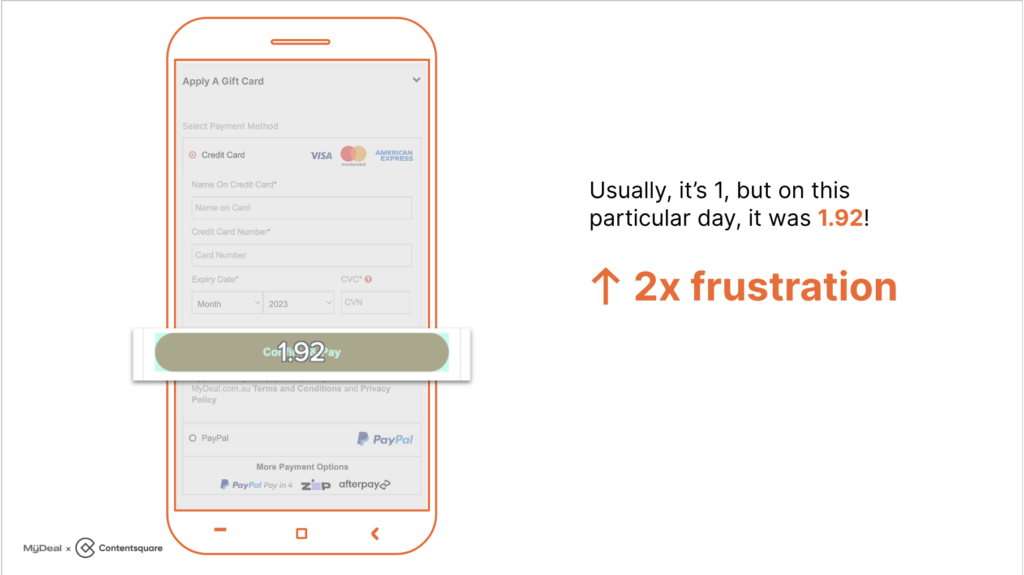
Using Contentsquare’s Zone Based Heat Mapping, team noticed that customers were clicking up to five times more frequently on a credit card form field at checkout.
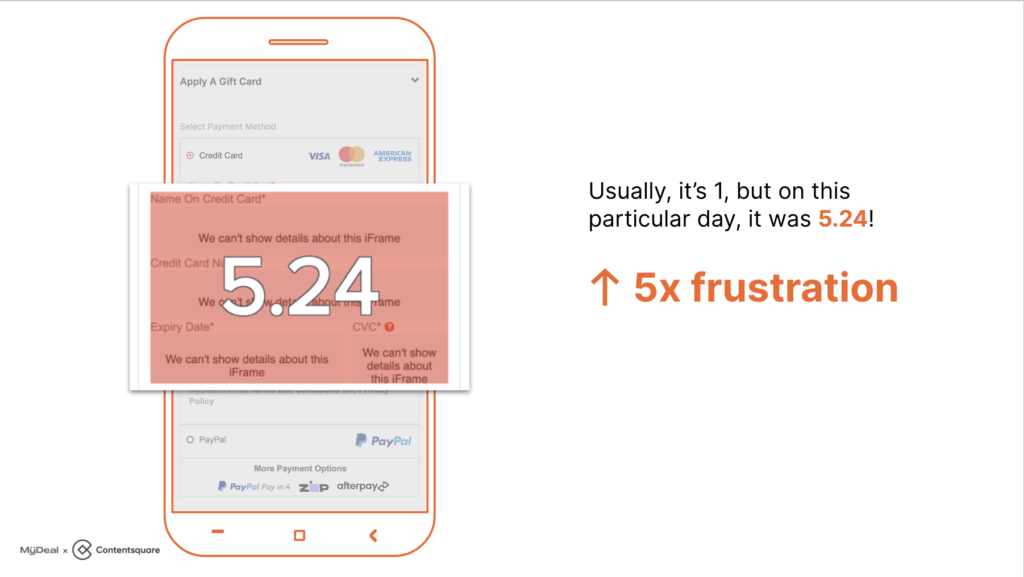
The troubling signs didn’t stop there. The team found that customers clicked on the Confirm and Pay button twice as often—indicating frustration and a high risk of losing customers before conversion.
Action:
When Kelly and her team find a potential issue, they use the WWWWWA acronym to break it down and analyze it constructively:
With this method, they can interpret an issue in the proper context, understand the customer’s perspective, and account for any dependencies before making a recommendation.
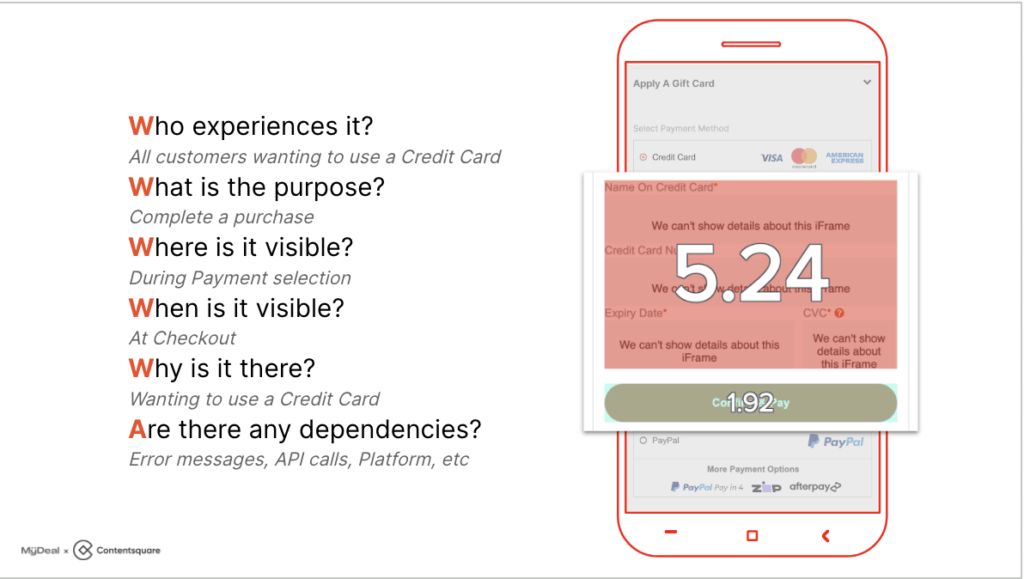
How my deal’s UX team analyzed an issue using the WWWWWWA problem-solving method
Results:
Kelly’s team shared insight on customer behavior and device information to help their analysts and developers quickly determine how to fix the error. Conversion rates went up by 2% while reducing fix times.
Picture this: you’ve had a great sales week.
But what made it successful? Was it the quality of your sales offer? Or did a web banner or a button perform exceptionally well? Countless factors can influence your conversions and sales, making identifying the exact reason challenging.
But, with the right insights, you can make your website work harder and improve sales. Or, in Kelly’s case, triple a homepage carousel’s return on investment (ROI).
Let’s find out how the team got there.
Challenge:
Before Contentsquare, Kelly and her team couldn’t tell which parts of their website were driving sales, preventing them from making informed recommendations to the marketing and merchandising teams to improve engagement.
The team spotted an opportunity for improvement with Contentsquare. Even though their home page was their fourth most visited page on mobile devices, most people spent only 27 seconds on it and barely scrolled.
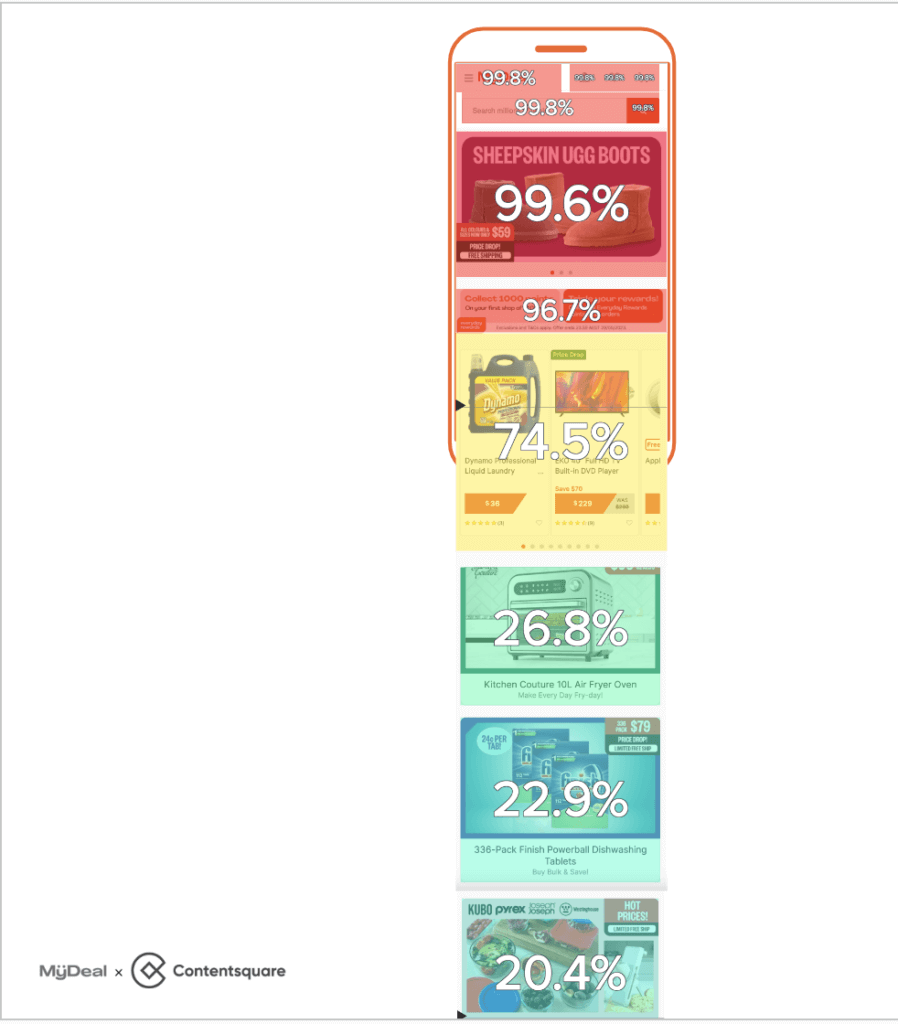
MyDeal’s initial homepage engagement metrics on mobile
Action:
Using Zoning Analysis, they compared homepage engagement over the peak Christmas and Boxing Day sales season with the post-Christmas and Back to School season, looking at metrics like tap rate, exposure rate, attractiveness, and revenue generated.
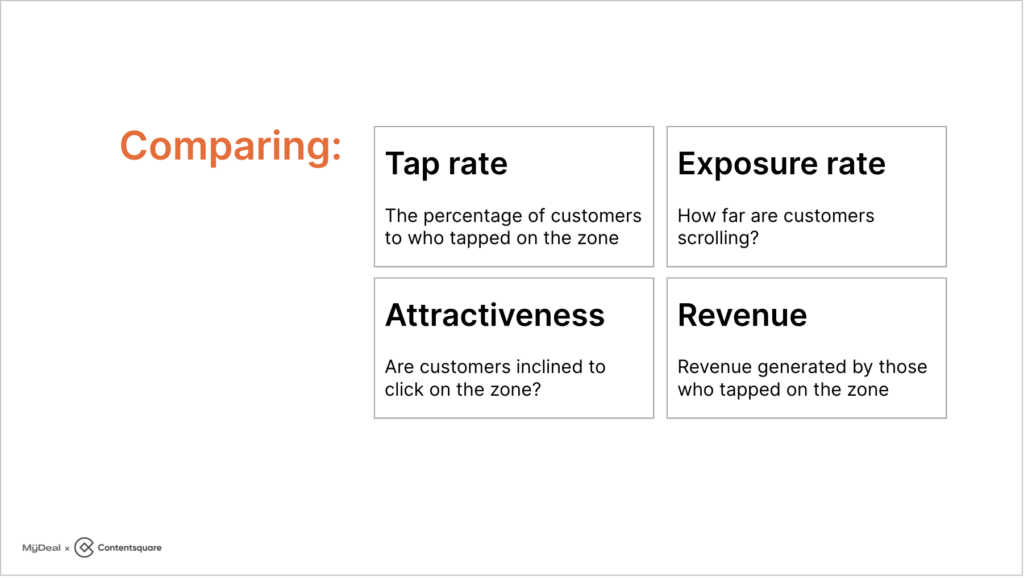
The four metrics MyDeal used to compare homepage engagement on mobile devices.
Kelly’s team found their Categories carousel and Product Recommenders at the end of the home page had significantly higher engagement and attractiveness than the carousel at the start of the page. They hypothesized that labeled carousels show more products and break up the content on mobile, encouraging deeper browsing.
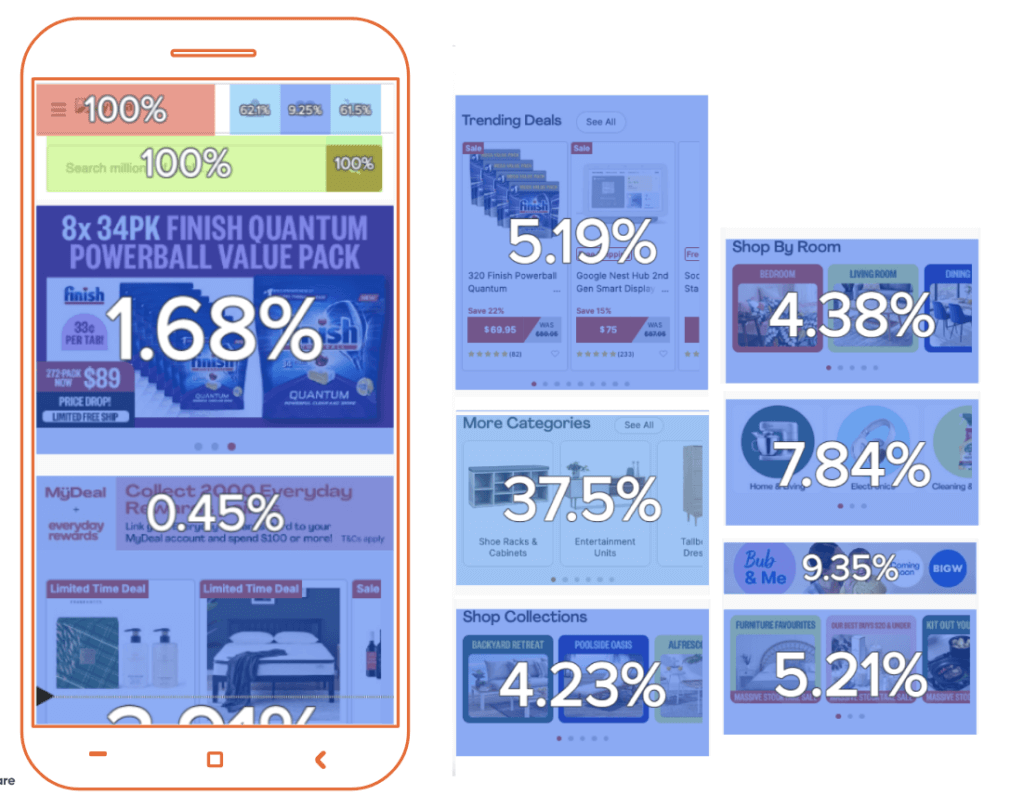
Difference in carousel engagement rates from the beginning of the homepage (1.68%) to the end of the homepage (4.38%)
Results:
This simple change helped them see a massive improvement in their Trending Categories homepage carousel, generating 336% more revenue and doubling click rates on a page view and session level.

Engagement metrics and ROI before and after the change in carousel
Be proactive, not reactive: Online user experiences matter and affect customer conversion and retention. Keep an eye on critical conversion points like checkout pages for any signs of user frustration to avoid losing revenue opportunities.
Make decisions on actual data: Many factors influence conversions and sales. With the correct data to pinpoint what made a campaign successful, you can replicate its success or find opportunities to improve.
Don’t be afraid to ask why: Spotted a potential issue? Be sure to analyze the context, understand the views of different teams, and any limitations before you make a recommendation. Structured inquiry methods like WWWWWWA help organize your thoughts.
Watch the 6-minute demo below. Then drop us a line.
Take a product tour Get to grips with Contentsquare fundamentals with this 6 minute product tour.
Take tour