Uncover the friction that’s slowing users down
Automatically identify the biggest areas of struggle that make customers leave. Rank frustrations by business impact to prioritize the most important fixes. Understand user behaviors that lead to frustration so you can find helpful resolutions.
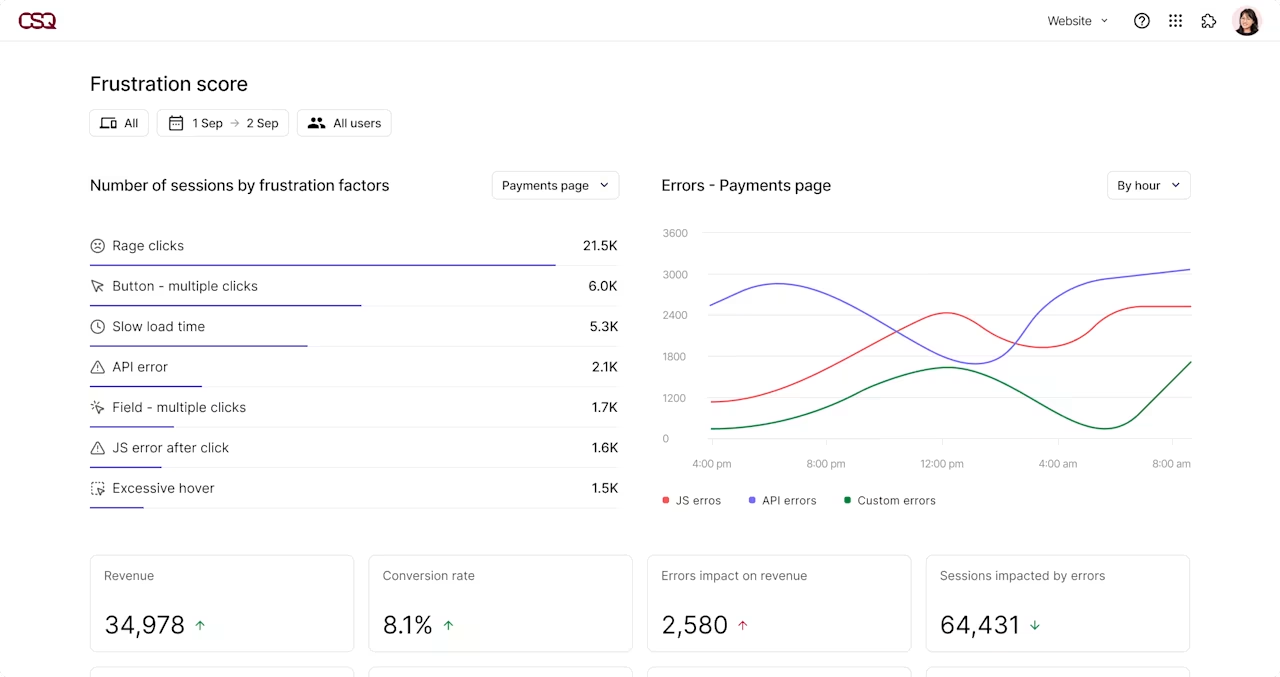
Focus on the issues causing the greatest frustration
Fix the frustrations that make users leave your site
Remove obstacles and keep customers moving through the funnel
Automatically surface the places where users feel most frustrated
Contentsquare’s intelligent scoring detects signs of frustration—like rage clicks and repeat attempts completing form fields. See where friction occurs and how it impacts experience, conversion, and revenue.

See which frustrations are costing your business the most
Impact Quantification ranks sessions by business impact, so you can immediately jump to the most helpful replays. And when you’re reviewing replays, timeline icons let you skip straight to the places where users encountered friction.

Stay on top of frustration
Make sure that new issues don’t go unnoticed by proactively monitoring for sudden increases in user struggle. Get an automated alert when signs of frustration spike—then investigate further with connected tools like session replay, error analysis, and impact quantification.

Automate your friction-finding processes
Start with the frustrations that hurt your business the most
No team has time to monitor every journey or customer. Let Contentsquare automatically surface the most critical points of friction as they happen.

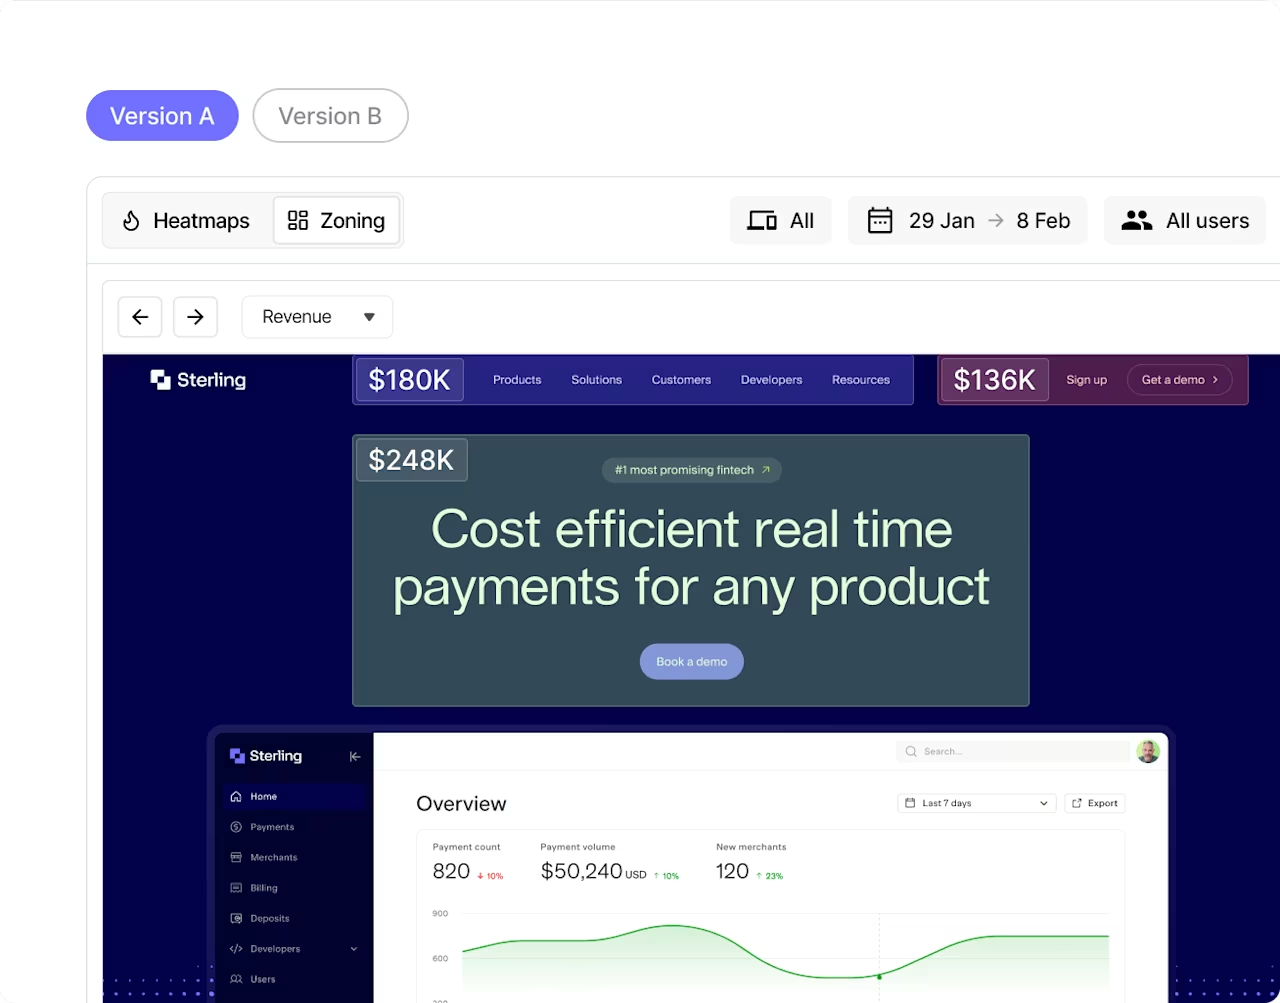
Build higher quality products faster by finding usability issues quickly
Deliver more and higher quality releases with your team by detecting usability issues with new experiences as you launch them.
Scale your team with the power of AI
Want to save time and increase the impact of your team? Use AI to eliminate false positives and focus on friction that’s hurting customer experiences and conversions.

Discover more

Find and fix the errors that hurt your business the most.

Track and improve vital website metrics that affect conversions and SEO.
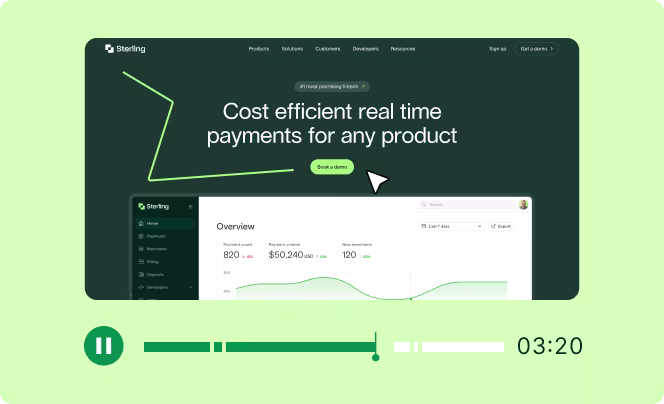
View the session replay for any individual survey response to get the full picture of the user's experience.