
Have you ever wondered which areas of your webpage have the greatest impact?
Zone-based heatmaps provide clear answers by breaking down metrics for specific sections of your page. They help you uncover details like the exact revenue your above-the-fold CTA generates or how long users hesitate before clicking key links.
With Zone-based heatmaps, you can analyze pages in seconds, share insights effortlessly, and confidently answer critical questions about user behavior.
Here’s how this heatmap works—and how Zone-based heatmaps can reveal actionable insights.
What are Zone-based heatmaps?
Zone-based heatmaps are areas that give you detailed metrics for different zones on your site.
For example, the below zone-based heatmap ties a dollar value to different zones—so you can see which ‘zones’ of your site contribute most to your bottom line, and which ones you may need to rework.
![[Visual] File — two-columns-feature-placeholder-1 - Zoning experience and revenue attribution](http://images.ctfassets.net/gwbpo1m641r7/5ELMCzDenXvDdRmgYUkfyO/019e4a34ebb968bbf30f10165416decb/Experience_and_revenue_attribution.png?w=1280&q=85&fit=scale&fm=avif)
Zone-based heatmaps show the revenue associated with different zones
Different metrics you can view in Contentsquare zone-based heatmaps include
Revenue
Click rate
Exposure rate
Hesitation time
Click distribution
And more.
How Zone-based heatmaps enhance your site’s layout, content, and usability
Here are the top three things Zone-based heatmaps help you accomplish.
1. See the most engaging parts of your site
Zone-based heatmaps let you quickly see which parts of your page are underperforming so you know what to fix.
For example, if you’re a designer in an ecommerce company, it’s easier to tweak your site’s layout when you identify the most engaged zones of your homepage. Surface high-value elements earlier, such as a call-to-action (CTA) button that users click halfway through the page. Confidently redesign the page based on the actionable insights Zone-based heatmaps provide.
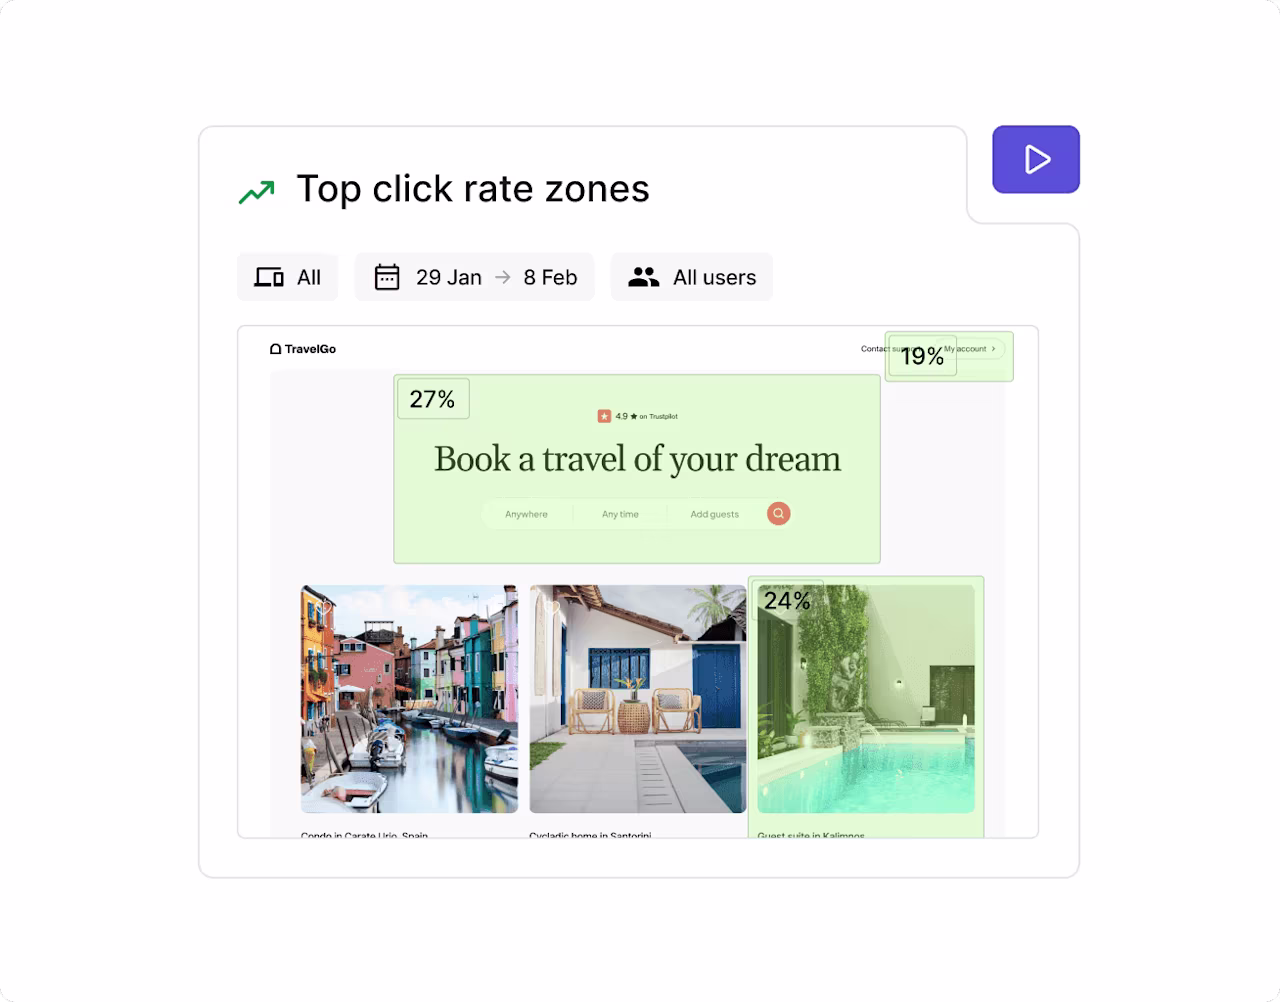
View the click rate of different zones on your site’s pages
2. Identify engagement patterns on any page
Whether you have dozens or hundreds of pages to analyze, Zone-based heatmaps enable you to spot your users’ behavior patterns. Specifically, you can study these patterns to improve your site’s ease of use.
Suppose you’re a product manager of a SaaS company who wants to evaluate your settings screen’s usability. You notice that users often interact with the items at the top and a couple more buried at the bottom of the page. This could mean you need to reorder the bottom menu items or completely remove unnecessary ones.
In this case, you should also tap into the rest of our experience intelligence tools and features—such as Session Replay, Surveys, and Voice of Customer—to fully understand the reason behind your users’ behavior.
3. Tie dollar amounts to specific zones
Zone-based heatmaps tie revenue to specific areas of your site, making it easier to get buy-in for your ideas.
For example, a marketer looking to tie attribution to various content—like bottom-of-the-funnel blog posts and guides—can use Zone-based heatmaps to pinpoint areas of content with a high ROI.
This allows you to not only demonstrate the value of different content, but prioritize future content that can produce similar results.
How to use Zone-based heatmaps in Contentsquare
You can access zone-based heatmaps with a Pro or Enterprise plan. After signing up, you’ll need to install Contentsquare’s tracking code.
After installing the code, head into ‘Zoning Analysis.’
Click ‘Select a page or page group.’
Then, define which pages or page groups you’d like Contentsquare to create zone-based heatmaps for. You can analyze
A single url from your site
Data from multiple urls
A page group from an existing mapping, like blog posts
Finally, click ‘Analyse now.’
Contentsquare will begin collecting data that you can view by selecting ‘Zoning’ from the heatmap dropdown and choosing the metric you want to view for each zone.
Continue gathering insights with Session Replay
With Contentsquare, a set of relevant recordings is available for each of your saved heatmaps. You can replay these sessions, made up of an individual user's visits across multiple pages, to understand what customer journeys look like, what someone did on a page, and why they clicked on a page element.
To watch a session replay, hover your mouse over the zone and click the ellipses ‘...’ menu.
Select ‘See Clicks in Session Replay’ or ‘See Hovers in Session Replay’ from the dropdown menu. After clicking, a window will open with all relevant replays.
Review recordings of users that interact with specific zones
Get in the zone before making design and content decisions
Zone-based heatmaps provide a simple yet powerful way to understand user engagement on your site. With just one click, you can quickly identify which page parts and elements are getting love from your users—and which could be working harder for you.
Take on this smarter, more efficient approach to gathering actionable insights from Contentsquare Heatmaps. Dive into the zone to uncover valuable user behavior patterns that inform your website improvement decisions starting today.
FAQs about Zone-based heatmaps
Zones are different sections of your site with assigned metrics. They’re part of Contentsquare’s zone-based heatmaps and can tell you which areas of your site have the highest click rate, engagement rate, revenue, and more.
This type of heatmap lets you analyze pages in seconds so you can be more confident making decisions related to site improvements.
![[Visual] Contentsquare's Content Team](http://images.ctfassets.net/gwbpo1m641r7/3IVEUbRzFIoC9mf5EJ2qHY/f25ccd2131dfd63f5c63b5b92cc4ba20/Copy_of_Copy_of_BLOG-icp-8117438.jpeg?w=946&q=85&fit=scale&fm=avif)