Take a product tour
Get to grips with Contentsquare fundamentals with this 6 minute product tour.
Adobe Analytics has been known as the world’s most advanced web analytics platform ever. For over two decades, the world’s leading digital teams have managed their businesses based on Adobe Analytics data.
While Adobe Analytics remains equally valuable today, websites and apps are not what they used to be when Adobe Analytics was first created under the name of Omniture (or even My Computer before then)
Adobe Analytics was originally created in an era when websites used to be mere electronic brochures back in the early 2000s. During the rise of ecommerce and lead gen websites in subsequent years, Adobe Analytics kept up with the trend by adding strong marketing and conversion reporting.
But today’s websites and apps are incredibly rich and interactive content experiences. Understanding user behavior and what’s working vs. not for engaging potential customers now requires much more detailed insights than pageview level data and conversion metrics. Especially so, for experiences on small mobile screens.
Perhaps 99% of user journeys and behaviors are happening inside pages and screens now, i.e.
Understanding these rich experiences requires analytics built for the modern era. That’s exactly what led to the rise of modern analytics solutions, also known as Product and Experience Analytics.
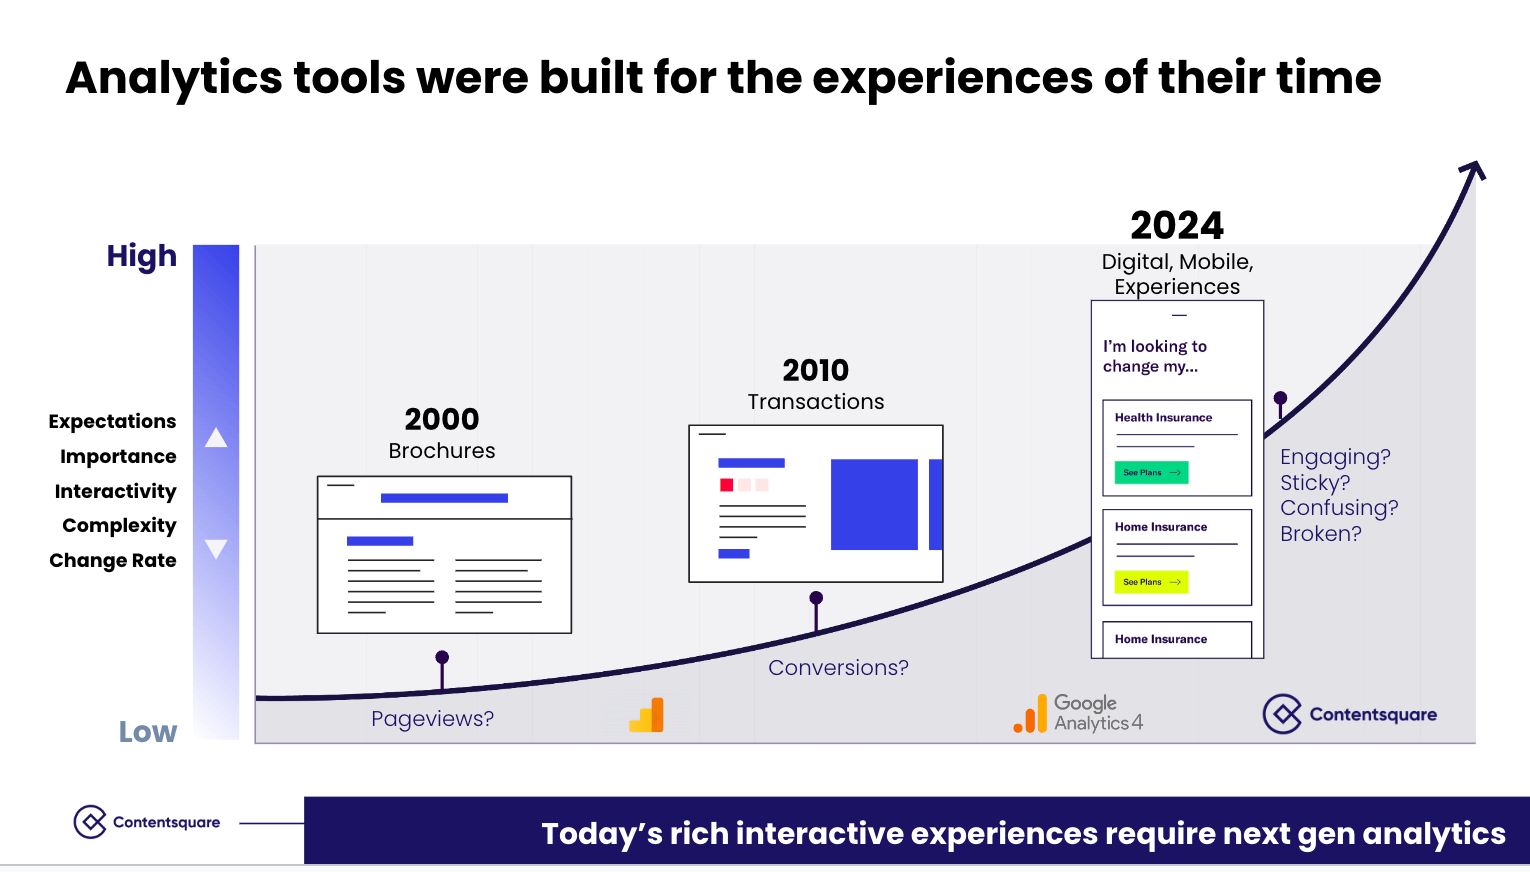
Today’s rich interactive experiences require next gen analytics that goes beyond pageview level of insights
Adapting traditional analytics tools to capture the level of data needed for understanding today’s experiences requires the workaround of deploying additional data collection tags for every in-page click event that teams want to analyze.
But the common concern is that every additional tag takes time to deploy and requires teams to wait before they can answer questions. Manual tagging analytics tools require too much customization and manual tagging to be practical. Teams want to extend these traditional tools for understanding dynamic web and app interactions, but oftentimes they simply can’t seem to tag quickly enough to close data gaps for being able to answer the everyday questions that come up.
Common complaints we hear from the users of these tools are
That’s why many companies come to Contentsquare for an alternative option.
Adobe and Contentsquare are both top-rated platforms for digital analytics. They are frequently compared to each other.
Whether you are best served by augmenting Adobe with Contentsquare Experience Analytics or replacing some of your Adobe use cases with Contentsquare Product Analytics depends on your goals.
Companies looking for alternatives to Adobe Analytics have found a solution in Contentsquare Product Analytics that enables them to more easily answer everyday questions about their website and app users with the benefit of Contentsquare’s industry-leading capability to auto capture behavioral data. Autocapture in Contentsquare has been refined over 10 years of R&D investment.
Contentsquare Product Analytics and Adobe are even better when combined with Contentsquare Experience Analytics. Hundreds of enterprises today use Contentsquare Experience Analytics to transform their users’ ability to make data-driven decisions with the help of immersive visual insights into user experiences, frustrations, and their underlying root causes.
In a typical joint usage scenario,
The combination helps teams
Contact us to get recommendations for your specific use cases and to learn how Contentsquare can save you time, effort and costs.
Instead of jumping into a tool comparison, start from your business goals. What are your biggest business challenges? Choose the platform that’s designed to help you achieve your goals.
Here’s an overview of the main use cases that Contentsquare and Adobe Analytics were designed to solve, from our perspective
| Typical business goals and use cases | Contentsquare | Adobe |
|---|---|---|
| How do we improve marketing acquisition? | Very Strong | Very Strong |
| How do we create better products and drive user adoption and growth? | Very Strong | Strong, but limited due to typical data gaps |
| How do we improve experiences, content engagement, and conversion? | Very Strong | Very light |
| How do we surface obstacles and prioritize what to fix based on revenue impact? | Very Strong | – |
| How do we create happier customers by collecting their feedback and making sense of it? | Medium | – |
| Part of a larger platform | 115+ integrations with best of breed providers |
Very Strong, e.g. Adobe Experience Platform. |
The use case that both Adobe and Contentsquare support well is to improve marketing acquisition.
For marketers working on acquisition challenges, both Adobe and Contentsquare provide valuable metrics on campaign traffic and conversion.
Beyond the basics, Adobe’s strengths for improving marketing acquisition include
Tracking marketing analytics in an Adobe dashboard. Source; Adobe documentation
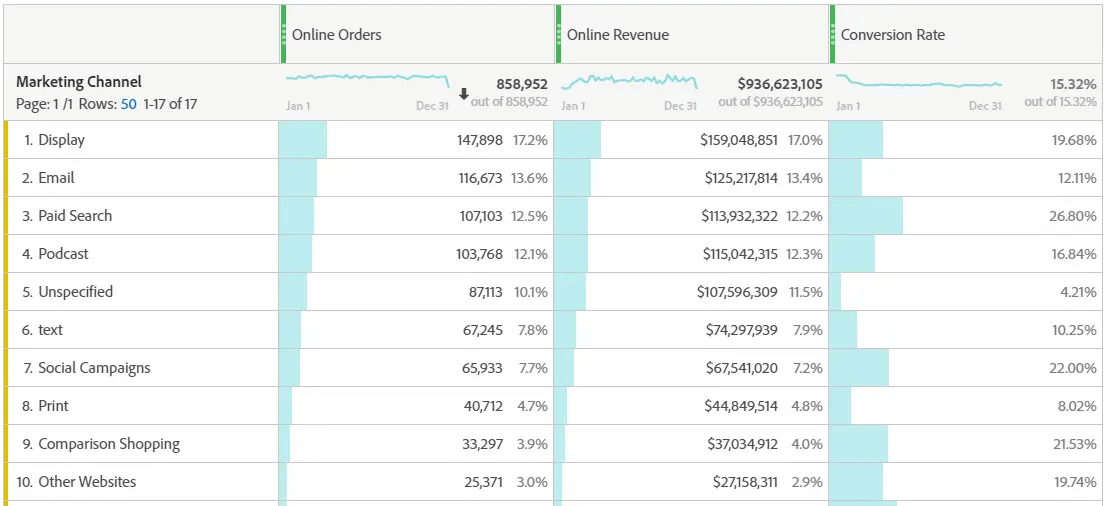
Meanwhile, Contentsquare’s Web Analytics capabilities also let you gain deep insight into your marketing acquisition channels, e.g. traffic and conversion metrics by campaign..
A marketing acquisition overview dashboard in Contentsquare
With the addition of Contentsquare Experience Analytics, your firepower for increasing Marketing ROI goes up dramatically.
To understand and target customers optimally, Adobe enables users to define precise customer segments. Many enterprises have dozens, if not hundreds, of segments defined in Adobe that enable everyone on the team to work with the same version of truth about a group of customers.
Wouldn’t it be helpful if you could import those Adobe segment definitions into Contentsquare to gain immersive visual insights into the behavior of these audiences when they browse your site? What content attracts them vs. doesn’t? What is their intent? What are their experiences?
That’s exactly what you can do with the integration between Contentsquare Experience Analytics and Adobe.
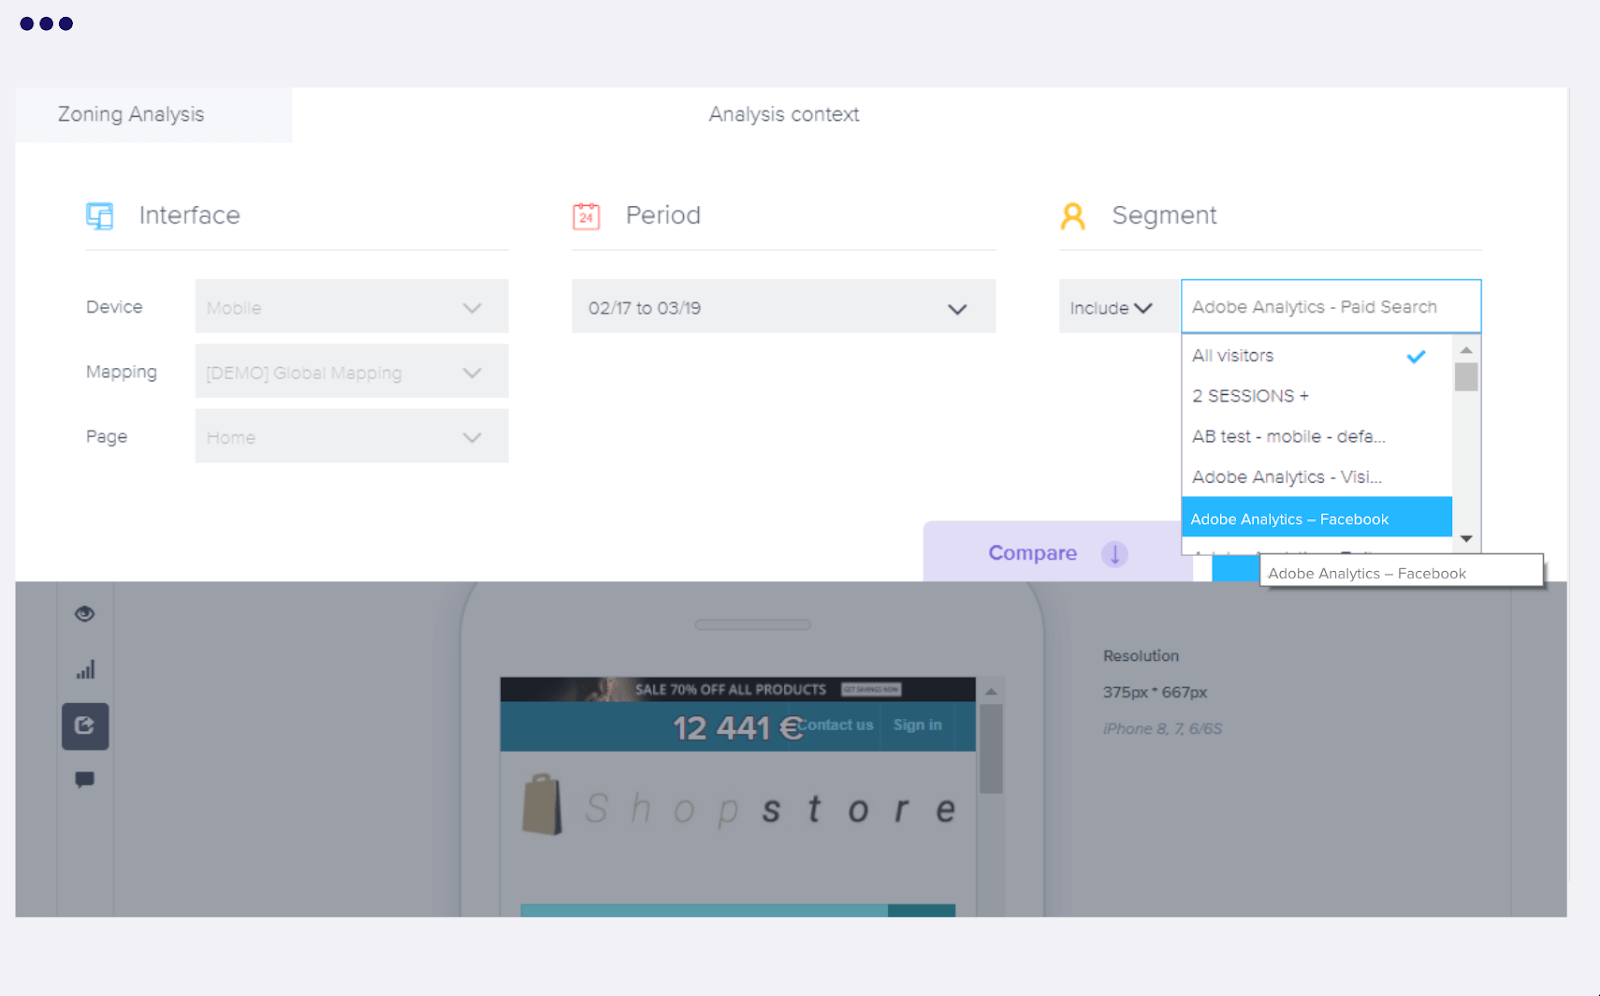
Import and selecting a Adobe Segments to filter any report in Contentsquare
Perfect synergetic use case!
Another example of Contentsquare’s value for improving Marketing ROI is through its integration with all leading A/B testing platforms, including, of course, Adobe Target.
For Marketers looking to run A/B tests for reducing bounces and increasing marketing campaign conversions, these integrations help to improve results in 3 ways:
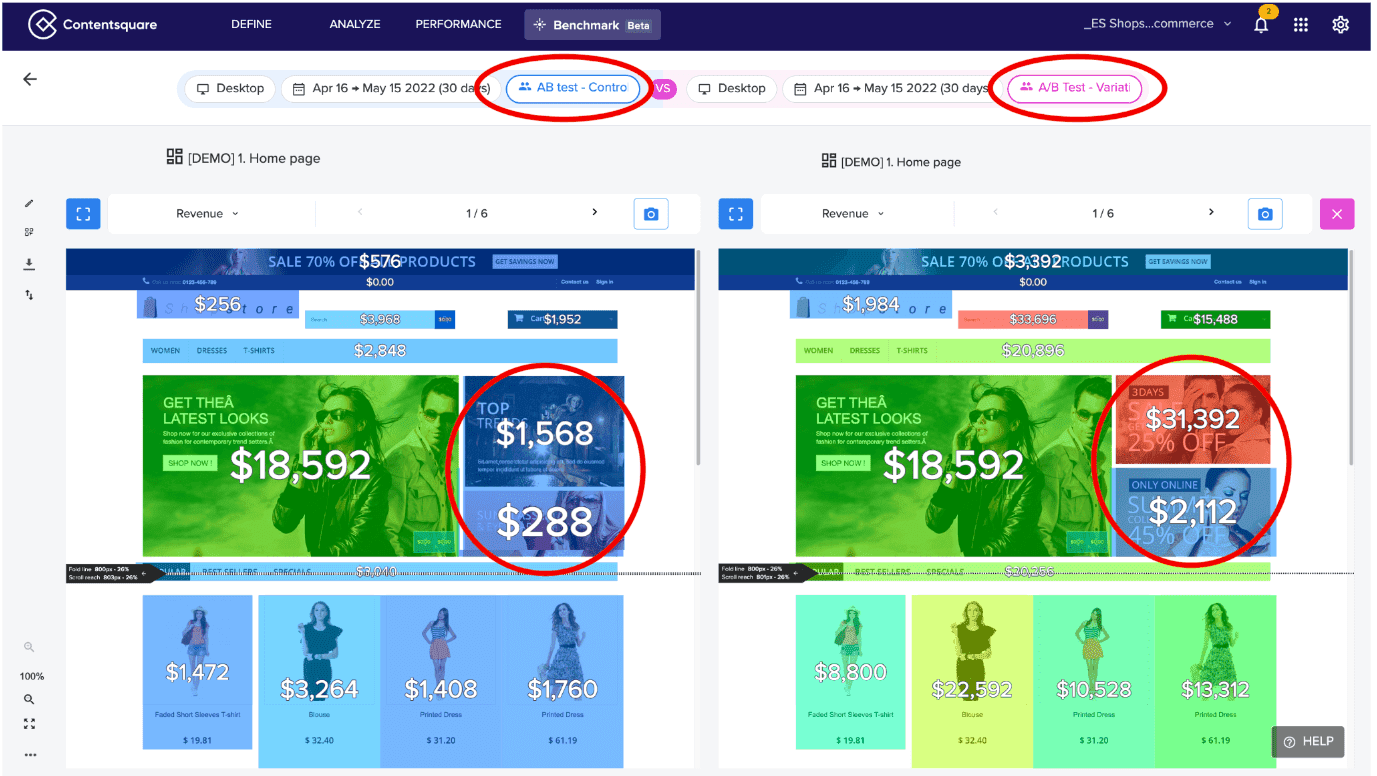
Visualize the outcome of A/B test variants with side-by-side Zone-Based Heatmaps in Contentsquare
The result is a faster path to Marketing ROI, a win win.
There are plenty of use cases where Contentsquare provides advantages and additional tools above and beyond Adobe Analytics. Here are some examples, based on the table of use cases that we saw earlier.
Both Contentsquare Product Analytics and Adobe are market leaders for web, app, and product analytics capabilities. You can use either one to
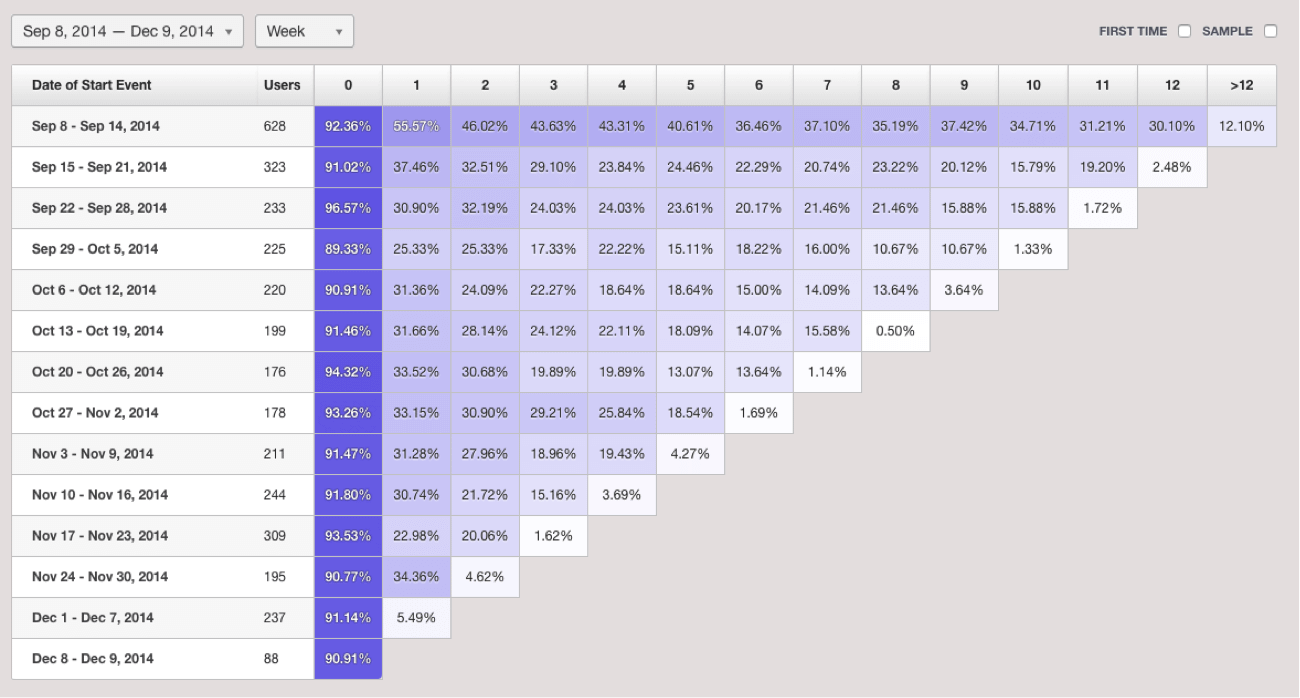
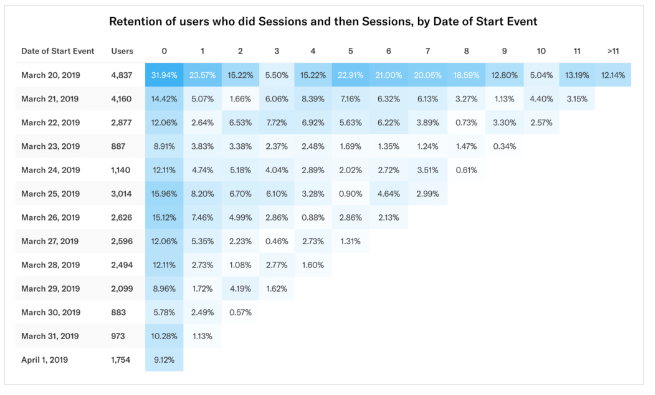
Cohort retention analysis in Adobe (top) vs. Contentsquare (bottom)
The biggest difference between Contentsquare Product Analytics and Adobe is the set-up, i.e. data capture. Contentsquare has refined its auto capture capabilities for websites and mobile apps with over 10 years of R&D investment. Today, it is the most widely used auto capture solution for web and app analytics in the industry. .
Contentsquare’s auto capture is market-proven to provide cost and time savings for gathering a more complete picture of in-page interactions so that teams can answer everyday questions at lower cost and effort:
This approach saves time, money, reduces technical debt, and ensures you always have the data you need to make informed decisions. And it works right out of the box.
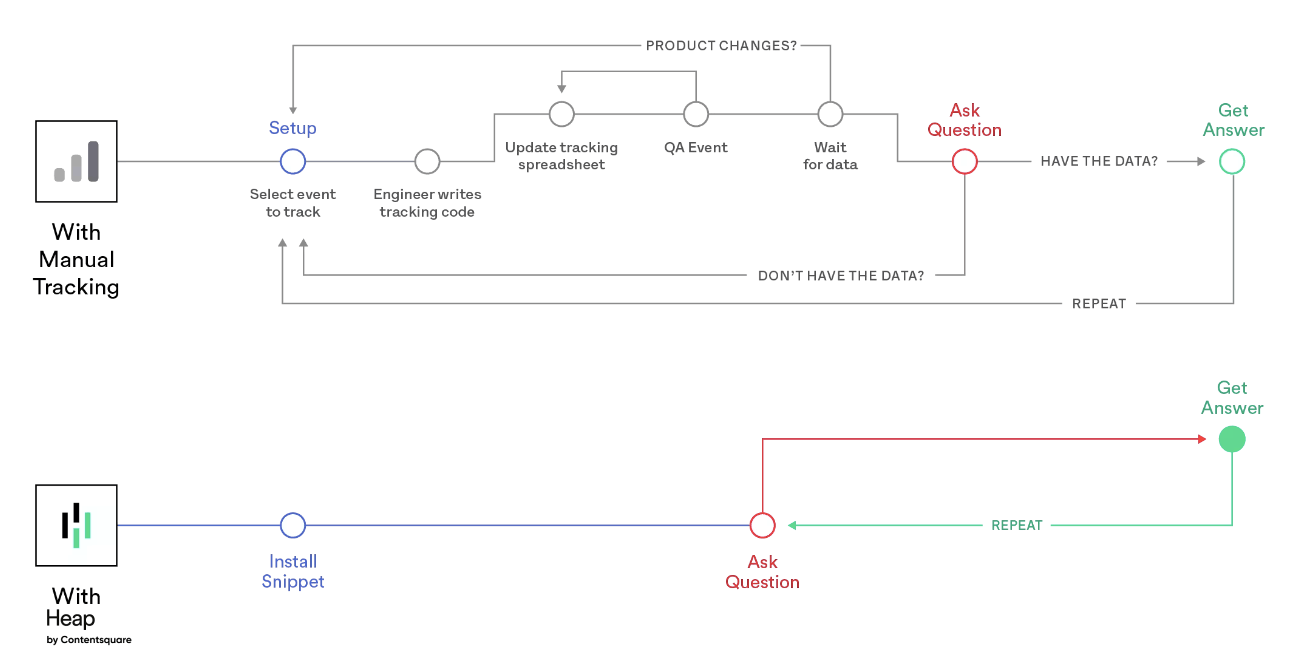
Manual tracking vs. autocapture
Customers have documented publicly how auto capture benefits them in terms of time and cost savings, compared to using web analytics products that require manual tagging. For example, be sure to read
Trading the Quill for the Press: The Case for Automated Tagging – By Seth Stuck, Published by Fox tech on Medium
Why does it matter?
Better answers to questions, delivered more quickly, means that Product teams can be more agile with prioritizing, triaging, and course correcting roadmap releases. This enables them to release more often, and put out better releases. That leads to more successful products that have a better chance at creating successful, loyal users and reaching their Northstar KPI targets.
The teams tasked with creating engaging and attractive brand experiences need a way to measure whether their content strategies are working. That requires attributing conversions and revenue back to the content elements that influence users along the way. That helps them strike the right balance between creating content rich experiences vs. shorter paths to conversion by deciding which content elements to keep vs. improve or reposition.
That’s why marketers and content teams add Contentsquare Experience Analytics in addition to Adobe Analytics, for Contentsquare’s unique set of immersive visual insights:
By combining visual analytics and traditional charts, Contentsquare gives you ways to understand why users abandon their journeys and what content A/B tests are most likely to improve results. That use case of informing the best A/B tests to run for increasing conversions is one of the biggest value-drivers for companies using Contentsquare Experience Analytics.
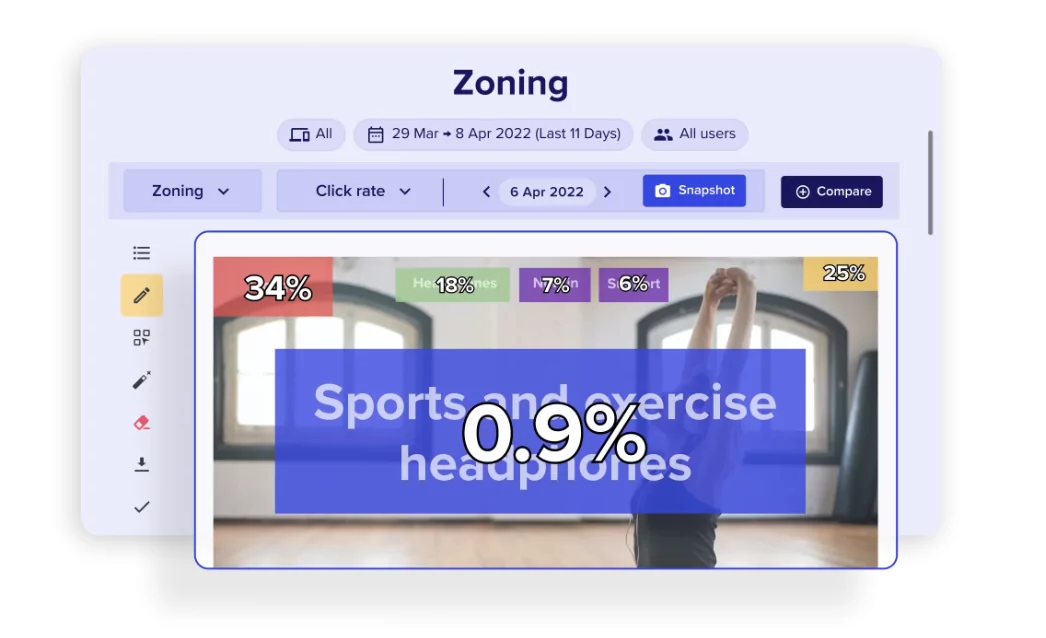
Screenshot of Contentsquare’s Zone-Based Heatmaps capability
No company can afford to lose customers and users because of frustrations on their sites and apps. That’s where session replay and digital experience monitoring (DEM) help for understanding customer challenges and prioritizing what to fix based on business impact.
Using Contentsquare you can

Example of session replay with error capture and impact quantification in Contentsquare
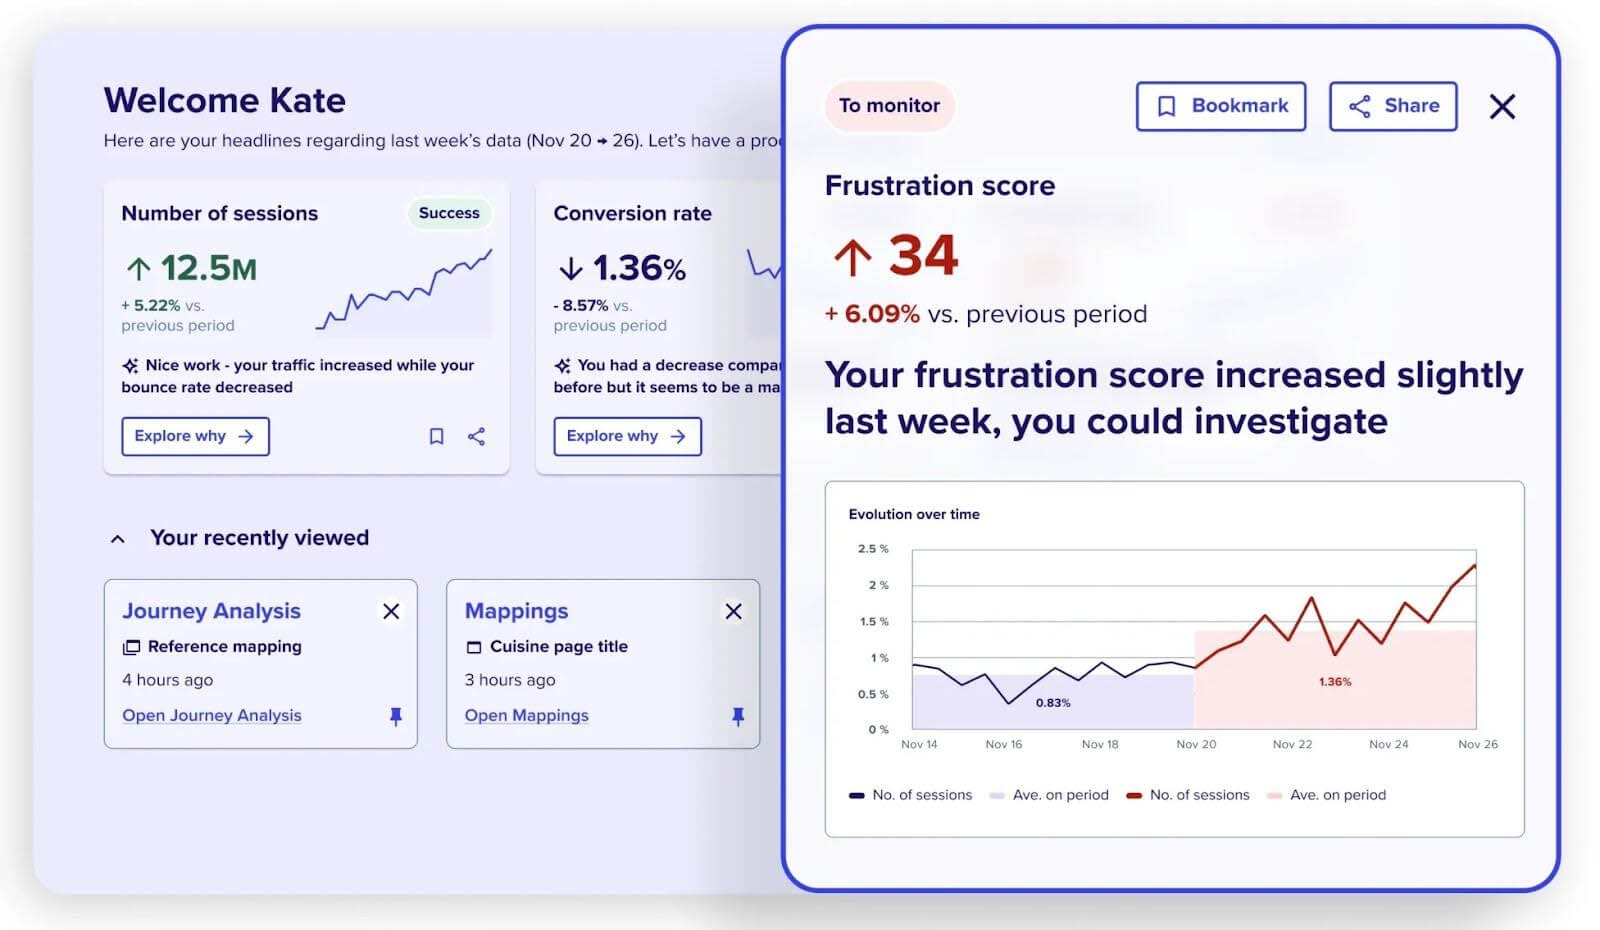
Save time focusing in high-impact optimizations with Contentsquare’s AI-powered insights such as Frustration Score
Error tracking in Contentsquare
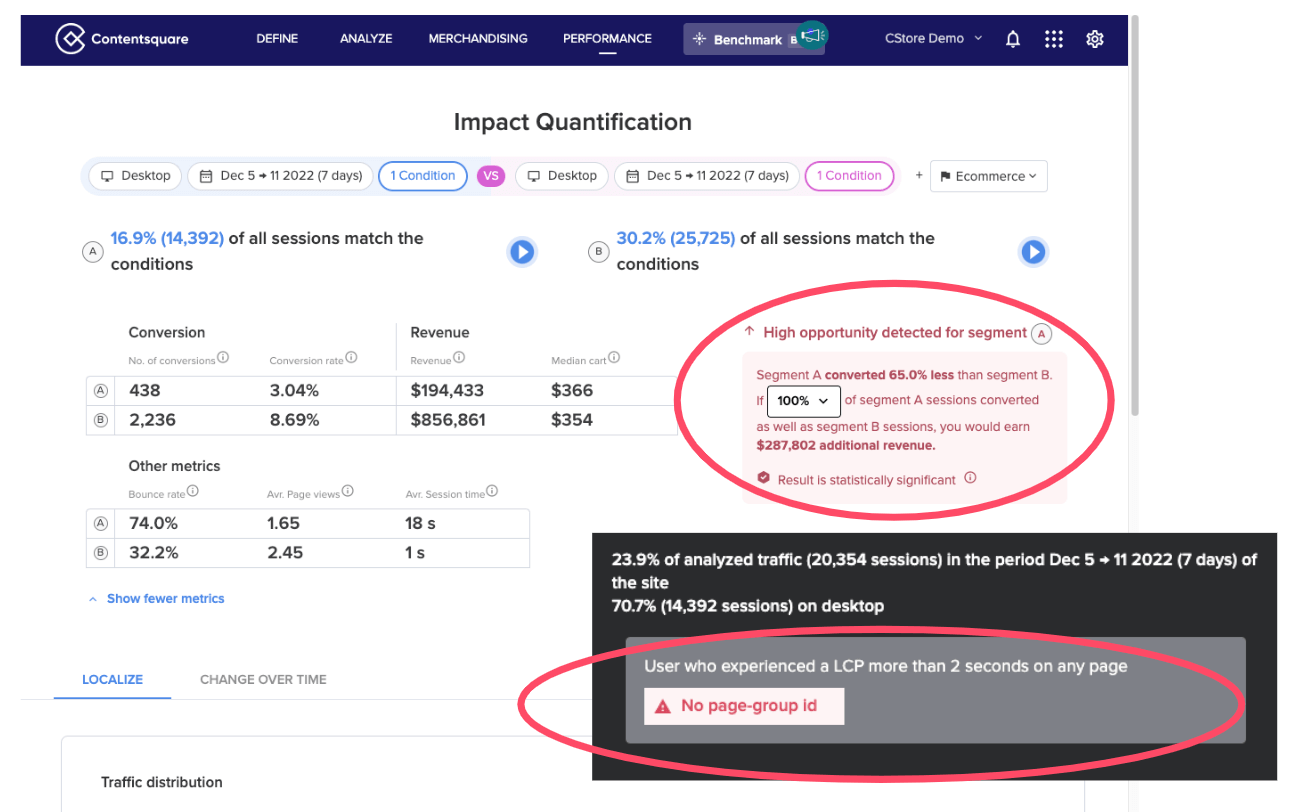
Perhaps the two most popular capabilities in Contentsquare for technical teams tasked with ensuring friction-free experiences are text search and 1-click impact quantification.
Errors are not the only reason why customers abandon journeys. Slow speeds alone suffice to get them frustrated. Adobe is often used in conjunction with Contentsquare for a comprehensive view of performance.
Example of quantifying the business impact of poor performance
Oftentimes, websites and apps work exactly as designed, but too many users are confused and frustrated anyways. Catching these issues requires data that goes beyond link click data captured by typical web and product analytics tools. For example, in Contentsquare you will also be able to visualize
The depth and breadth of the capabilities for Experience Monitoring in Contentsquare makes it easy to see why technical teams flock to the solution for ensuring smooth operations, no matter whether they may use it alongside Adobe Analytics or with Contentsquare Product Analytics.
Voice of Customer (VoC) feedback gives you direct access to what’s going on in the minds of your most important business asset—your customers.
VoC tools empower teams across the organization to make data-driven decisions:
All this leads to improved customer experiences and increased business growth.
Adobe doesn’t today provide a native VoC tool—you’ll need to integrate with other paid tools like Survicate or Sprig to collect feedback responses and connect them to your quantitative data.
With Contentsquare, you have the option to integrate or use built-in VoC tools, including
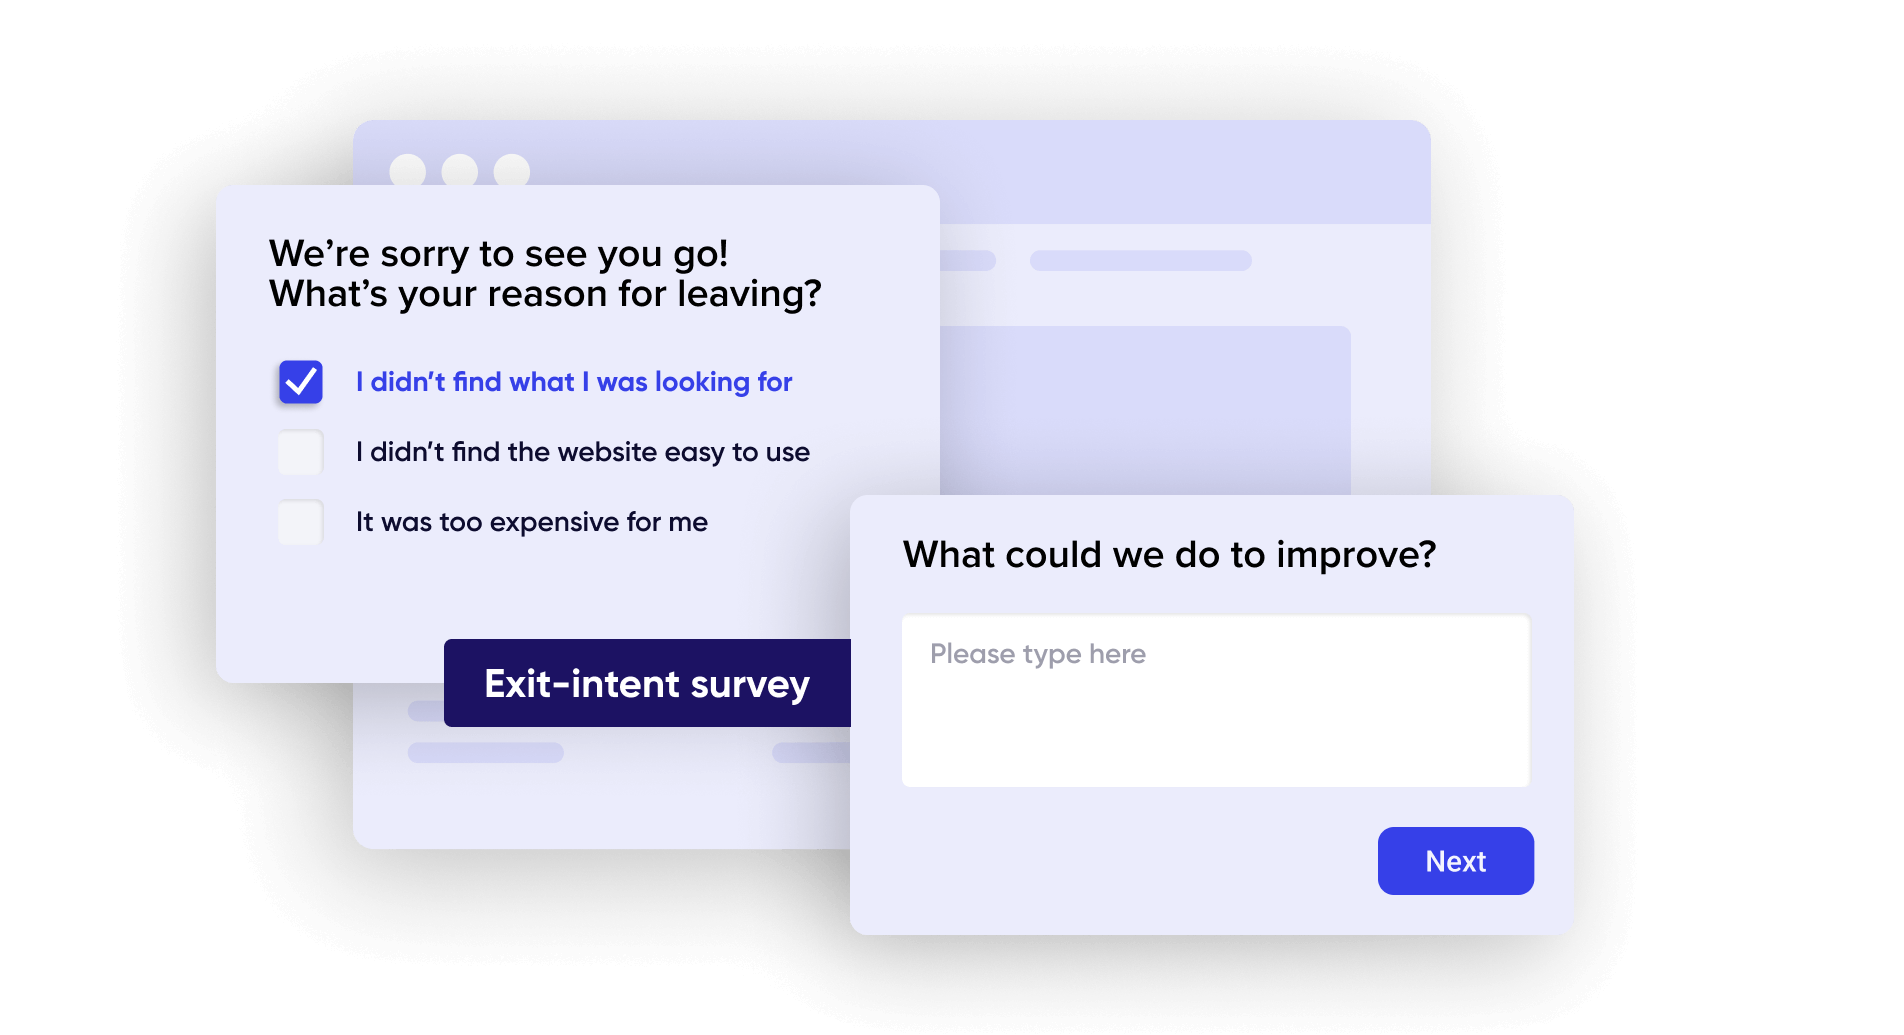
Contentsquare gives you more ways to collect and analyze VoC feedback, powered by Hotjar
What’s your primary reason for using a platform like Contentsquare, Adobe or alternatives?
If it’s creating executive level dashboards for pageviews and journeys at a high level, you can achieve your goals with either platform. But Contentsquare Product Analytics has proven itself over 10 years to be providing huge cost and time savings thanks to its autocapture architecture. Over a thousand companies use it to answer everyday questions that are just too hard and too costly to answer with traditional analytics that require manual tagging.
If it’s whole-business growth, Contentsquare is the only all-in-one platform that combines product and comprehensive experience analytics, monitoring, and Voice of Customer capabilities to tackle growth from all angles. These are indispensable, whether they are used as a companion to Adobe or with Contentsquare Product Analytics
The only way to really know which solution best aligns with your team’s needs is to experience it for yourself—take the 6-minute Contentsquare product tour and see how Contentsquare can outperform Adobe for your team.
Take a product tour
Get to grips with Contentsquare fundamentals with this 6 minute product tour.
Adobe Analytics, part of Adobe Experience Cloud, is a web analytics tool that helps businesses track user interactions and optimize digital experiences. Founded when Adobe acquired Omniture in 2009, it offers real-time insights and detailed customer segmentation. While powerful, it can be complex to implement and may require specialized expertise to fully utilize.
Contentsquare is the leading all-in-one experience intelligence platform founded in Paris in 2012 by Jonathan Cherki. The company has raised over $1.4 billion in funding and acquired tools like Pricing Assistant and Clicktale (2019), Hotjar (2021), and Heap Analytics (2023). Today, Contentsquare has a team of 1,800+ across 16 global offices.
Some of the top Adobe Analytics competitors include
Net Promoter®, NPS®, NPS Prism®, and the NPS-related emoticons are registered trademarks of Bain & Company, Inc., NICE Systems, Inc., and Fred Reichheld. Net Promoter ScoreSM and Net Promoter SystemSM are service marks of Bain & Company, Inc., NICE Systems, Inc., and Fred Reichheld.