6 strategies to build more fruitful product teams with Happyfresh

- 1. Always sense check the data (garbage in, garbage out)
- 2. Use the MECE framework (mutually exclusive, collectively exhaustive)
- 3. Empathize with your users
- 4. Analytics can never tell you what’s missing
- 5. Discovery vs delivery
- 6. Balancing acquisition vs retention
- Remove the guesswork with Contentsquare
Drawing from his own experience, here are Alfonso’s top six pieces of advice to build a product team that’s primed for success…
1. Always sense check the data (garbage in, garbage out)
Fancy spreadsheets, complicated formulas, and sophisticated models—that’s what most product analysts rely on when it comes to looking at customer data. While this is essential, Alfonso believes it’s easy for product teams to get mesmerized by the technology and trust whatever the formula spits out. But it pays to make sure first.
Alfonso’s top tips? Always sense check the data by answering these questions:
- Can you reach the same result in a different way?
- Does the number make sense in the context you’re looking at?
2. Use the MECE framework (mutually exclusive, collectively exhaustive)
Let’s say you’re an online beauty retailer. You’re doing analysis and decide to split your data by females who are above 20 years old and those who are both female and male. With this split, you’ll end up with an overlap in your data where users will be represented twice (in both groups).
That’s where the MECE framework comes in handy, helping you ensure you’re splitting your data into groups that are mutually exclusive and collectively exhaustive.
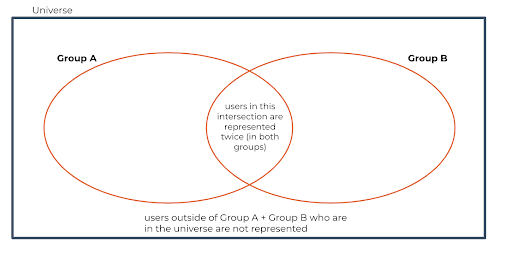
The MECE way is to divide your entire universe into different groups—these don’t have to be the same size, it’s all going to depend on what you’re looking at. Here’s an example of how you could split up your users:
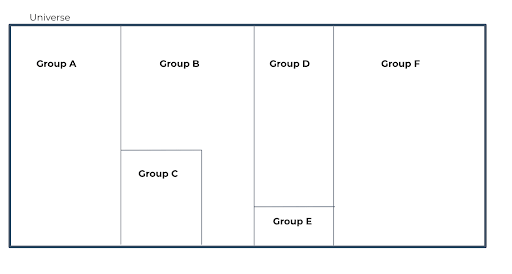
In the example above for a beauty brand, groups A-E could be females segregated by different (non-overlapping) criteria, and then group F might be males (as they are less likely to be in your target audience). You can then start to see which groups show higher conversion rates, which ones have higher basket size, then optimize accordingly.
But remember, a data point by itself is of little use. You always want to compare: either to the past, or to other cohorts, or from different variants (in A/B testing).
For example, if you noticed Group B converting at X%, it would be hard to extract value from this information. But if you also had the conversion of all other groups, now you have a comparison and you can try to understand why one group converts better than another.
3. Empathize with your users
Grab your popcorn, and take a seat at the UX Cinema. At Happyfresh, Alfonso and his team run “UX Cinema” sessions: watching replays of how customers are using a certain product and their feedback. The idea here is to gather not just the user research team, but other teams in the organization as well to remove any barriers and expose as many people as possible to the customer experience.
Alfonso says, “By watching the videos, you tend to feel personally invested to fix a customer friction point. It’s important to feel the pain of the customers.” So if you aren’t running your own UX Cinema sessions already, consider adding them to your 2022 strategy!
4. Analytics can never tell you what’s missing
When UX designers design products, they usually have a journey in mind which they want their users to follow. However, in reality, users tend to follow the journey that suits them best—known as a cowpath.

For example, Alfonso likes to use Whatsapp to jot down his personal notes, but it’s not possible to pin a personal chat window with yourself in the desktop app. The only way he could do this was to first create a group with a friend and then kick that person out, resulting in his own “cowpath”. It’s highly unlikely that an analyst at Whatsapp would be able to pick up on this behavior by looking at the data alone.
That’s why data and user research need to work hand-in-hand. If you’re only looking at user research, you might end up listening to a vocal minority, but if you rely only on data alone, you would miss out on the reasons why certain behavior manifests itself.
Happyfresh example: Every quarter, the research and data team jointly produce a voice of customer (VOC) deck where the research team analyses the sentiment of all tickets while the data team adds all sorts of data-driven trend analysis.
5. Discovery vs delivery
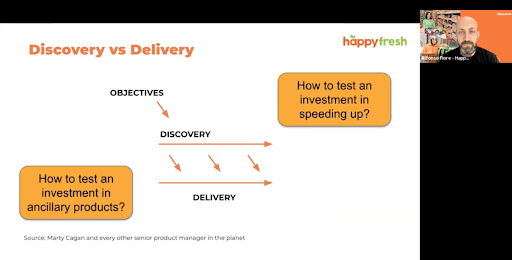
One of the most common mistakes product teams make is throwing themselves into delivery without discovery. It’s important for teams to invest in learning how to de-risk the delivery phase of product development. Alfonso shares two of his learnings:
Testing an investment in ancillary products
While building a minimum viable product (MVP) with the least amount of features might seem like the best way to test and learn, sometimes going back to basics is all it takes to measure interest.
Tip: build a CTA for your new feature, and link to some sort of fancy 404 page. Be honest with your customers, apologize and maybe offer them a small voucher. The goal is to learn and de-risk your idea as fast as possible (this suggestion only applies to B2C companies).
Testing an investment in speeding up a part of your conversion funnel.
Speed is everything when it comes to online conversions, but it can take months to significantly improve the speed of a page.
Tip: Try flipping it around. It only takes a day to slow things down, what happens to your conversion funnel? It should have a negative impact which should help provide a business case for the investment necessary.
6. Balancing acquisition vs retention
Getting buy-in from management teams is always a tough problem, but according to Alfonso, data should be your friend:
- Acquisition: Take a look at your customer lifetime value (CLV), if it’s higher than your customer acquisition cost (CAC), then you still have room to invest more in acquisition.
- Retention: Do a cohort analysis to check retention after 6 and 12 months. Use online trends to benchmark yourself with similar companies to help arm your decisions.
If you’d like to hear more on these strategies, you can check out the full talk from Alfonso here.
Remove the guesswork with Contentsquare
With every tap, click, scroll, and hover, your customers share how they feel about your digital experience. Contentsquare’s experience analytics platform captures and analyzes every digital interaction on your website or app to tell you what content is working and what’s falling flat. We’ll give you real-time access to all the customer behavior data you need to build better digital experiences and keep your customers happy.
Book a demo with us today.


