
Building a product that gives customers exactly what they need takes more than just relying on gut feeling and guesswork. The teams that do it best understand their users, empathize with them, and use data-driven insights to build—and optimize—their products.
That’s where product analytics (PA) tools come in, helping you analyze how people interact with your product so you can capture, understand, and act on valuable user behavior data.
Below, we’ve curated our list of the top product analytics tools every product team needs to know about. Keep reading to see which ones made the cut and why, so you can build your ultimate product analytics tech stack and create more customer-centric product experiences at every stage of the user journey.
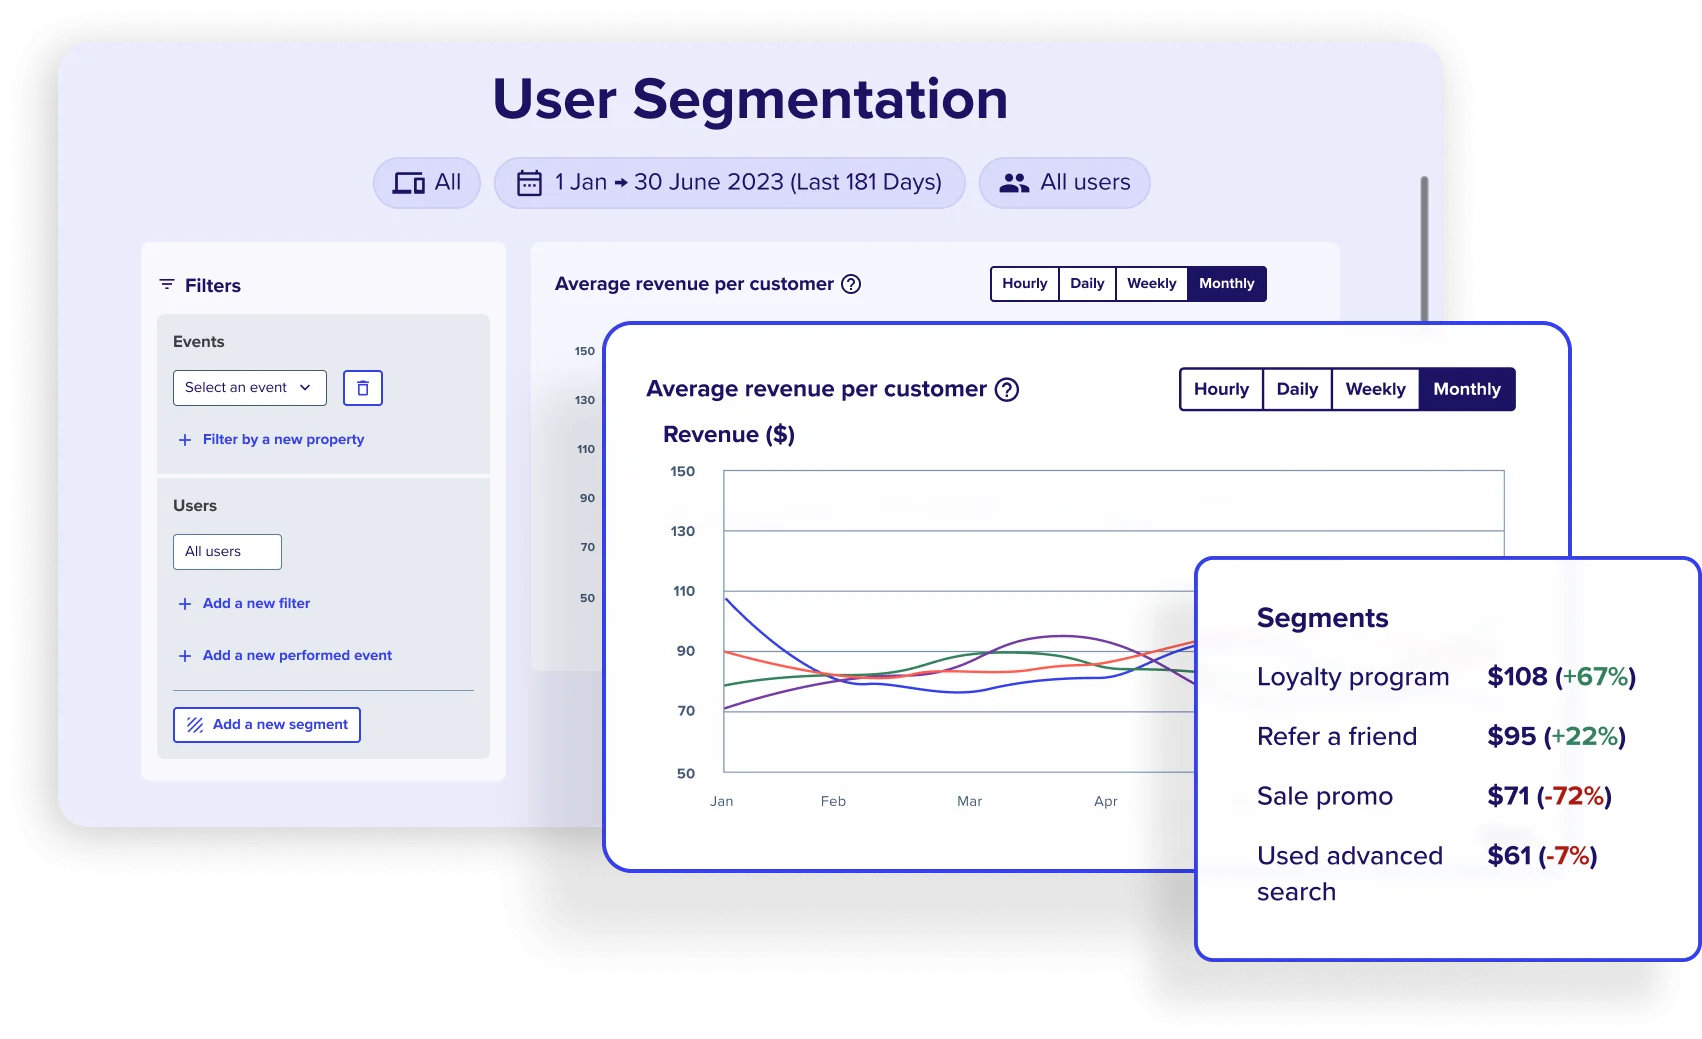
Use Contentsquare to understand how different users behave
Create meaningful customer segments to get fast, relevant insights about your most important users with Contentsquare.
These seven product analytics software, tools, platforms, and solutions offer a full spectrum of features to improve your product and integrate seamlessly with other tools in your tech stack to provide more comprehensive, powerful data.
Choose the ones that will help your product team get the insights they need—and build products your customers love.
1. Contentsquare
Contentsquare is an all-in-one experience intelligence platform that provides detailed insights into user behavior and engagement.
Contentsquare’s product analytics helps you understand multi-session user journeys across your product, websites, apps, and other branded experiences
Key tools and features: user journey tracking, session replays, retention analysis, user segmentation, key metrics and KPIs, and zone-based heatmaps.
How it helps product teams: Contentsquare’s product analytics gives you a complete understanding of your customer journeys across websites, apps, channels, devices, and browsers, so you can make smarter decisions, optimize your product, and deliver a better experience for every single one of your users.
Contentsquare PA is made for teams focused on alignment—externally (across channels and segments) and internally (across teams). The platform automatically captures qualitative and quantitative data and streamlines multiple product analytics datasets into a single source of truth—less tool-toggling, more team alignment.
With Contentsquare (now powered by both Heap and Hotjar, part of the Contentsquare group,) you get a 360° view of users that lets you
- Combine insights from all online and offline channels so you can quickly identify and act on improvements that will have the biggest business impact
- Analyze cross-channel user segments to improve engagement and maximize customer lifetime value
- Understand how mobile and web factor into digital experiences and optimize multi-session or device journeys
- Measure CX impact across campaigns, web content, and device features to optimize your product for long-term growth
Contentsquare also uses advanced data science and AI to automatically uncover insights, highlight opportunities and areas of friction in your product, and make suggestions for improvements. This gives product teams clear, actionable insights on how to make better and faster improvements that increase retention, conversion, and customer delight.
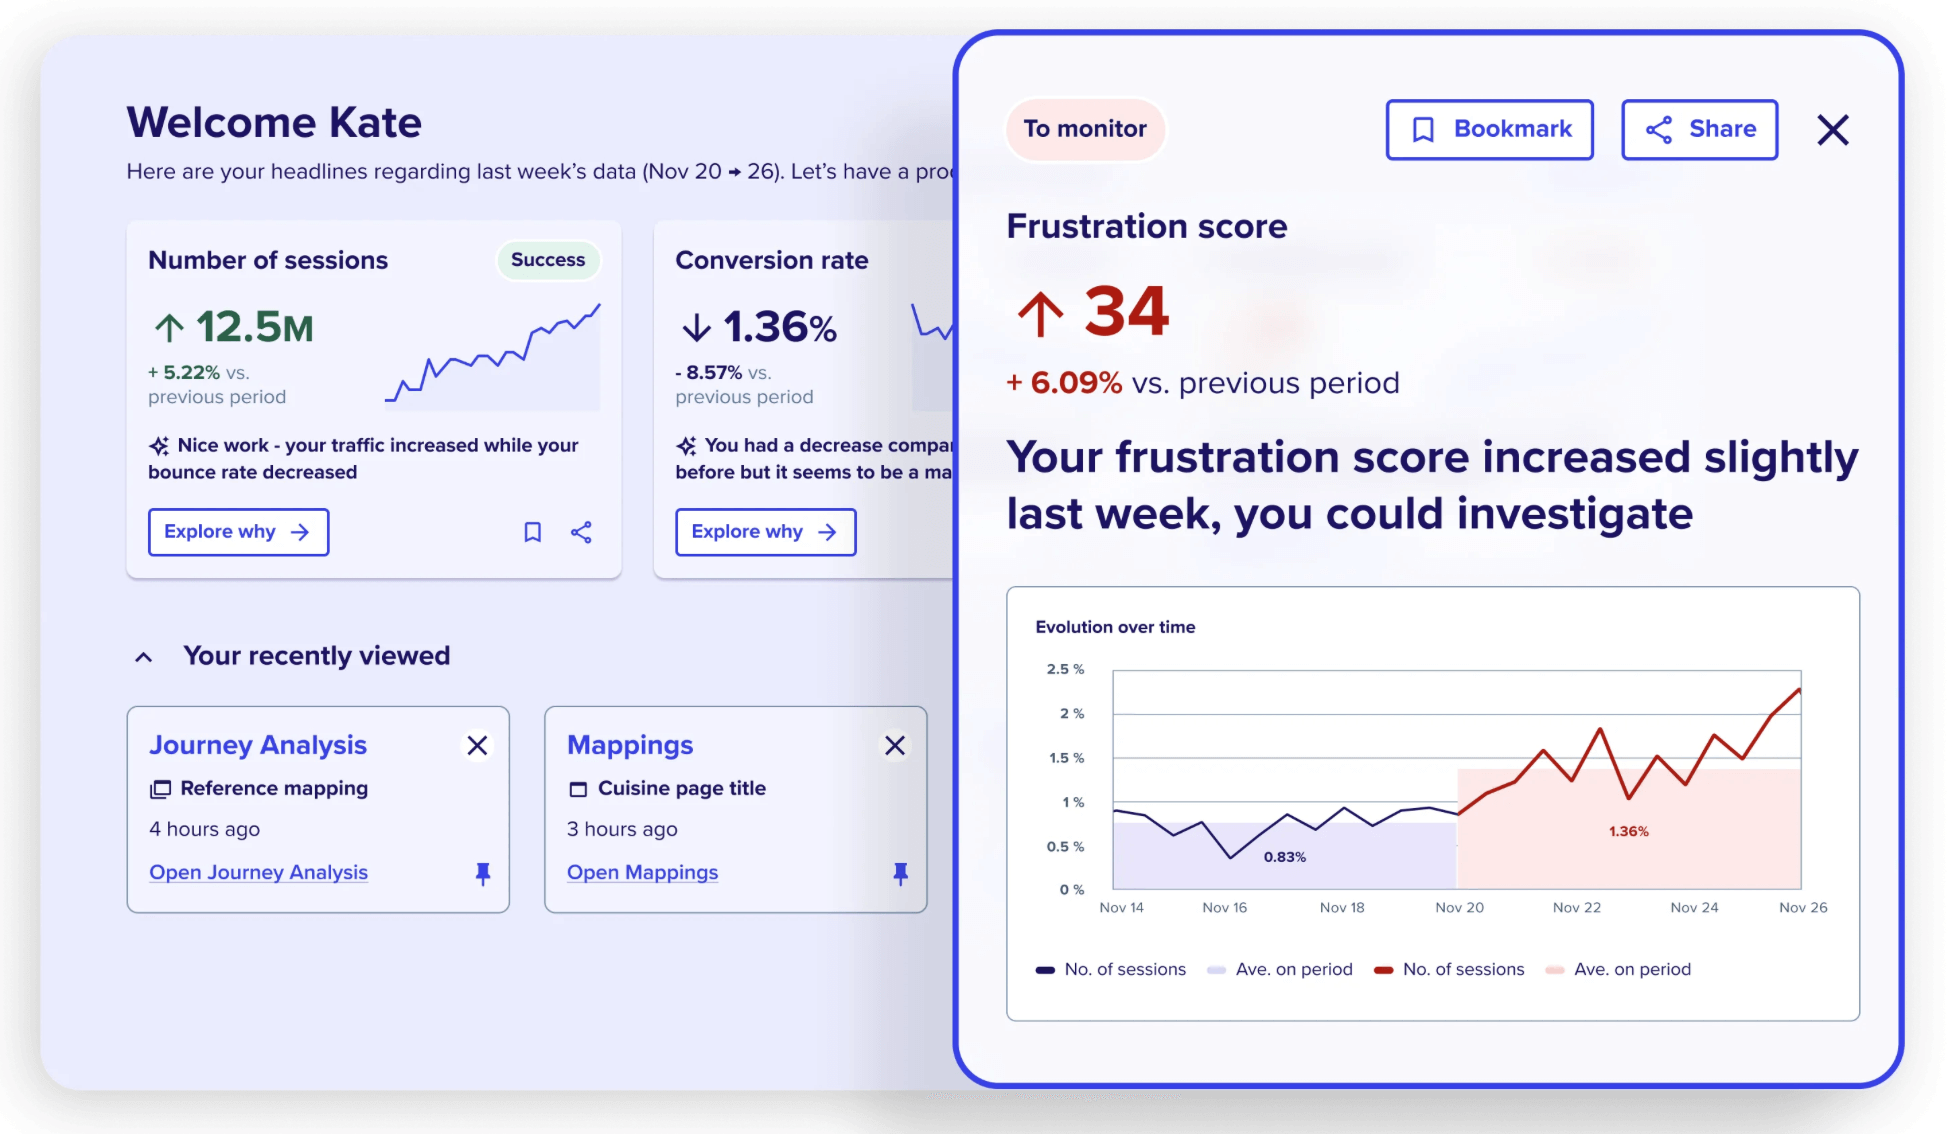
Contentsquare gives you specific suggestions so you know where to focus your product optimization efforts
2. Google Analytics
Google Analytics is a platform that collects data from your website and mobile applications to help you understand your customers across multiple touchpoints in their journey.
Key features: real-time data tracking, automation and machine learning, reporting, attribution, audience behavior analysis, and conversion tracking.
How it helps product teams: Google Analytics is a robust data platform that tracks, measures, and synthesizes crucial user data, such as
- Where users come from
- How long they spend on key pages
- Whether they convert
Google’s machine learning enhances your data with predictive insights so you can save time, while customizable reports make it easy to visualize and share data across your business.
GA4, the latest version of Google Analytics, also brings major changes: event-based models, more data streams (like from websites, Android, or iOS apps), new engagement metrics, more parameters across the board—including custom ones for cart, form, and content tracking—and ‘codeless tracking’ that doesn’t require engineers to set up. However, you still have to decide what events you want to track in advance.
| Pro tip: part of a well-oiled analytics tech stack is being able to switch between tools and platforms seamlessly, sharing intelligence for deeper insights and smarter execution. Switching from GA4 to Contentsquare and back means that you end up with a more complete, unbiased dataset, where your events are automatically set and tracked for you, giving you deeper insights. |
Contentsquare also comes with new and improved product analytics metrics and KPIs that provide better insights for your product team:
- Session duration and bounce rate over time: easily track how long users stay on your site and how often they leave without taking any action. This helps you see which campaigns are most effective in keeping users engaged.
- Shopify event enrichment: accurately measure conversion totals and values, even for server-side transactions. This allows you to identify which of your ecommerce website’s marketing channels and landing pages generate the most revenue.
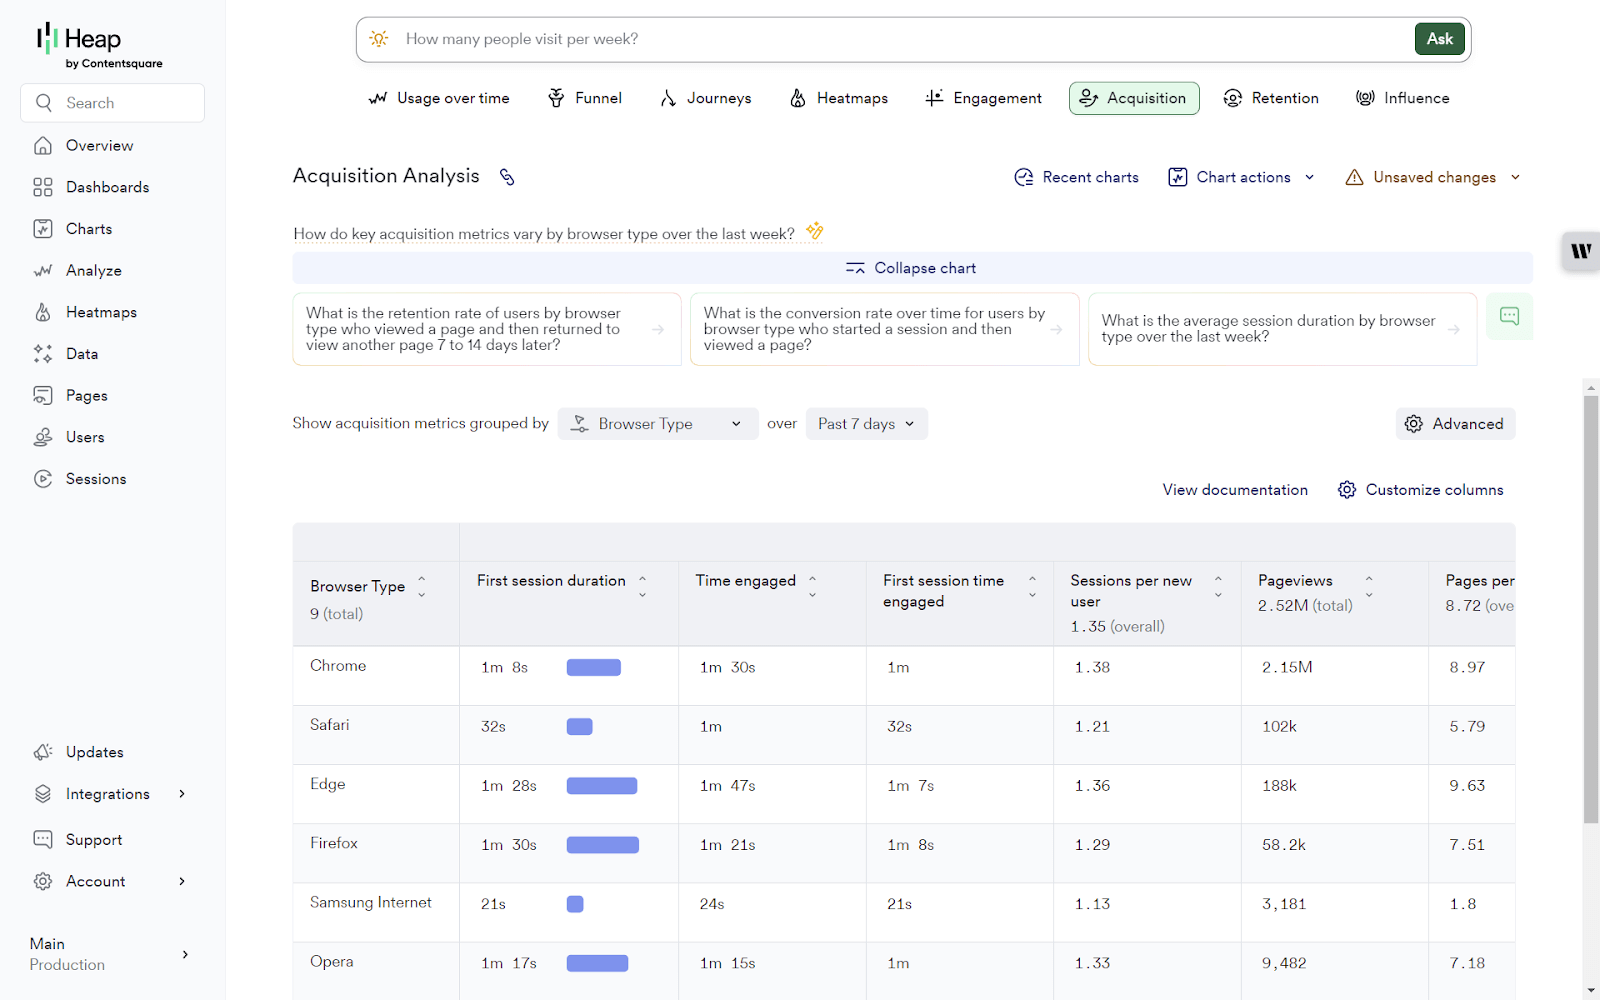
- Pages view: access ready-made reports covering page metrics like ‘time on page’ and ‘exit rate’. This helps you understand which content, such as collections and blogs, engages your users the most.
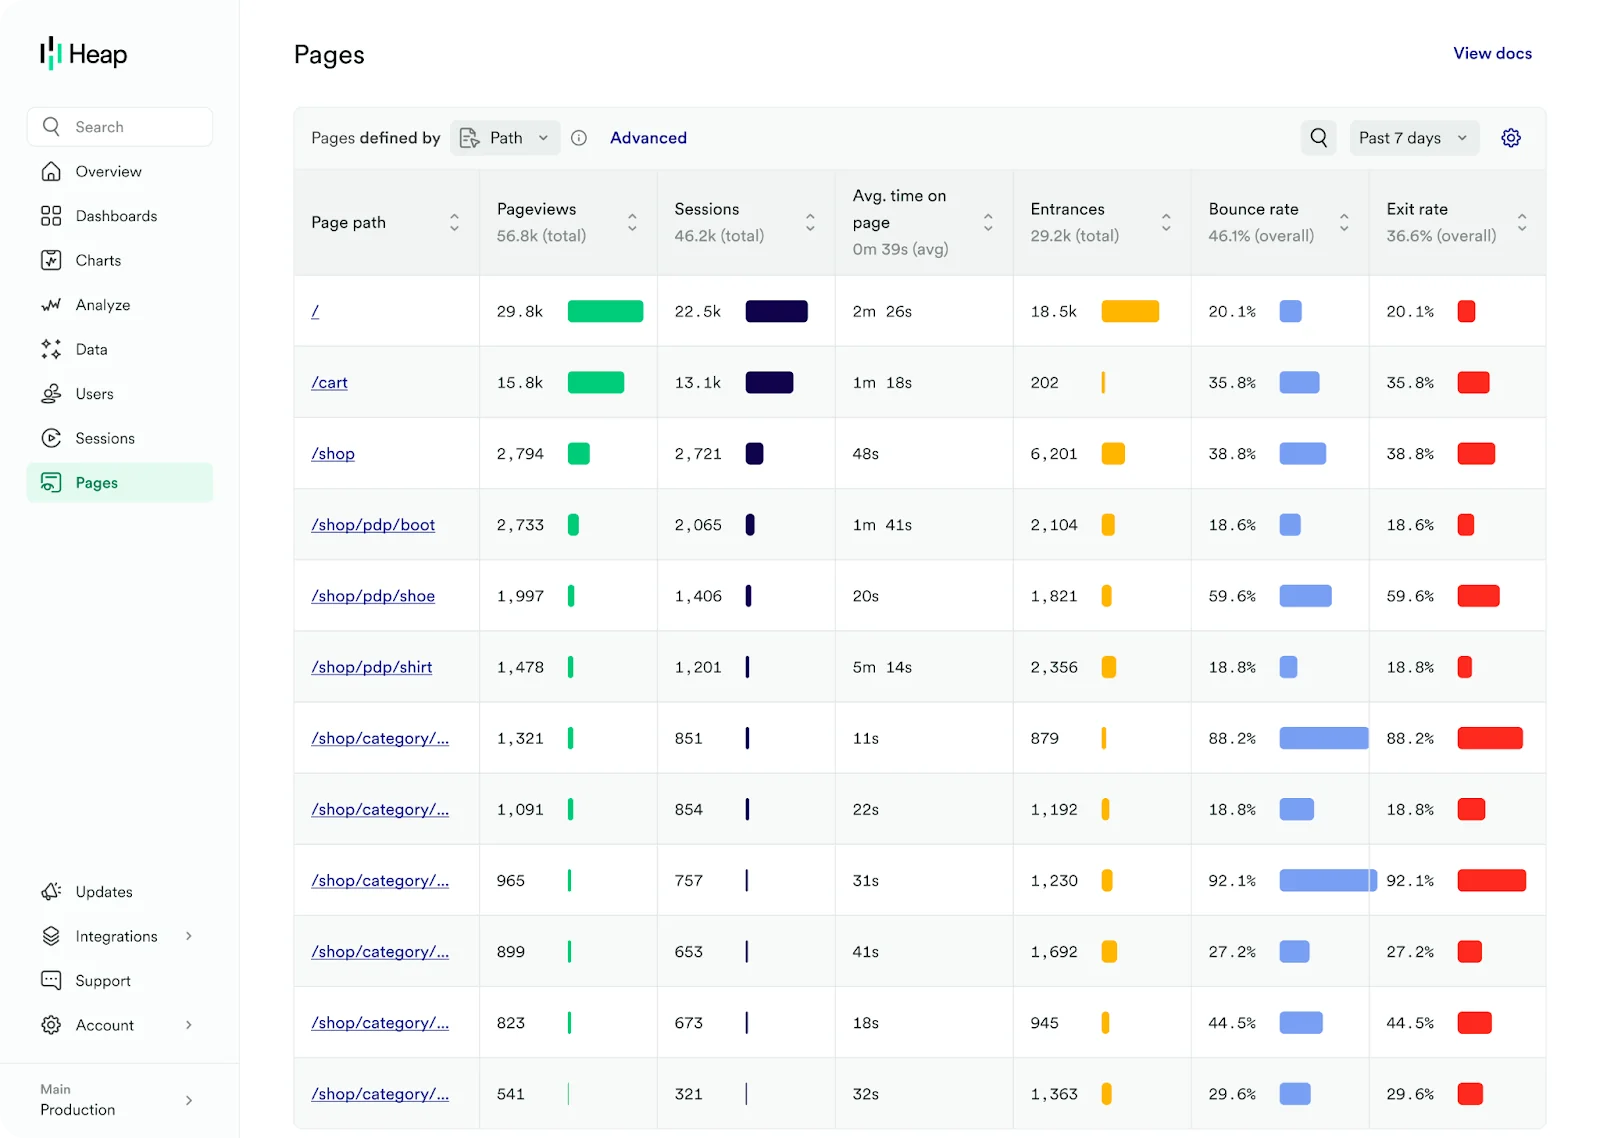
The Pages view feature is available in Contentsquare for all Heap (PA) customers
3. Mixpanel
Mixpanel is a product analytics tool that enables businesses to capture and analyze key user interaction data.
Key features: interactive reports, team boards and alerts, customer segmentation, group data analytics, and data management.
How it helps product teams: Mixpanel is an excellent self-serve tool for event tracking and conversion funnel analysis. In product analytics, events are specific user actions—anything from watching a video to signing up—that unveil larger trends in user engagement.
With Mixpanel’s funnel analysis features, product managers and marketing teams can track users’ progression and spot where they drop off.
Set up event tracking to see which actions are most common among different cohorts, and test different in-app messaging with users. These cohort analysis insights reveal behaviors linked to long-term customer retention, help you reduce churn, and encourage more users to take a desired action.
Mixpanel is especially good for teams that want to examine the results of large campaigns with many small events or micro-transactions. It provides granular data on user activity—as long as you’re willing to invest engineering resources to fully implement it.
4. Fullstory
Fullstory is a digital analytics platform that focuses on improving revenue and retention across all your digital channels.
Key tools: conversion funnel analysis, UI friction signals, user trends aggregation, and heatmaps.
How it helps product teams: Fullstory stands out with its ability to use machine learning to suggest changes you might make to the user experience. It’s a good option for product teams where the majority of customer activity takes place on mobile apps or online stores.
Upon installation, Fullstory captures user sessions, including mouse movements, clicks, scrolls, and keystrokes, across different devices and browsers. The platform enables teams to monitor user behavior, analyze customer journeys, identify opportunities for improvement, and fix issues that may be causing friction in the user experience.
Fullstory does a good job of noticing and tracking changes to your app, and is tailored to the non-technical user. However, its most obvious limitation lies in custom event tracking.
Although Fullstory brands itself as ‘tag-free’, product teams can’t track every event they might want to, since the app only integrates with Segment and Tealium events, so users often end up sticking to the built-in features. Similar roadblocks occur with identity tracking—while it’s possible to track unique user IDs in Fullstory, the process can be tedious.
5. Pendo
Pendo is a product experience platform that combines insights with action, helping teams understand how people use their product and triggering in-app messages based on these findings to drive adoption.
Key features: analytics, in-app guides and communication, feedback, roadmaps, and portfolio insights.
How it helps product teams: Pendo’s strength lies in delivering personalized onboarding and feature walkthroughs to optimize user experiences. This functionality enables teams to use their product analytics dashboard to send tailored, personalized communications that guide users to the most impactful use case features, improving product adoption.
Pendo autocaptures some event data, giving it an advantage over other tools, like Mixpanel. However, you still have to rely on manual tagging to capture many key interactions. This means that, if you want to really dig into customer data analysis and compare different groups of users, Pendo falls short.
For example, while you can view retention graphs and conversion funnels, you can’t segment those graphs by individual behaviors, which makes it difficult to see if drop-off at a certain point in the funnel correlates with other behavior, or to compare user groups and see which is more likely to stick around or drop off.
6. Optimizely
Optimizely is a digital experience platform (DXP) that lets you run advanced experiments through A/B testing.
Key features: A/B testing, segmentation, mobile optimization, conversion rate optimization, split testing, and personalization.
How it helps product teams: A/B testing helps teams optimize digital products—like ecommerce stores, content platforms, and SaaS applications—by running experiments and analyzing the results. Optimizely stands out with its powerful personalization features that allow you to deliver customized experiences to different segments of your audience based on behavioral data.
Optimizely also helps you break down your product analytics strategy by user segments and deliver personalized experiences that improve engagement, retention, usage and lifetime value.
You’ll still need insights into customer behavior to understand why they interact with your digital products the way they do, but with Optimizely’s detailed insights into different groups' actions, you can make more accurate and effective improvements.
| Pro tip: get more impactful results from testing digital experiences with the Optimizely + Contentsquare integration. |
The Optimizely-Contentsquare partnership gives you more hard numbers and context behind your A/B tests. By combining the platform's experimentation capabilities with Contentsquare’s holistic customer behavior metrics you can
- Use Contentsquare’s Customer Journey Analysis to understand how users move through your site and spot the best opportunities for A/B testing
- Build and track better and fewer experiments during peak times with Optimizely’s Multi-Arm Bandit (MAB) tests
- Use Contentsquare’s Session Replay to understand why users prefer one version over another, make better decisions, and deepen customer engagement
- Understand the impact on conversion with Contentsquare’s Impact Quantification and increase your revenue
Together, these tools provide key insights into your product’s usability, performance, and product engagement, making it easier for your team to understand what drives your customers’ behaviors.
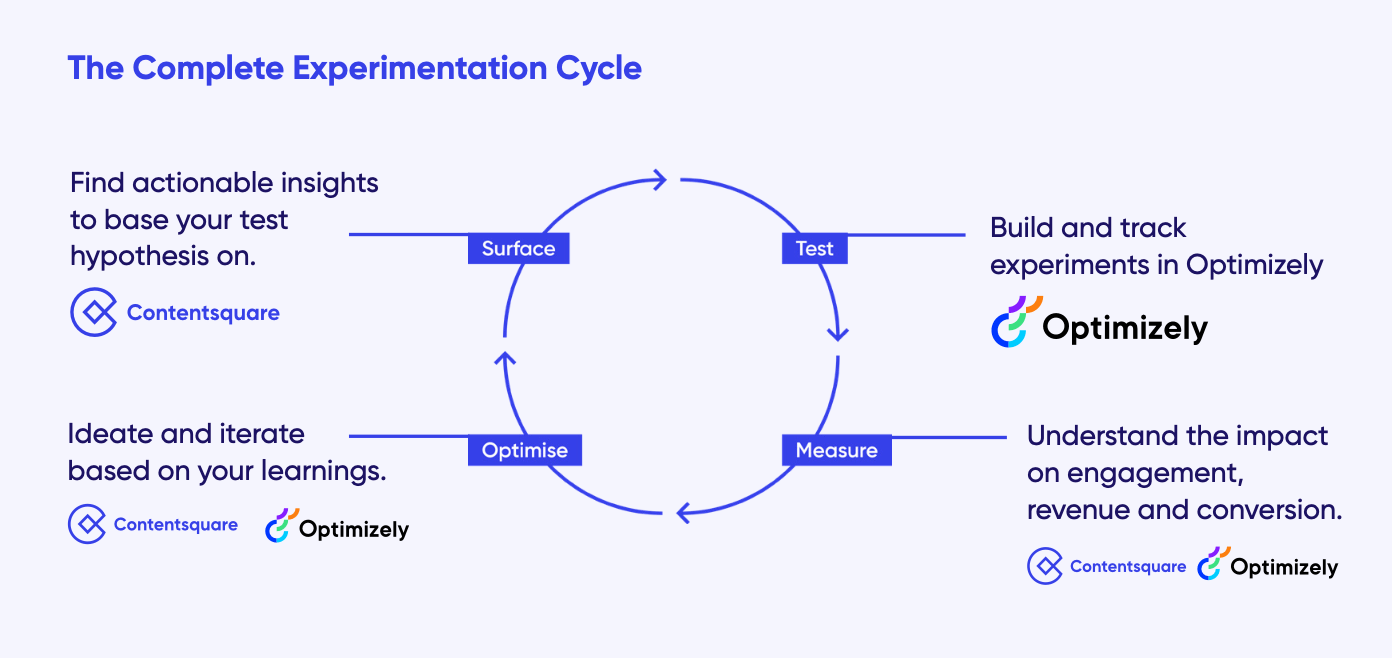
Contentsquare and Optimizely work hand-in-hand throughout the experimentation cycle to deliver the best possible customer experience
7. Amplitude
Amplitude is an event-based analytics tool that tracks and analyzes user behavior.
Key products: analytics, customer data platform, experimentation, and data management.
How it helps product teams: the Amplitude Analytics tool helps teams analyze product usage, personalize the user experience, and use data to inform development roadmaps. Amplitude Experiment, on the other hand, lets you use this data to plan, deliver, and analyze product experiments.
Combined, these tools enable product managers to dive deep into user data, create cohorts, and perform advanced analysis to uncover trends and patterns.
Because Amplitude requires manual tagging, it also involves significant administrative and engineering resources to collect the product data you need. Keep this in mind when you’re planning a new release or update on your product.
How to choose the right product analytics tool for your team
A great product that meets users’ needs doesn’t just appear out of thin air. But with a strong product analytics tool in your tech stack helping you capture, analyze, act on, and share valuable insights, you’ll make more strategic product decisions, improve your product performance, and boost retention.
To choose the right PA tool for you and your team:
- Take into account key points like features, pricing, ease of use, and how it integrates with other tools in your tech stack
- Consider your goals and which product analytics features will help you do it. For example, if you want to understand why users aren’t fully engaging with a new feature, you could use session replays to see it through their eyes and pinpoint any issues.
- Look for an intuitive product analytics tool that’s easy to install, maintain, and use, so your product team can self-serve and move quickly. The goal is to empower your team to focus on what matters—building the best products—not wrestling with their analytics platform.
- Finally, remember that qualitative and quantitative data both have a role to play in a great digital experience. Product analytics identify the what, when, and who to focus on for digital excellence. By combining PA insights with digital experience analytics, digital experience monitoring, and voice-of-the-customer tools, you get an all-in-one solution that puts users at the center of optimizations, equipping your entire team to create better products and experiences.
Get a demo
Request a personalized demo with a digital experience expert!
FAQs about product analytics tools
What is a product analytics tool?
Product analytics tools are software and applications that examine user behavior over time within your product. They capture, analyze, and visualize crucial information about how users interact with your product across sessions and devices, which you can then use to optimize performance, diagnose problems, and correlate user activity with long-term value.
What can I expect from a PA tool?
Using a product analytics tool provides valuable insights into user behavior, feature usage, and product performance. This data helps product teams make data-driven decisions, enhance product development, optimize marketing strategies, and, ultimately, improve customer satisfaction and revenue.
How does a product analytics tool work?
The best product analytics tools give your team the insights they need to improve your product, drawing on a range of features like
- Cohort analysis that helps you understand how certain customer groups react to your product, so you can determine how and when to reach them to cultivate the greatest rates of retention
- Behavioral segmentation that lets you sort users according to the actions they take, so you can see who your best customers are and learn what they like to do
- Integrations that allow you to enrich your dataset to answer more complex questions by connecting your PA tool and insights to external sources (like CRM, email marketing, testing, accounting, and payment systems) and running analysis on their information
When should a company invest in a PA tool?
Product analytics tools make sense anytime you wish to improve user experience and build a product people like. Or better yet, love!
Here’s how they help you optimize and evolve at every stage.
If you're a small company:
- Discover your product-market fit
- Conduct user and market tests
- Develop your MVP into an optimal offering
If you're a mid-market company:
- Develop your data value chain
- Increase your retention and conversion rates
- Lower your customer churn
If you're an enterprise company:
- Perfect your data storytelling
- Ensure that you continue to evolve with the market
- Stay ahead of your competition (who also uses product analytics)