Resources
Filter Resources
Clients by Industry
Reports
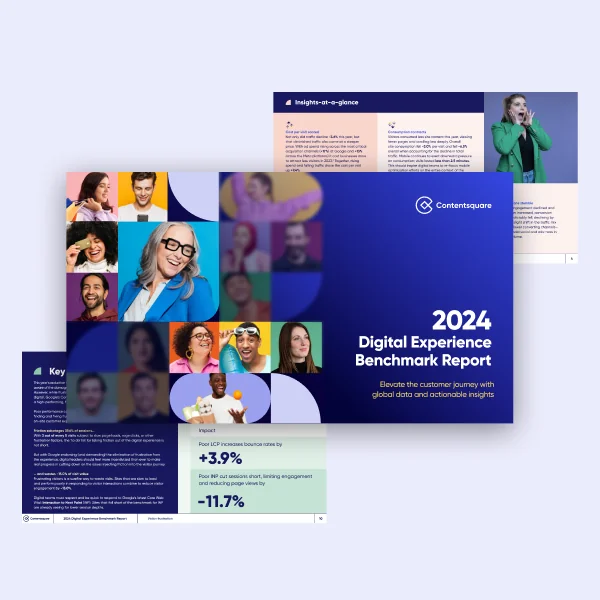
2024 Digital Experience Benchmarks
Uncover trends for crucial digital KPIs and learn how to maximize the value of each visit with actionable insights and best practices designed to elevate the entire customer journey.
Reports
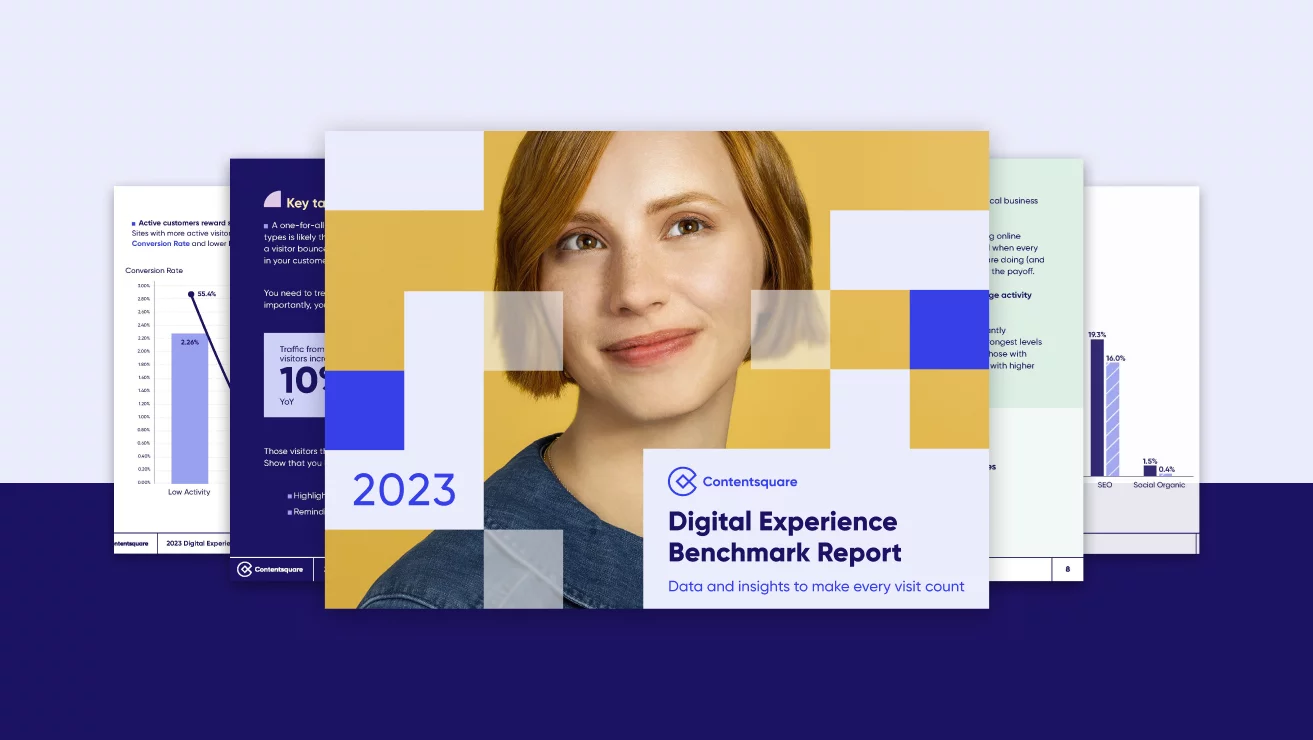
2023 Digital Experience Benchmark
Measure what matters most to your users and optimize customer satisfaction to drive growth.

Reports
2023 B2B Digital Experience Benchmark
The 2023 B2B Digital Experience Benchmark explores the user experience on B2B sites from end-to-end, helping you pin-point opportunities to improve your buyer’s journey, delight more customers and see real growth.

Reports
2023 Travel & Hospitality Digital Experience Benchmark
The 2023 Travel & Hospitality Digital Experience Benchmark explores the user experience on travel and hospitality sites from end-to-end, helping you pin-point opportunities to improve your customer journey, delight more customers and see real growth.

Reports
2023 FinServ Digital Experience Benchmark
The 2023 Financial Services Digital Experience Benchmark explores the entire customer experience to help you pin-point opportunities to improve your journeys, delight more customers and see real growth.
Reports
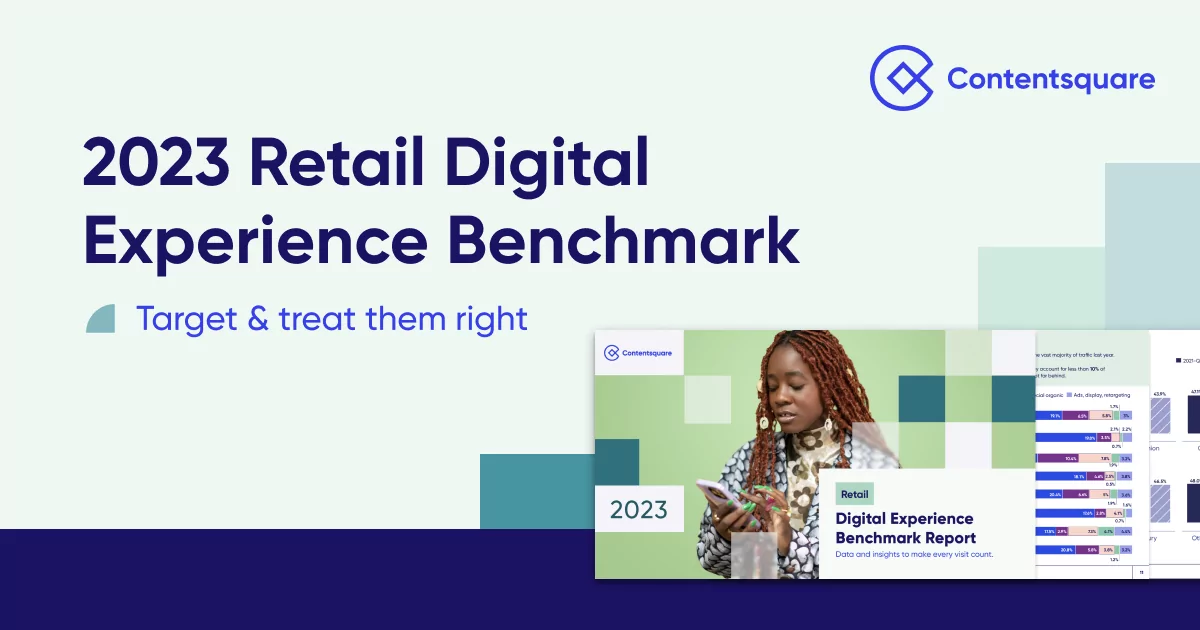
2023 Retail Digital Experience Benchmark
The 2023 Retail Digital Experience Benchmark explores the entire customer experience to help you pin-point opportunities to improve your journeys, delight more customers and see real growth.

Reports
3 strategies for driving more conversion through eCommerce experiences
With economic conditions making growth an uphill struggle, it’s never been more important for eCommerce businesses to drive conversions. But it’s also never been more challenging.
Reports
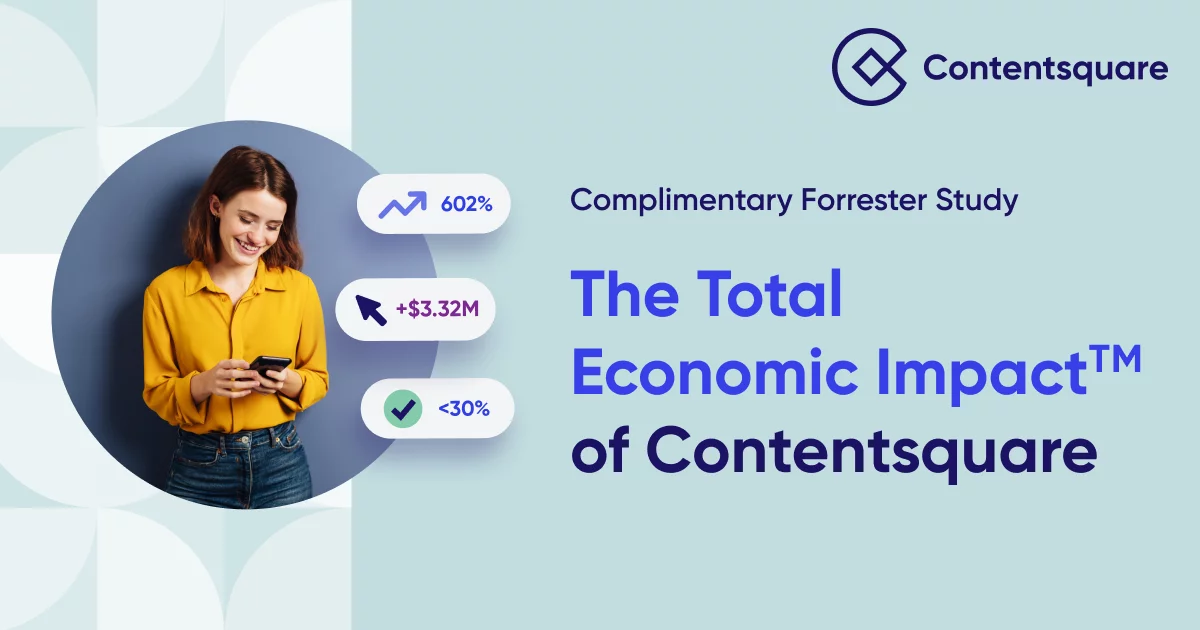
Forrester’s Total Economic Impact™ Study
Forrester finds 602% ROI with Contentsquare in new Total Economic Impact™ study.