![[Visual] Woman on laptop and tablet from above](http://images.ctfassets.net/gwbpo1m641r7/4mksg6vIOAFHEGsPB7eAZN/4e9862dc2438c13ccdf490785cd1c264/customer-experience-insights-man-computer-digital-1.jpg?w=1200&q=85&fit=scale&fm=avif)
Peak seasons are a golden opportunity to get your hands on first-party data like never before. During these high-traffic periods, you can collect invaluable insights about how your customers think, feel, and interact with your site as hundreds—or maybe even thousands—flock to it.
If you're unsure where to begin, don’t sweat it—an experience intelligence platform like Contentsquare can make all the difference. This article gives you clear steps to take to process the wealth of data waiting in the midst of high-traffic times.
Key insights
Holiday traffic is a goldmine for optimization. The data you collect during peak season reveals exactly where users got stuck, what drove conversions, and what needs fixing before the next rush.
Heatmaps, session replays, and surveys work together. Combining click behavior, real browsing sessions, and direct feedback gives you a complete picture of how holiday shoppers experienced your site.
Post-holiday analysis isn't just about fixing bugs. It's about benchmarking key metrics like conversion rate, average order value (AOV), and cart abandonment rate so you can set measurable goals for next season.
Sharing insights across teams drives action. When product, design, and leadership teams see real user behavior, they're more motivated to prioritize the improvements that matter most.
What you can use holiday UX data for
The holiday period doesn't just bring extra sales—it also gives you more website data and user insights than any other time of year. Analyzing this data with your team reveals what worked well, what needs improving, and where to focus your efforts to keep conversions growing year-round.
Whether you're preparing for the next peak season or optimizing your everyday experience, post-holiday traffic analysis helps you:
Measure if your holiday readiness optimizations worked as intended and report on your successes
See where users got stuck and fix bugs or obstacles before they get in the way of more sales
Compare holiday behavior to other periods to understand how holiday shoppers behave differently
Share insights with your team and stakeholders so everyone can understand the impact of their work on real users and customers, and get clear evidence of what to build or improve next
Benchmark and improve key metrics like sales conversion rate, AOV, checkout rate, cart abandonment rate, and CSAT (customer satisfaction score) before the next holiday season
How to use Contentsquare to analyze holiday traffic and optimize for the next busy period
Assuming you've had Contentsquare up and running while traffic was peaking, the next phase is following the steps below to analyze your site's performance and optimize conversions before the next busy period.
If you want to make sure you're fully prepared before your next traffic spike, check out our guide on what to do before the traffic spike hits.
Analyze heatmaps on popular pages to see what was clicked or ignored
Heatmaps show you where users click on any website page, giving you a visual snapshot of what's attracting attention and what's being ignored.
If you're using Contentsquare, our Heatmaps capability will have collected heatmap data everywhere the tracking code is installed—so it doesn't matter if you forgot to set up specific heatmaps before the holidays.
![[Visual] Contentsquare-vs-Segment-vs-Mixpanel-mobile-app-heatmaps](http://images.ctfassets.net/gwbpo1m641r7/7DZJpXMXPncvR7qxESRJfk/46fcaa8e132091c191d2ab8fb862e014/Contentsquare-vs-Segment-vs-Mixpanel-mobile-app-heatmaps.png?w=1280&q=85&fit=scale&fm=avif)
Contentsquare's Heatmaps in action
Follow these 8 steps to get value from heatmap data collected during the high-traffic season
Start with your highest-traffic pages—homepage, category landing pages, and checkout flow—where heatmaps reveal the most impactful insights.
Filter your heatmap by date (a single big day like Cyber Monday or your entire busy period) to see where holiday shoppers clicked, tapped, and scrolled during your chosen timeframe.
Compare your holiday heatmap against a pre- or post-holiday period of the same length to visualize how seasonality affects user behavior. Do holiday shoppers click different calls to action (CTAs)? Are they more interested in certain information (like returns or shipping)? Use any differences you find to promote and reposition relevant content next season.
View a click map to see which elements got the most clicks during the busy period. Were these your main CTAs? Were users bouncing by clicking other links?
Look for dead clicks (non-clickable elements that get clicked a lot). Are users getting confused or not finding what they need?
Check a scroll map to see the average scroll depth. Are users missing important content below the average fold?
Export heatmaps as a PNG file or take a snapshot to share relevant elements with your team and ensure you're showcasing your most impactful findings to the right people in your company.
Compare mobile and desktop heatmaps. Are there differences in click behavior and scroll depth? Are mobile users missing important CTAs? You may need to design different interfaces for mobile and desktop to ensure good UX across devices.
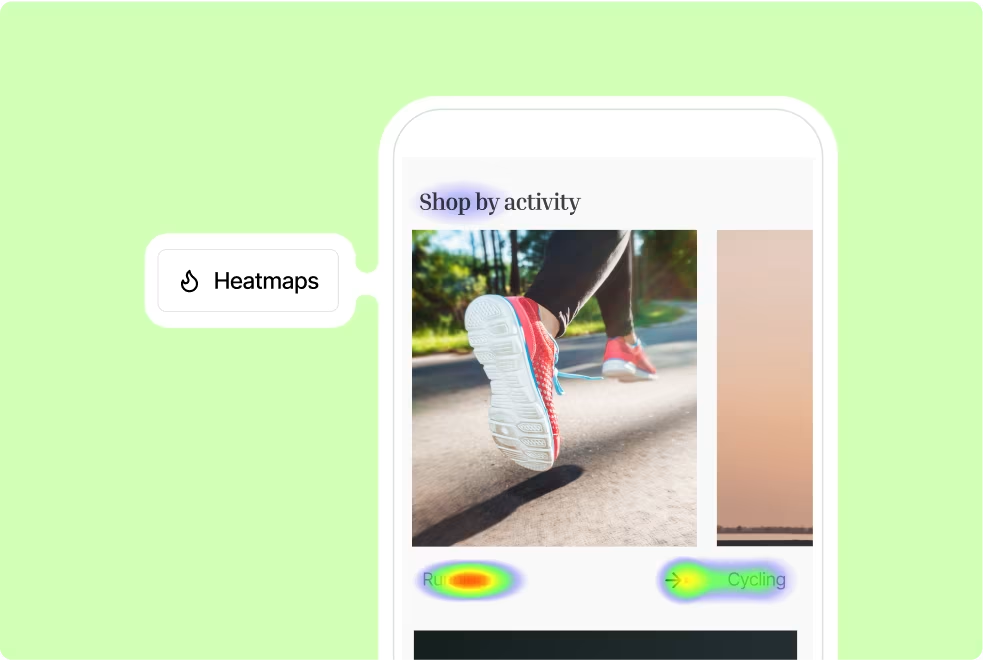
Check mobile heatmaps of your website then optimize your UX and UI design accordingly.
Filter, clip, and share the most revealing replays with your team
Session recordings recreate real user browsing activity across your entire website—letting you watch exactly how individual users navigated during the holiday rush. If you added Contentsquare's tag to your site and enabled session capture, our Session Replay capability will have automatically tracked sessions across holiday users' full journeys (the maximum number of daily sessions recorded depends on your plan).
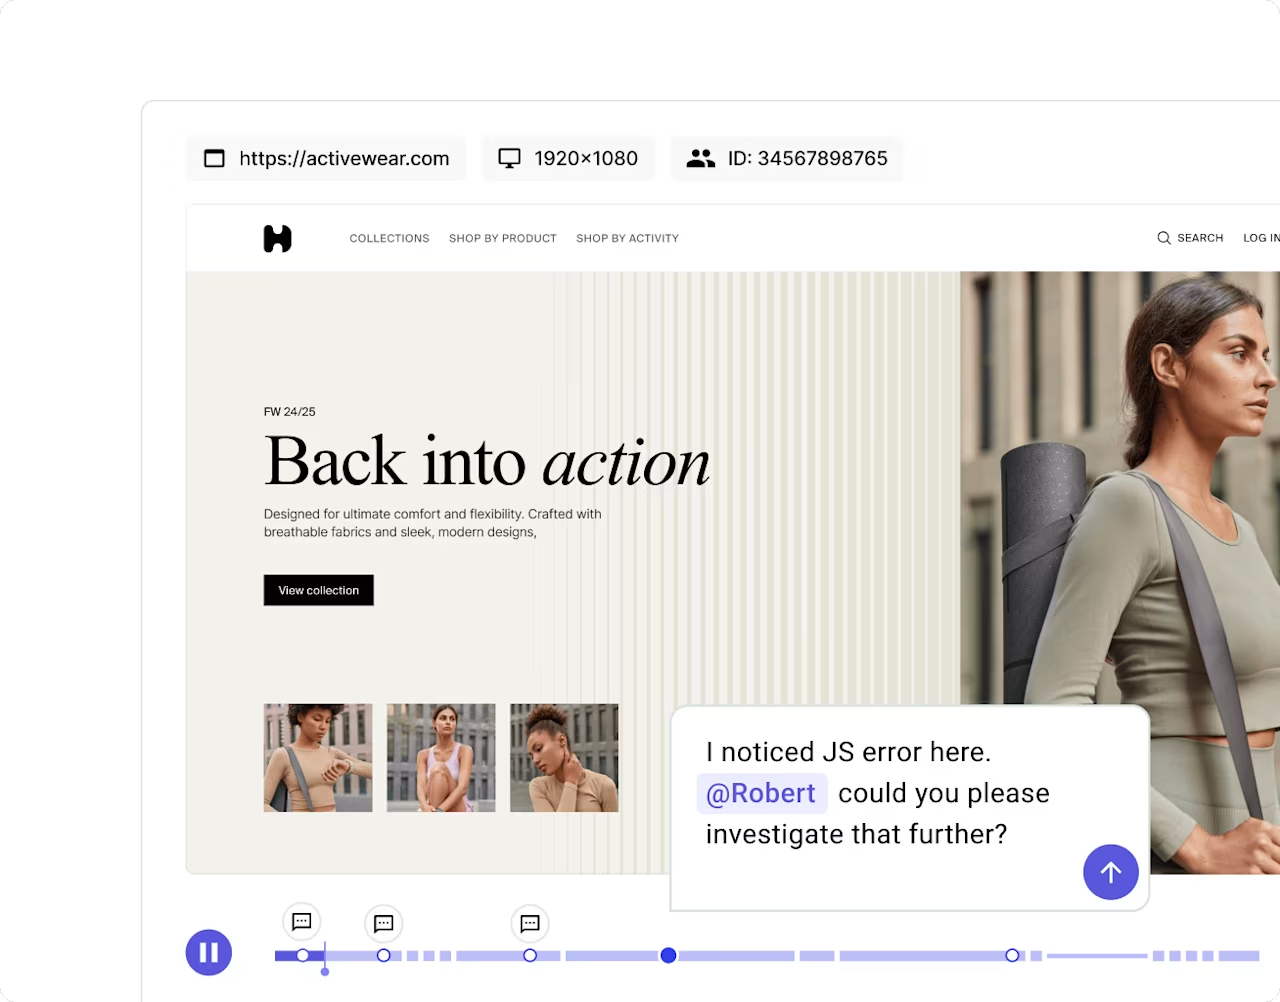
Watch how users navigate your site with Contentsquare's Session Replay capability.
8 ways to efficiently analyze your holiday replays and use the insights to optimize your site
Filter your session replays by date to view sessions captured during the high-traffic period.
You'll (hopefully!) have too many holiday replays to watch them all, so use filters to cut straight to the impactful stuff. Add an 'Exit page' filter with your 'Shopping Cart' or 'Checkout' URLs to find sessions where people left just before purchasing, and look for what might have led to the bounce. Save your favorite filters as segments to apply them quickly next time.
Check your dashboard in Contentsquare for the frustration score widget—a metric that flags sessions where users encountered repeated friction signals like rage clicks, erratic scrolling, or repeated form errors. You'll see how frustration trended over the busy period. Watch replays with the highest frustration scores to investigate what happened.
Filter by 'Referring page' to compare browsing behavior from different sources (for example, organic search vs. paid ad campaign) and look for patterns. Did users coming from ads result in more or fewer rage clicks and bounces? This helps you improve marketing budget allocation and messaging next season.
Quickly see key insights and highlights without watching the full replay by clicking the 'Summarize' button. Contentsquare's AI-powered session summaries—driven by Sense—give you a plain-language overview of each session and flag potential issues your users faced during their journey, so you can review far more sessions in the same amount of time.
If you've run surveys or collected feedback during the busy period, watch replays of users who left feedback by viewing your survey results and clicking the play icon where available. This gives you context for each replay, so you can make stronger conclusions about what the user was experiencing and any changes you need to make as a result. Start with replays of users who left 'dislike' or negative comments to understand why they weren't satisfied.
When you find a replay clip you want to action, cross-analyze it in Heatmaps for additional insights.
Organize a watch party and invite your team to watch selected replays together (in the meeting room or via video call). Bring people from different departments together. Your product managers and developers will appreciate seeing how real people interact with the functionality they build, your design team might get inspired to tweak page layouts and element hierarchy, and your leadership team will be motivated to give you the resources you need to make improvements.
Analyze feedback from your holiday customers
If you set up a survey or had a Contentsquare feedback widget running on your site during the traffic peak, you'll now have plenty of user feedback to sort through. You'll get just as much (if not more) from the negative feedback as the positive, so brace yourself for some home(page) truths before you dive in.
3 efficient ways to collect, quantify, and action feedback from your holiday shoppers
1. Analyze the results of your CSAT survey or post-purchase survey to measure how satisfied customers were with their experience. The Likert scale responses will become a benchmark metric for you to improve by the next busy season, plus responses to the open-ended follow-up question will tell you what led to high or low levels of satisfaction.
2. Analyze the results of your exit-intent survey to understand what caused users to leave without making a purchase. You might assume that holiday shoppers leave because they were just browsing or looking for deals, but there are often fixable UX issues that stop people from completing the checkout process.
![[Visual] Exit-intent survey - Help us improve website experience](http://images.ctfassets.net/gwbpo1m641r7/xYQkQJeSQsBO4fZZ7rtlj/4a1cd1b989b57206a5ae490f944a4a72/Exit-intent_survey.webp?w=1280&q=85&fit=scale&fm=avif)
Launch an exit-intent survey with Contentsquare in seconds.
3. Use Contentsquare's AI, Sense, to see a summary of the overall sentiment of the feedback you collected. Sense automatically tags each response as positive, neutral, or negative—and generates findings and recommendations so you don't have to read every single response manually. Filter by negative responses, look for peaks, and click through to see session replays from users who left negative feedback. You'll see the context behind their comments.
![[Visual] Contentsquare Sense flags shifts in survey sentiment](http://images.ctfassets.net/gwbpo1m641r7/5FqQ3pm2r35AlbJtWUXJQG/a3beb06ef2d3b2358aeacc6fff518a4c/Contentsquare_Sense_flags_shifts_in_survey_sentiment.png?w=512&q=85&fit=scale&fm=avif)
Sense helps you analyze your survey results and uncover the emotions behind the responses
The holidays are over, but your UX improvements aren't
Analyzing holiday user behavior data helps you fix bugs and optimize for conversions in the short term, but for long-term growth, you need to make reviewing and actioning these insights a regular part of your workflow.
The more user behavior data you collect over a longer period, the better positioned you'll be to spot patterns, fix issues, and ideate new design optimizations. And you don't have to stop at individual page analysis—Contentsquare's Journey Analysis capability lets you visualize how users progress through your site page by page, so you can identify the paths that lead to conversion and the ones that lead to drop-off.
![[Visual] Journey-Analysis](http://images.ctfassets.net/gwbpo1m641r7/70w5rqRhDCFOeQ9aGD9Dn9/9d2145a00dec1f8934f009b5d22b16f0/Journey-Analysis.png?w=1280&q=85&fit=scale&fm=avif)
Contentsquare's Journey Analysis uses a sunburst visualization to show user journeys through your site or app.
As Marta Sitkowska, Global Ecommerce Merchandising Manager at Salomon, puts it: "Contentsquare makes it possible to open up data to all teams, including those who are not necessarily familiar with data."
One holiday period may just be over, but there'll always be another one, and it's never too late (or early) to start optimizing your website to improve the metrics that matter to your business. For a complete overview of how to prepare, check out the peak season guide.
FAQs on post-holiday analysis
Post-holiday traffic analysis is the process of reviewing website data collected during peak shopping periods like Black Friday, Cyber Monday, or the December holidays to understand how users interacted with your site. It involves examining metrics like conversion rate, bounce rate, and user behavior patterns to identify what worked and what needs improvement.

![[visual] Whether you're starting an ecommerce business or want to increase your online sales, this comprehensive ecommerce guide will set you up for success.](http://images.ctfassets.net/gwbpo1m641r7/2oBR41ta2zGySqne7QEG0t/9e2a6804af71c5da0fe8f51e71f36e93/ecommerce.jpg?w=624&q=85&fit=scale&fm=avif)
![[visual] Learn how to decrease your shopping cart abandonment rates and build brand loyalty by improving UX.](http://images.ctfassets.net/gwbpo1m641r7/7Clw4uSP7rOPTuq7y2MpD5/9973da73d3334baa541fc137d061a724/AdobeStock_545782493.jpg?w=624&q=85&fit=scale&fm=avif)