![[Visual] People at computers stock](http://images.ctfassets.net/gwbpo1m641r7/27z27uENh1pcSw4D1VlXDf/250762362616ce6ab45d83b4664d3d89/AdobeStock_594999227.png?w=1280&q=85&fit=scale&fm=avif)
Peak seasons are a golden opportunity to collect first-party data like never before. During these high-traffic periods, typically running from mid-October through mid-January, you can collect invaluable insights about how your customers think, feel, and interact with your site.
It's also when the stakes are high: a single broken checkout button or confusing navigation path can cost you sales you won't get back. But with the right approach, you can turn this concentrated window of traffic into actionable insights that boost conversions during the rush and inform improvements year-round.
This article gives you clear steps to prepare for peak season, monitor your site in real time, and extract lasting value from the data you collect. Whether you're gearing up for Black Friday, Cyber Monday, or the holiday shopping surge, you'll learn how to spot issues fast and fix them before they cost you revenue.
Key takeaways
Peak season (October through January) offers a concentrated window to collect first-party data and optimize conversions when traffic is highest
Real-time monitoring through dashboards, heatmaps, and session replay helps you catch and fix issues before they cost sales
Customer feedback tools like surveys and feedback widgets reveal why users struggle, not just where
Post-peak analysis turns seasonal insights into year-round improvements
Key peak season dates for 2026
Knowing when traffic will spike helps you prepare your monitoring and optimization efforts. Here are the critical dates to mark on your calendar:
Date | Event | Focus area |
|---|---|---|
November 11 | Singles' Day | International traffic, mobile optimization |
November 27 | Black Friday | High-volume traffic, checkout flow |
November 30 | Cyber Monday | Deal page performance, cart abandonment |
December 14 | Green Monday | Mid-month surge, returning visitors |
December 19 | Super Saturday | Last-minute shoppers, shipping messaging |
December 26–31 | Post-holiday sales | Gift card redemptions, returns |
Each of these dates brings different user behaviors and priorities. Black Friday shoppers often know what they want and move fast, while post-holiday visitors may browse more casually. Understanding these patterns helps you prioritize what to monitor and when.
Pre-peak preparation checklist
The best time to prepare for peak season is before traffic hits. Rushing to set up monitoring tools during a traffic surge means you'll miss early issues and spend valuable time on setup instead of optimization.
Here's what to have in place before your busiest days arrive:
Set up your monitoring dashboard
Create a dedicated dashboard that surfaces your most critical peak season metrics in one view. You shouldn't need to jump between multiple tools when every minute counts.
Include these metrics at minimum:
Conversion rate by page and traffic source
Cart abandonment rate with trend comparison
Bounce rate on key landing pages
Error rates and page load times
Checkout completion rate by step
Build custom dashboards that pull these metrics together and set them as your default view during peak periods.
Configure alerts for critical metrics
Don't rely on manually checking dashboards during your busiest days. Set up automated alerts that notify you when metrics cross concerning thresholds.
Configure alerts for:
Conversion rate drops of more than 10% compared to the previous day
Sudden spikes in bounce rate on checkout pages
Error rate increases on any page in your purchase flow
Unusual drops in traffic to key landing pages
Route these notifications to Slack or email so the right team members get notified immediately when something needs attention.
![[Visual] Share in real time via Slack](http://images.ctfassets.net/gwbpo1m641r7/NrQzonnNWGmn6RAF33WFI/ea4eb10640a11305675b4c4df6b0b0e1/Real_time_dashboards__1_.png?w=1280&q=85&fit=scale&fm=avif)
Contentsquare integrates with Slack to send real-time alerts.
Establish baseline metrics for comparison
You can't spot anomalies without knowing what normal looks like. Before peak season begins, document your baseline metrics for key pages and flows.
Record your typical:
Daily and weekly conversion rates
Average session duration by page type
Scroll depth on product and landing pages
Click-through rates on key call-to-actions (CTAs)
These baselines become your reference point for identifying when something's off during peak traffic. A 2% conversion rate might be cause for celebration or concern depending on what you normally see.
6 ways to optimize UX during peak traffic
An experience intelligence platform can make all the difference during high-traffic periods, offering behavior analytics tools that let you optimize and deliver an excellent UX during a traffic surge. These same tools then remain available throughout the year to sustain your growth goals.
Through quantitative and qualitative data, you can:
See what users do on your site and understand why they behave a certain way
Uncover issues users face and fix them immediately
Access the user-related metrics that matter to your business
1. Launch surveys to capture real-time feedback
Capture customer feedback during high seasons using survey templates. You can also create your own survey from scratch, adding as many custom questions as needed.
Peak season gives you a limited window to gather insights from a much larger audience than usual. Even a single-question survey can provide quick insights into how you're doing or what you should do. Consider a simple question like: 'What's one thing you wish our website offered that it doesn't already?'
What you can do with surveys: frustrated visitors will leave your website and choose your competitor instead. When this happens, trigger an exit-intent survey to show on the most-exited pages. Ask visitors why they're leaving and what you could do to improve.
![[Visual] Exit-Intent- Survey](http://images.ctfassets.net/gwbpo1m641r7/1UqasWRBnczjIUsx8wDIMB/149e80ca4b764400d3295ddb4c9c254b/Feedback_Widget__1_.png?w=692&q=85&fit=scale&fm=avif)
An exit-intent survey helps you find out why people leave your site.
Look for a pattern in their responses to find the source of their frustration. And then prioritize a fix to prevent more users from bouncing off your page before they could perform a desired action.
2. Monitor the checkout flow with feedback widgets
Voice-of-customer (VoC) tools allow you to get all sorts of feedback from your users. A popular option is to put a widget on your website that lets people rate their experience and provide additional context.
What you can do with feedback widgets: set up a feedback widget on the checkout flow to ensure you can get in-the-moment user feedback for any issues they might encounter.
This way, you can see whether a page element is causing problems and spot a serious issue before it affects hundreds of users, or more. Immediately identify a solution to prevent users from hitting a snag as they try to complete the checkout process on your site.
![[Visual] Feedback button - How would you rate your experience](http://images.ctfassets.net/gwbpo1m641r7/6zpie5F6Gwd4oyqXaxBfcN/b7e9b7f3bfcc6265f47b5294d8fec319/Feedback_button.png?w=1280&q=85&fit=scale&fm=avif)
Hear directly from your users with Contentsquare's feedback widget.
3. Track critical metrics with customizable dashboards
Dashboards offer a visual overview of some of your most valuable metrics.
What you can do with dashboards: keep an eye on your most important metrics on the dashboard to easily spot trends and quickly solve issues.
For instance, the last thing you would want for your ecommerce customer experience (CX) is a broken checkout button, which causes cart abandonment and a huge drop in traffic. But, if you keep an eye on your dashboard and notice an unusual bounce rate uptick on your checkout pages, this could be a sign that there's an issue, so you can get it fixed before it's too late.
Essential peak season metrics to watch
During peak traffic, focus your real-time monitoring on these metrics:
Metric | Why it matters during peak | Action threshold |
|---|---|---|
Conversion rate | Direct revenue impact; small drops multiply with high traffic | >10% drop vs. baseline |
Cart abandonment rate | Signals checkout friction when it hurts most | >5% increase vs. baseline |
Bounce rate | Indicates landing page or load time issues | >15% increase on key pages |
Page load time | Slow pages cost sales; users won't wait | >3 seconds on any page |
Error rate | Technical issues compound during traffic spikes | Any increase warrants investigation |
Checkout completion by step | Pinpoints exactly where users drop off | Unusual drop at any step |
With Contentsquare's Impact Quantification capability, you can see the revenue impact of issues in real time, helping you prioritize which problems to fix first when multiple issues compete for attention.
Pro tip: customize your dashboard for the holiday season so that you can easily find all your relevant metrics. Switching between multiple analytics tools is a time-sink when you're already very busy catering to the influx of customers.
4. Analyze user behavior with heatmaps
A heatmap lets you analyze complex site data through color-coded representations. The visual cues vary by hue or intensity, allowing you to understand the represented values in seconds.
What you can do with heatmaps: you can expect a spike in new user count when the holiday season starts, which means it's important to keep track of first-time users' experience on your site.
Segment new users to understand first-time visitor behavior
In Contentsquare, go to the Heatmaps capability and segment by 'new users' to see how this segment is behaving on your most important pages. Returning users would already be familiar with your site, but maybe your new users would need guidance to find their way to the checkout page.
Compare peak traffic patterns to baseline data
Busy periods bestow additional traffic to less popular pages. So during this time, you might have a bunch of pages with more heat data than they had previously.
This event creates the perfect opportunity to analyze pages that didn't get much traffic earlier in the year. You now have the chance to collect essential information about what and how to improve.
Use Contentsquare's side-by-side comparison feature to view heatmaps from your baseline period next to peak season data. Look for:
CTAs that get less attention during peak (users may be more focused or rushed)
Navigation elements that new users struggle to find
Content that performs differently with higher traffic volumes
These comparisons reveal whether your site works as well under pressure as it does during normal periods.
![[Visual] ab test heatmaps](http://images.ctfassets.net/gwbpo1m641r7/71Feljv3nwR0ng3PEiPGEG/c5c4f991ef679e660e08970edb2a894a/ab_test_heatmaps.png?w=1280&q=85&fit=scale&fm=avif)
Contentsquare's Heatmaps capability.
5. Validate assumptions with session replay
Session recordings (or replays) are renderings of real user actions, such as clicks, scrolls, and taps, on a website. They're used to gain a better understanding of how users interact with a site, making it easier to spot issues, optimize UX, and enhance conversion rates as a result.
What you can do with session replays: spot small issues and improve your conversion rate immensely. There are two ways to go about this:
Jump into your replays if you detect an increase in rage clicks and u-turns (instances where users go to a page and then quickly return to the previous one) or any other important metric in your dashboard.
Even if everything seems fine, block some time daily to watch replays. Sort by frustration score and watch the most relevant session replays on your important pages from the last 24 hours.
![[Visual] Predictive personalization - Sense frustration](http://images.ctfassets.net/gwbpo1m641r7/7CJd1Lbsu5D6mU1Eeyv9TH/f1127c713c342865da1d0ca606b620d9/Session_replays_event_stream.png?w=1280&q=85&fit=scale&fm=avif)
Sort your replays by frustration score to find out why your users rage clicked or dropped off.
6. Combine features for faster issue resolution
The best part of using an all-in-one platform is you can complement one tool with another. This capability enables you to know when users hit a snag and fix it, get buy-in for your improvement ideas, and ultimately polish the conversion process.
So while you're in the swing of things, tap into the power combos available on Contentsquare:
If you have a Contentsquare NPS® survey or feedback widget set up, filter the recordings by negative comments and detractors to find out why they're unhappy. Even if users don't reveal much in those surveys, the replays might help you find the reason they're frustrated and decide what to fix.
Lots of campaigns and seasonal promotions come with the holiday season! So filter sessions relevant to seasonal campaigns. Use the referrer URL filter or events to isolate the sessions that occurred as a result of a campaign, and see if users coming from that campaign are experiencing the site as expected.
Use Contentsquare's powerful built-in AI, Sense, to streamline your workflow during peak season. For example, use it to summarize replays or analyze user sentiment in survey results to free up your time to focus on high-priority tasks that drive results.
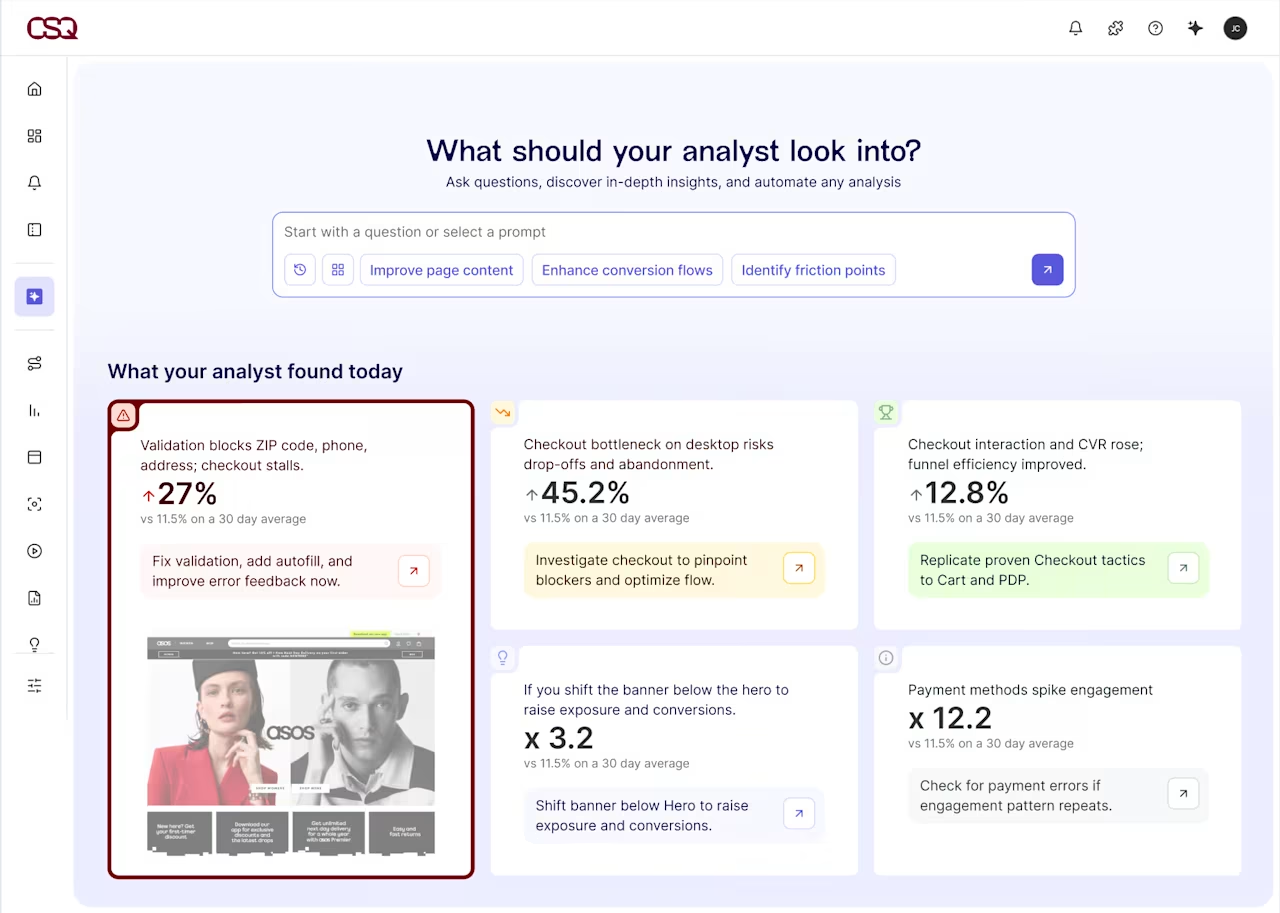
Contentsquare's Sense gives you a fast analysis of your user data.
Create a daily peak season monitoring routine
During peak season, establish a consistent daily workflow to catch issues early:
Morning check (15 minutes): review overnight dashboard alerts and conversion trends. Flag any anomalies for investigation.
Midday review (10 minutes): check real-time traffic patterns against expectations. Watch 3-5 session replays sorted by frustration score.
End-of-day analysis (20 minutes): compare day's performance to baseline. Review any new feedback widget submissions. Prioritize fixes for the next day.
This routine keeps you proactive rather than reactive, catching small issues before they become big problems.
Common peak season pitfalls and how to avoid them
Even well-prepared teams can stumble during peak season. Here are the most common mistakes and how to prevent them:
Waiting until traffic spikes to set up monitoring. By then, you've already missed early issues and you're scrambling to configure tools instead of optimizing. Set up everything at least two weeks before your first major peak date.
Ignoring mobile experience. Mobile traffic often increases disproportionately during peak season as shoppers browse on the go. Test your checkout flow on multiple devices and monitor mobile-specific metrics separately.
Making major site changes during peak. Resist the urge to launch new features or redesigns when traffic is highest. The risk of introducing new bugs outweighs potential benefits. Save changes for after peak season.
Focusing only on conversion rate. A high conversion rate means nothing if users can't complete checkout. Monitor the entire funnel, especially error rates and checkout completion by step.
Not having an escalation plan. Know who to contact for different types of issues, like technical bugs, payment processing problems, inventory errors. Document this before peak season starts.
Post-peak analysis for year-round optimization
Peak season doesn't end when traffic returns to normal. The data you've collected represents your largest sample size of the year, making it invaluable for identifying improvements that will benefit your site year-round.
Key questions to answer after peak season
Once the rush subsides, dig into your data to answer these questions:
Which pages had the highest and lowest conversion rates? What made them different?
Where did users experience the most friction? Did the same issues recur across multiple days?
Which traffic sources delivered the highest-quality visitors? Which underperformed?
What feedback themes emerged from surveys and widgets? Are there patterns you can address?
How did new users behave differently from returning customers?
Turn seasonal insights into permanent improvements
Use Contentsquare's Journey Analysis capability, which visualizes the paths users take through your site, to map the routes that led to conversions versus abandonment. Look for:
Common drop-off points that appeared consistently throughout peak season
Navigation patterns that successful converters shared
Pages that new users struggled with but returning visitors handled easily
Prioritize fixes based on impact and effort. Issues that affected thousands of users during peak season will likely affect hundreds during normal periods—they're worth addressing now rather than waiting for next year's rush.
Document what worked and what didn't. Create a peak season playbook that captures your learnings: which alerts proved most useful, what monitoring routine worked best, which issues you wish you'd caught earlier. Next year's preparation will be easier with this foundation.
Real-world results from peak season optimization
Retail giant Halfords turned to Contentsquare's Session Replay and Surveys to tackle the challenges of peak-season traffic.
By identifying friction points and optimizing the online shopping journey, Halfords not only captured more sales but also improved customer satisfaction, with their Net Promoter Score® (NPS®) increasing by 2.4% over two months.
They also saw a 15% boost in conversion rates on their Black Friday Hub page, translating to millions in additional sales during their busiest period.
Attract returning customers, in and out of season
Contentsquare tools and features are built to sustain your peak season sales and conversion goals during busy seasons. You can use them alternately, or to complement each other, depending on your needs during high-traffic periods.
Don't just sit on that first-party data when the peak season comes. Use Contentsquare to mine it and glean meaningful insights that will help you improve the user experience. Remember: happy, satisfied customers keep coming back, no matter the time. And through continued user research and UX testing, you can give them plenty of reasons to do just that.
FAQs on increasing holiday sales
Peak season refers to the busiest shopping period of the year, typically running from mid-October through mid-January, when online sales see rapid increases due to major shopping events like Black Friday , Cyber Monday , and the holiday season. For most ecommerce businesses, this period generates a disproportionate share of annual revenue, making optimization during these weeks especially valuable.


![[visual] man and a woman in front of the laptop](http://images.ctfassets.net/gwbpo1m641r7/4MGw9yViQS4fJSNlpsrUFB/b3cc18c9886ebfad5f35ef56c0b9ef64/Magic_Stick_-_Photo_4.jpeg?w=624&q=85&fit=scale&fm=avif)