![[Visual] Stock group in office](http://images.ctfassets.net/gwbpo1m641r7/4qn7ZZ3yGGwvON1mesdH3s/c4d1c9d121d8d67b184011b4bcd2b6bd/Untitled_design__3_.jpg?w=1280&q=85&fit=scale&fm=avif)
You already know the holidays—or any big sales period like Christmas or Cyber Monday—can send your site traffic soaring. But with that surge comes a big risk: missed opportunities and wasted value if your UX isn't up to the challenge.
Potential customers have less patience during the busy season, and plenty of other options; it won't take much for them to bounce. Conversion bottlenecks cost you more when traffic is high, and shoppers using your site for the first time during busy periods give you a better chance to hook them and keep them coming back when the holidays are over.
This guide walks you through actionable steps to fine-tune your UX—from your checkout to your holiday gift guide—to drive more conversions, increase sales, and keep your customers delighted when it matters most. You don't need to do everything here to make an impact; even just one of these optimizations will increase your chances of having a more profitable holiday season.
Key takeaways
Fix checkout flow bugs before traffic spikes to prevent compounded revenue loss during peak periods
Collect user feedback through surveys to understand what drives conversions and what creates barriers
Set up real-time monitoring to catch issues as they happen during high-traffic events
Understand what your users want and need
If you want to convert traffic spikes into sales and loyal customers, you first need to understand why people visit your website and how they contribute to your internet traffic on a normal, average day so you can serve more of them when traffic peaks.
Use homepage surveys to identify user goals
Why it matters: knowing who you're targeting (your ideal customer profile or buyer persona) and what they need your product for (sometimes known as their jobs-to-be-done (JTBD)) will help you optimize your site for real people and use cases.
How to do it: use Contentsquare's Surveys capability, which lets you create and deploy targeted questionnaires across your site, to place a survey on a popular page (like the homepage) and ask users:
What's your main reason for using this website/product?
What, if anything, is stopping you from achieving your goal?
Then analyze the responses to find patterns and define your most common user groups and their goals. You'll also discover the barriers your target audience is experiencing so you can work on fixing them asap.

Customise your surveys to suit your site with Contentsquare.
Track how users found your site
Why it matters: knowing how users found your site and heard about your brand helps you boost the most effective digital marketing channels during times of high traffic.
Google Analytics or similar tools can't track everything, especially word-of-mouth referrals and offline ads, so asking people directly will give a more complete picture.
How to do it: use Contentsquare to set up a traffic attribution survey using one from the platform's existing templates. Trigger the 'pop-over' survey widget to display on all pages or target it to your most important ones (for example, the highest-traffic landing pages).
Find and fix bugs in your checkout flow
When traffic surges, any bugs on your site will compound and create friction for holiday shoppers who have little time or patience. Fix them before the rush, and your conversion rates will thank you.
Watch user sessions to spot checkout friction
Why it matters: your checkout flow is the final barrier stopping users from converting into customers. Finding and fixing checkout bugs before busy periods helps you increase conversion rate and revenue when traffic is at its highest.
How to do it: the fastest way to see where people get stuck in your checkout or sign-up flow is to watch them interact with it. Use Contentsquare's Session Replay capability, which records real user sessions, to review individual users' mouse movements, clicks, taps, and scrolling patterns across multiple pages on desktop or mobile devices.
Filter replays to show only sessions that contain or ended on a checkout or request a demo page (Ex: mysite.com/demo.html), but did not end with an order confirmation page (Ex: mysite.com/order-complete.html).
![[Visual] Experience Analytics - AB Test Session Replay](http://images.ctfassets.net/gwbpo1m641r7/6B0G5JrPHs7GYx3UTU4sm9/dd0a6aa32cad72ad6a6b087dcd21e816/Experience_Analytics_-_AB_Test.png?w=953&q=85&fit=scale&fm=avif)
Contentsquare's Session Replay capability, showing a user's mouse movements
Watch these sessions to see the journey each user took before bouncing from the checkout, how long they spent on each page, and what they clicked or ignored. You'll start to see patterns. Identify the most common behaviors that could be causing drop-offs and fix any problems to improve your checkout rate.
Pro tip: if you track cart abandonment rate or other custom metrics specific to your website, create them in Contentsquare and add them to your dashboard. That way, you can constantly monitor their performance and intervene with a fix as soon as a problem pops up.
Prioritize fixes by revenue impact
Not all bugs are created equal. A broken promo code field on your checkout page will cost you more than a misaligned image on a low-traffic blog post. Before you start fixing everything, figure out which issues actually matter to your bottom line.
Contentsquare's Impact Quantification capability, which calculates the revenue impact of UX issues by connecting user behavior to business outcomes, helps you see the business impact of specific friction points.
Instead of guessing which bugs to tackle first, you can see which issues are costing you the most revenue and prioritize accordingly. This is especially valuable before peak traffic periods when your dev team's time is limited and every fix needs to count.
Identify page elements that get ignored
Why it matters: you need to know if your pixel-perfect designs are working as intended in the real world. Seeing how far users scroll and if they click where you want them to helps you design pages that convert during traffic peaks.
How to do it: use Contentsquare's Heatmaps capability on high-traffic pages to see where users are clicking, what they're missing, and what might be distracting them. You'll see how many clicks call-to-actions (CTAs) get and if users are misclicking non-clickable elements.
Heatmaps are simple and visual, making them an excellent way to explain your work to non-designers—and get buy-in for website redesign proposals ahead of the busy season.
Pro tip: filter heatmaps to view click activity for critical cohorts (like users who entered or exited on specific pages) or to compare users who purchased against those who didn't. This comparison often reveals exactly what's working for your best customers, and what's tripping up everyone else.
![[Visual] Contentsquare-filter-heatmaps](http://images.ctfassets.net/gwbpo1m641r7/3qDkTxc7Y0dpmPlAKEZXD2/927669f4a1370c04c5d048d8043fef0f/Contentsquare-filter-heatmaps.png?w=1280&q=85&fit=scale&fm=avif)
Contentsquare lets you compare segments using heatmaps.
Detect where users get frustrated
Why it matters: view and filter session replays to quickly spot website bugs and issues and implement fixes before traffic starts to spike.
How to do it: leverage Contentsquare's Session Replay across your website, then filter for important sessions containing rage clicks (where users repeatedly click on an element).
Beyond rage clicks, watch for these common frustration signals:
Dead clicks: users clicking on elements that look clickable but aren't (like images or text that resembles a link)
Erratic scrolling: rapid up-and-down scrolling that suggests users can't find what they're looking for
Form field struggles: repeated attempts to fill in the same field, often indicating validation issues or unclear requirements
Back-and-forth navigation: users bouncing between pages, unable to complete their intended task
When you spot these patterns, you've found the friction points that'll cost you conversions during high-traffic periods. Fix them now, before the rush.
Discover why users leave without converting
Why it matters: people might leave your site without buying for lots of reasons: maybe they were looking for information, couldn't find what they needed, or got fed up with poor UX.
You can't convert every user into a customer, but knowing why people leave gives you a chance to fix the problems behind the bounces and drive more conversions during peak traffic times.
![[Visual] Dashboard conversion and bounce rate](http://images.ctfassets.net/gwbpo1m641r7/3F2OzaDIkGuM3m2tO3lV01/2514a7af51bc3524d9644f3f61ba86da/platform-overview-dashboard.svg?w=1140&q=85&fit=scale)
Monitor important metrics on your Contentsquare dashboard before peak season to spot problems and fix them quickly
How to do it: first, ensure your Contentsquare tracking code is installed so we can start collecting data. Then, click the 'New Dashboard' button in the upper-right corner of your screen. From there, you can either create a dashboard from scratch or select a customizable pre-made template based on your specific needs.
Add widgets to track metrics that give you an early warning that something is amiss:
Bounce rate by page to identify which pages lose users immediately
Exit rate trends to spot pages where users abandon their journey
Session duration changes that might indicate confusion or frustration
Session time grouped by browser to identify device-specific issues contributing to drop-offs
Test site performance before traffic spikes
Why it matters: a site that loads fine with normal traffic can buckle under holiday volume. Slow pages don't just frustrate users, they directly hurt conversions and your overall SEO performance; consider if your CDN is properly configured for the load.
How to do it: before the busy season hits, stress-test your site's performance and establish baselines for your key metrics.
Metric | What it measures | Target threshold |
|---|---|---|
Largest Contentful Paint (LCP) | How quickly main content loads | Under 2.5 seconds |
First Input Delay (FID) | How quickly the page responds to interaction | Under 100 milliseconds |
Cumulative Layout Shift (CLS) | Visual stability as the page loads | Under 0.1 |
Time to First Byte (TTFB) | Server response time | Under 800 milliseconds |
Contentsquare's Web Performance capability (formerly Speed Analysis), which tracks page load performance and connects it to user behavior data, lets you monitor these Core Web Vitals to see how page performance correlates with user behavior.
You might discover that your product pages load fine on desktop but struggle on mobile, which is exactly the kind of insight you need before peak traffic arrives.
![[visual] Trackr errors, performance, and experience in one platform](http://images.ctfassets.net/gwbpo1m641r7/5kij4TrV5pm5szmdUXmsFV/aa2461e9d49a006265c63e335acd8e15/Contentsquare-speed-analysis.jpeg?w=1280&q=85&fit=scale&fm=avif)
Track web metrics with Contentsquare.
Optimize your mobile checkout experience
Why it matters: mobile traffic dominates during holiday shopping periods, but mobile optimization often gets treated as an afterthought. A checkout flow that works perfectly on desktop can be a nightmare on a phone screen.
How to do it: use session replay filtered specifically for mobile sessions to watch how users interact with your checkout on smaller screens. Pay attention to:
Touch targets that are too small or too close together
Form fields that get obscured by the keyboard
Buttons that require scrolling to find
Payment forms that don't auto-format card numbers
Mobile users are often multitasking—shopping while commuting, during lunch breaks, or from the couch. They have even less patience than desktop users for friction in the checkout flow. Every extra tap or moment of confusion is an opportunity for them to abandon their cart.
Set up real-time monitoring for peak periods
Why it matters: during high-traffic events, problems that would normally affect a handful of users suddenly impact thousands. A checkout bug that goes unnoticed for an hour on a normal Tuesday could cost you significant revenue on Black Friday.
How to do it: configure alerts in Contentsquare to notify you when key metrics cross critical thresholds. Set up monitoring for:
Sudden spikes in error rates
Unusual increases in bounce rate on key pages
Drops in conversion rate below your baseline
Page load times exceeding acceptable thresholds
The goal is to catch issues as they happen—not discover them in your Monday morning analytics review. Real-time monitoring lets you intervene quickly, whether that means rolling back a problematic deployment, ensuring server scalability, or alerting your team to a payment processing issue.
Learn what persuades users to convert
UX optimization is not just about fixing bugs: insights also help you create a delightful customer experience that leads to more conversions.
Create post-purchase surveys
Why it matters: existing customers know something you don't: what made them convert in the first place. By simply asking them what convinced them to buy, you can optimize your website to funnel more users down the same path.
How to do it: create a post-purchase survey on your thank-you or order-confirmation page to catch customers while the experience is fresh in their minds. Ask customers to rate their experience, then use survey logic to trigger relevant follow-up questions to learn what they loved, what could be improved, and what almost stopped them from purchasing.
![[Visual] Capabilities - Survey - Asset — Features — AI - How was your experience](http://images.ctfassets.net/gwbpo1m641r7/6eSUQ1pwzyTNv9GWlrISSV/938c95d2cfbe1319a90e7ebc74b9ff6b/AI_analysis.svg?w=655&q=85&fit=scale)
An example post-purchase sentiment snapshot in Contentsquare.
Categorize the responses to find popular themes, then:
Double down on things customers love and make them a bigger or more prominent part of the experience
Address the issues and 'almost-deal-breakers' that could be stopping less-determined shoppers from converting
Collect ongoing feedback with site-wide widgets
Why it matters: your users and customers have more experience using your website than you do. Giving them a way to leave feedback on any site page, whenever they like, helps you learn what's working well so you can share wins with the team and do more of the good stuff before the busy period begins.
How to do it: add a site-wide feedback widget so users can click on the discreet feedback button on any site page and rate their experience at any time. Filter to 'only 'Love' responses' to review what's pleasing users the most. The less-positive comments (yes, you will get those too) help you find and fix website bugs quickly, especially since users can tag any page element to go with their comment.
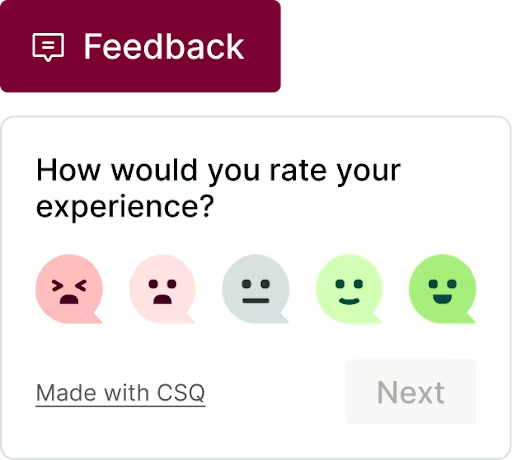
Contentsquare's feedback widget helps you discover what your users are feeling as they browse your website
Make UX optimization a year-round practice
Traffic spikes might be temporary, but good UX delivers value year-round.
Using cheap tricks to make a ton of holiday sales isn't going to deliver value for the business if you end up with returned items or churning users. The best way to increase conversions and earn loyal customers during a traffic spike is to make UX optimization a year-round habit.
FAQs on getting ready before a traffic spike
Optimizing before peak periods prevents compounded revenue loss, as conversion bottlenecks cost more when traffic is high and impatient shoppers have plenty of alternatives. First-time users during busy periods also give you a better chance to hook them and keep them coming back when the holidays are over.