![[Visual] Product development stock image](http://images.ctfassets.net/gwbpo1m641r7/5yCLBgNgfG0TgcxjAUONJb/c7cd15ab66760595981ddd0903331d84/Woman_Working_on_Laptop_at_Home_Office_in_Spring.jpeg?w=1280&q=85&fit=scale&fm=avif)
You have to get approvals, file a developer ticket, wait for them to build the variant, then set up the experiment and analyze the results. And, these steps happen across different marketing analytics tools, making it easy to lose context between steps.
Factor in an already-full developer backlog or a more complex experiment, and getting a test out the door can take days, even weeks. By the time it goes live, you’ve lost momentum and have more ideas piling up.
Now, picture a single workflow where you go from spotting a problem to launching a test and validating the result—without jumping between tools. You spend less time on handoffs and more time on what actually moves the needle.
This guide shows you how to build that connected experimentation workflow to ship winning variants that improve customer experience and conversions.
Key insights
Testing programs slow down when teams prioritize ideas based on gut feel instead of user behavior. Contentsquare’s AI agent, Sense Analyst, pulls behavioral data from across the platform to surface top friction points and what they're costing you.
A lift in your primary metric isn’t enough if another important KPI drops. Define what success looks like before launch, so you know whether the result is actually worth shipping.
Not all experiments need a developer. Use Contentsquare Experimentation to build variants yourself, or let Sense Analyst set up the test for you.
Knowing why a variant won is just as important as knowing that it did. Use Contentsquare’s Heatmaps and Zoning analysis to compare user behavior across both versions, so you know which elements are worth testing again.
How to build a continuous experimentation workflow in 6 steps
Every test you run shouldn’t be a one-and-done project. What you learn from one experiment should help you decide what to test next.
Say you test 2 messaging angles on a paid campaign landing page to increase free trial signups. One focuses on saving time, the other focuses on cutting costs. The results show that the time-saving message performs better.
Use that insight in your next test. Try the same value proposition on a high-traffic page or with a different audience segment to see if the pattern holds.
That way, each new test builds on what you already know about your users. You also get fresh evidence to help you reprioritize your backlog.
Here's how to build a continuous experimentation workflow in 6 steps.
Step 1: find your highest-impact opportunities to test
You probably already have a backlog of ideas you could test. But not every idea deserves the same priority, even when a stakeholder is pushing hard for it.
Look for signs of friction on your key pages and user journeys. For example, if you want to increase demo requests, find where users drop off before reaching or completing the form. Then, check how many users are affected and whether fixing the issue could improve conversions or revenue.
A problem affecting a large share of high-intent visitors—say people who reach the pricing page but abandon the demo form—deserves more attention than a usability issue affecting only a few people.
Did you know? Sense Analyst can analyze behavioral data across your key pages and journeys on your behalf.
Give it a prompt, like:
Analyze my checkout funnel and show me where users are getting stuck and why. Then give me the three highest-impact issues to focus on to improve conversions.
And Sense Analyst will investigate across Contentsquare capabilities, such as Journey Analysis, Funnels, Heatmaps & Zoning Analysis, and Session Replay, to come back with the specific friction points behind the drop-off. It will also estimate their potential impact on business outcomes—like revenue—and recommend what to fix first.
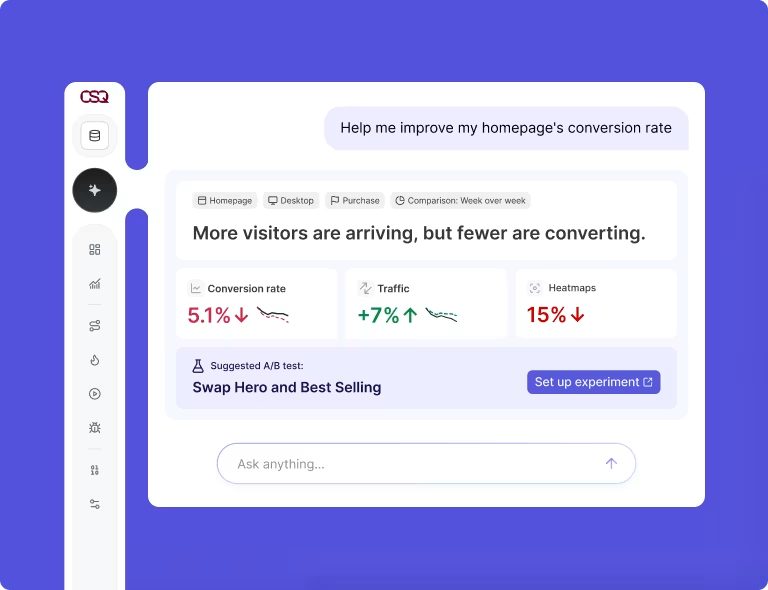
Sense Analyst brings the highest-priority friction points and recommended actions into one view, so you can see which issue needs attention first and why
Leading U.S. telecommunications provider Optimum, used Sense Analyst after a major campaign update to see how new homepage modules were performing.
The team wanted to look at whether people were actually engaging with those modules week after week to determine whether they were worth prioritizing in the upcoming testing roadmap. With Sense Analyst, they cut analysis time from 2–3 hours to just minutes per insight.
Step 2: turn your top opportunity into a hypothesis
Before writing your hypothesis, dig into why users aren’t completing a key step on that page. Use what you find to decide which change is most likely to remove that barrier and what result you expect to see.
Your hypothesis should spell out:
What you’re changing on the page or journey
Why you expect that change to improve the user experience
Which metric you expect to improve, and in what direction
For example, if the data suggests the number of fields is contributing to form abandonment, your hypothesis could say:
If we shorten the form, more visitors will complete it because it requires less effort, which will increase form completion rates and demo requests.
Pro tip: jump straight into a relevant session replay from Sense Analyst’s responses to see what users clicked, where they paused, and what happened right before they dropped off.
If your team has zoning set up for that page, Sense Analyst pulls that in too, so you can see how people are interacting with each element. You get a clearer picture of what’s getting in the way, which shapes your hypothesis.
Instead of looking at anecdotal feedback or raw data to generate test hypotheses, I can always ask Sense Analyst to look at areas on the site—it helps us build a hypothesis before we invest any time adjusting, developing, and building on it.
Step 3: agree on success criteria before launching the experiment
Clear success metrics keep you from calling a test a win when the improvement is too small to matter or another critical metric takes a hit.
So before you launch the test, define your success criteria:
Primary metric: the main outcome you want the experiment to improve
Minimum lift: how much that metric needs to improve for the change to be worth shipping
Secondary KPIs: key metrics that shouldn’t get worse because of the change
For example, if you’re testing changes to a key landing page to get more visitors to start a free trial, your success criteria could look like this:
Free trial conversion rate, as your primary metric
A +10% relative increase in the free trial conversion rate, as the minimum lift
Activation rate and trial-to-paid conversion, as your secondary KPIs
Pro tip: use Contentsquare's A/B testing dashboards to track the success metrics you defined without manually setting up segments for each variant. The dashboard automatically creates segments for your control and variants, so you can compare primary and secondary KPIs across them in one view.
Share it with your team so everyone is working from the same numbers when it's time to decide whether the test met your success criteria.
![[Visual] AB-test-dashboard](http://images.ctfassets.net/gwbpo1m641r7/1QbYMKrPwcONHTXhGbGKFY/c2d9fcea5da99ca490c544c2df62646c/AB-test-dashboard.jpg?w=861&q=85&fit=scale&fm=avif)
The A/B testing dashboard lets you track how control and variant performance changes over time across key site-level metrics
Step 4: build and launch the experiment without waiting on developers
Even when you know exactly what to test, experiments can get stuck waiting for a developer to build the variant.
For straightforward front-end tests involving copy, CTAs, styling, or layout, you can skip the wait and build them yourself using AI-powered A/B testing tools. But if a test affects functionality, backend logic, security, or performance, it’s best to bring in engineering since those changes are more technical.
Did you know? Contentsquare lets you create simple web experiments in the visual editor. You can change copy and styling, hide elements, or swap images without writing code or filing a developer ticket.
Sense Analyst can automatically recommend a test to run on a specific page and build the setup for you—including the name, hypothesis, page selection, variants, audience, and primary metric. Alternatively, tell it the test you want to run, and it does the same. Once a variant is ready for permanent implementation, create a Jira ticket—directly from Sense Analyst—with the variant and technical details for engineering.
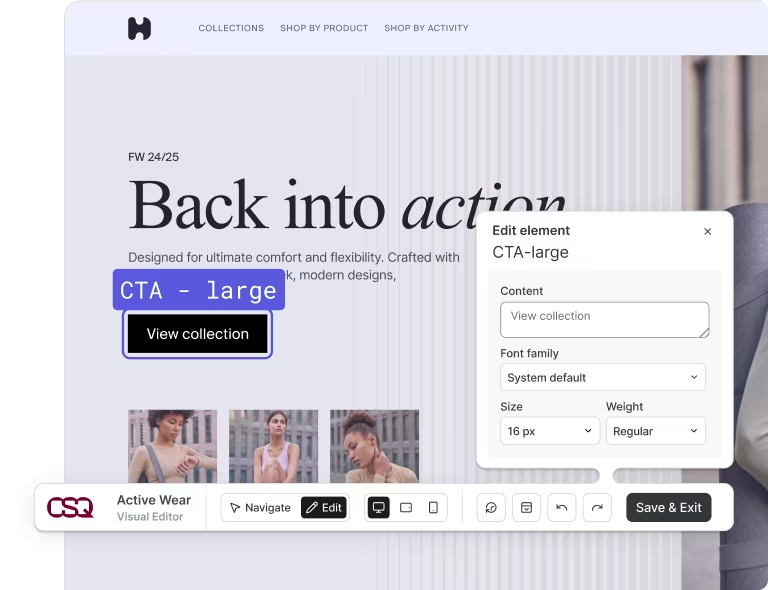
You can test out new copy, page structures, and calls-to-action without waiting for devs or designers.
Step 5: compare variant performance and understand what drove the result
A variant beating the control doesn’t automatically make it worth shipping.
Check whether the winning variant improved your primary metric without negatively affecting your secondary KPIs. Compare how users behaved across the variants to understand what caused the difference.
For example, if a new landing page message increased a free trial conversion, compare how visitors interacted with the new version versus the control.
Did more people click the CTA?
Did they scroll farther down the page?
Did they or spend more time engaging with key sections before signing up?
Those differences explain why the variant performed better and what you should carry into future tests.
Pro tip: use the analysis Sense generates when the test ends to see both the statistical result and the behavioral reason the variant won.
Sense pulls from Contentsquare capabilities like Journey Analysis and Heatmaps to show which version performed better, what users did differently on each one, and how that behavior explains the result. Use Zoning analysis in Heatmaps to compare how users engaged with each variant side by side.
Global direct-to-consumer bicycle brand Canyon Bicycles used Contentsquare to test whether a video or still image should appear in the second position on its homepage. The team set up separate segments for the control and variant, then used zoning analysis to see how people interacted with each one.
This gave the team a clearer story to take into the final report—quantitative results combined with visual evidence of how users responded in the different groups.
![[Visual] canyon ab test](http://images.ctfassets.net/gwbpo1m641r7/1HT36JFKn1MheB8CdzrrLt/8f9eb76572597ebb7bffe189a92850c9/canyon_ab_test.png?w=624&q=85&fit=scale&fm=avif)
Canyon’s side-by-side Zoning Heatmaps of its homepage A/B test
Step 6: use what you learned to find the next opportunity
The insights from an experiment, whether it’s a win or not, should help you understand your users better and decide what’s worth testing next.
To keep that learning useful, document:
The evidence that led to the test
The specific change you tested
The result compared with your success criteria
What you learned about user behavior
Turn those findings into clear next steps so you know which changes to roll out to your website, to investigate further, or to add to your testing backlog. Share that context with stakeholders so the next decision builds on what your team already knows instead of starting from scratch.
Did you know? Sense Analyst brings together the analysis that led to the test, the test plan, and the results all into a slide deck you can download and share right away.
You can also add supporting analyses like Funnel Analysis and Zoning data, without having to pull screenshots from different tools to compile a report for stakeholders.
Turn your testing backlog into a continuous experimentation workflow
A continuous experimentation loop shortens the time between finding a high-impact problem and launching an experiment. It also changes how your team learns from tests, so each result feeds the next round.
To speed things up, keep every stage of the workflow on one platform. That way, the context and reasoning behind the test carry through the entire process.
Contentsquare connects analysis directly to action. With Sense Analyst, you can go from identifying an opportunity to setting up a test and optimizing digital experiences in one workflow—without jumping between tools. This helps you turn insights into changes that improve the user experience and boost conversions.
FAQs about launching experiments faster
Testing programs slow down as they scale because the stages of experimentation—from spotting friction to running the test and analyzing the results—can happen across disconnected tools.
Each handoff costs your team time, and useful context gets lost between steps. So as the number of tests grows, these delays add up and make the whole process harder to move through quickly.

Jessica is a freelance Content Writer at Contentsquare and a content marketing specialist with over five years of experience creating and repurposing helpful, relatable content for leading B2B SaaS brands including Softr, Hotjar, and Vena. Her superpower is turning product, user, and subject matter expert insights into product-led content that builds trust, supports sales, and drives business growth.
![[visual] Blog - anscombe quartet stock image](http://images.ctfassets.net/gwbpo1m641r7/5cPY8sQJxGIEOu052njiCb/b6ff0931add6905d4ff939909663c8f6/adam-satria-uXLgmicKSi4-unsplash.jpg?w=624&q=85&fit=scale&fm=avif)