![[Visual] Survey retention - stock image](http://images.ctfassets.net/gwbpo1m641r7/3xD9ghYf8jbPKMEwGAJVpi/2c197fc402ee4aec10737501dd1b9291/Indoor_Workspace_with_Women_Using_Laptops_and_Plants.jpg?w=1280&q=85&fit=scale&fm=avif)
You launch a campaign. Traffic spikes to your site and everything seems to be going well. But then you’re asked to justify the spend and now you’re scrambling to stitch together data so you (and stakeholders) can understand how your campaign actually performed.
Marketing analytics is how you avoid the scramble. This guide breaks down what marketing analytics is, why it matters, and what to measure.
Key insights
AI and automation are closing the gap between data and decision-making. Marketing analytics tools that once required specialized knowledge are now more accessible, making it easier for everyone within your team to uncover and act on actionable insights.
Marketing analytics give you evidence to back your ideas, so you’re more likely to get buy-in from stakeholders
The quality of your marketing data matters more than the amount of data you collect. Clean, well-structured data sets are more important than a large volume of data points that are difficult to analyze.
Access to near real-time data helps you make better data-driven decisions in the moment (like during a marketing campaign) so you can A/B test, learn, and iterate quickly
What is marketing analytics?
Marketing analytics is the process of collecting and analyzing data from marketing activities (like online ads or content marketing efforts) to measure performance and drive better decisions.
In the past (think pre-2000s), marketers only had access to analytics like page views or ‘hits’, but now, you can collect more in-depth customer data, including demographics and cross-channel attribution, and run predictive modelling.
For example, landing page analytics tell you how much time people spend on your page, which channels convert best, where people drop off, and more. Having this data helps you spot weak areas, so you know which page elements to improve.
And email marketing analytics help you spot high- and low-performing campaigns through metrics like open rates, click-through rates, and unsubscribe rates. Reviewing these metrics helps you learn about your audience’s preferences.
The data you get from marketing analytics (like social media, emails, content marketing, etc.) helps you answer questions like
What’s working well with our campaigns?
Where do our campaigns fall short?
What do we need to do to improve our campaigns?
Ultimately, marketing analytics gives you greater insight into what drives customer behavior so you can develop campaigns that resonate with your target audience.
Marketing analytics vs. digital analytics vs. web analytics
Marketing, digital, and web analytics all have similarities, but there are a few key differences.
Web analytics is the process of collecting, analyzing, and reporting data to understand and optimize how people use and interact with your website. Think metrics like website traffic, click-through rate, and bounce rate. Teams beyond marketing—like UX and IT—might use web analytics to monitor site performance.
Digital analytics spans your entire digital marketing presence and tracks performance across all touchpoints (including your website, app, newsletter, and social media). An example of digital analytics is the number of views a YouTube video received.
Marketing analytics draws on both digital and web analytics to answer the question, 'Did our marketing investment pay off?' The goal shifts from describing behavior (i.e. 'Our latest Instagram post got 345 likes') to connecting marketing activities to business outcomes (i.e. 'Our recent campaign increased conversions by 11%').
| Marketing analytics | Web analytics | Digital analytics |
|---|---|---|---|
What it is | Tracks marketing and campaign performance | Tracks website activity and visitor behavior | Tracks performance across all digital touchpoints |
What it measures (example metrics) | Conversion rates, campaign ROI, channel attribution, cost per acquisition | Bounce rate, sessions, session duration, traffic sources | Engagement, reach, click-through rate, open rate, return on ad spend |
Who uses it | Marketing teams, growth teams, CMOs | Marketing teams, IT teams, and UX teams | Marketing teams, digital teams, social media managers |
Why does marketing analytics matter?
Marketing analytics serves as your North Star to help you understand what’s working, what’s not, and where to invest next.
Primarily, marketing analytics helps you:
Prove return on investment (ROI): marketing analytics gives you concrete numbers to show you exactly which campaigns drove revenue (and why) so you can defend your spend, earn stakeholder trust, and make a strong case for bigger budgets
Catch underperforming campaigns: not every campaign is a winner, and the sooner you can identify poor campaigns, the faster you can course correct
Reduce wasted spend: analytics reveals where you’re burning through your marketing budget without a high enough return, so you can reallocate to the areas driving better results
Identify high-value marketing channels: marketing analytics—especially when connected to your CRM alongside first-party data—helps you pinpoint which channels bring your most valuable customers (the ones who convert the fastest, have the highest lifetime value, and stick around the longest), so you can continue investing resources into channels that work
💡 Pro tip: Contentsquare’s Acquisition Analysis tool identifies which traffic sources (including LLMs like ChatGPT) and campaigns drive the most engaged and valuable users (and helps you untangle attribution in the process).
Use it to quickly identify which channels perform well and which ones might not be worth the effort.
![[Visual] aquisition analysis](http://images.ctfassets.net/gwbpo1m641r7/58WJqiIWgpQSvDQlLAM9Uc/9c451a9e9ff9f3bbba37d19ab69ed6a1/aquisition_analysis.png?w=1280&q=85&fit=scale&fm=avif)
Measure how different channels drive conversions and engagement to evaluate your marketing campaigns’ performance
The different types of marketing analytics
The 4 types of marketing analytics are descriptive, diagnostic, predictive, and prescriptive. Understanding each type helps you better understand your data, so you know which type of analysis to conduct depending on the problems you need to solve.
Let’s take a deeper look at each.
1. Descriptive analytics
Descriptive analytics tell you what happened in the past. They are the foundation of any analytics practice and pull together historical data to give you a clear picture of past performance across campaigns, channels, and user behavior.
Think of descriptive analytics as your starting point. Before you can improve anything, you need a baseline to answer questions like 'What was our conversion rate last quarter?' and 'Which campaigns drove the most traffic?'
Each marketing tool will give you different analytics depending on its purpose. For example, a social media analytics tool like Buffer will capture data like engagement rate, follower growth, and impressions.
Whereas a tool like Contentsquare that tracks web and app activity collects behavioral metrics like sessions, scroll rate, bounce rate, conversions, click rate, time spent on page, and exit rate, capturing a detailed picture of how users actually experienced your site or app. This happens thanks to Smart Capture, which automatically records every interaction from day one without manual tagging. (View a list of all the metrics Contentsquare tracks.)
![[Visual] Dashboard](http://images.ctfassets.net/gwbpo1m641r7/2HO9a3oNs4acHfEWg0xnnr/6d790427a103f56a084b3d3bbd32b552/Dashboard.png?w=1280&q=85&fit=scale&fm=avif)
Track all your important descriptive analytics in Contentsquare
Example: 'Our bounce rate last quarter was 72%.'
2. Diagnostic analytics
Diagnostic analytics tell you why something happened so you can dig beneath surface-level metrics to uncover the root cause behind your numbers.
Maybe you have a landing page with low conversion rates but high time-spent-on-page, and you’d like to know what’s causing users to leave without converting.
Or maybe an ad campaign performed really well in April but poorly in September.
Diagnostic analytics let you dig deeper so you can form your marketing strategy on data, rather than guesswork.
Example: 'Our bounce rate is high because mobile load times exceed 4 seconds.'
💡 Pro tip: use Contentsquare’s diagnostic tools like Session Replay and Heatmaps to see what users do once they land on your site. Are they missing key elements? Getting stuck somewhere? Seeing them in action gives you useful context you can use to improve campaigns.
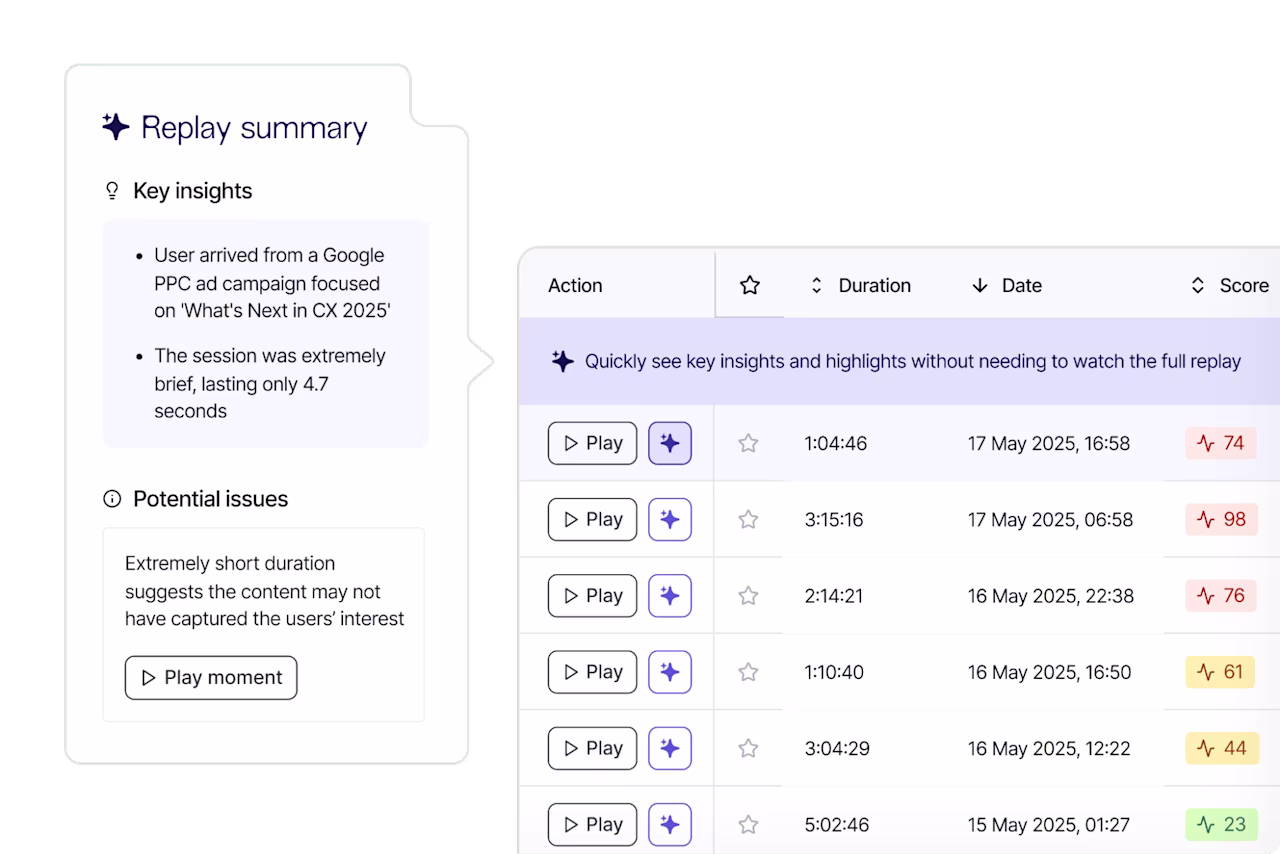
Watch replays to see where users get stuck and what elements move them further down your funnel
3. Predictive analytics
Predictive analytics use AI, machine learning, and historical data to tell you what’s likely to happen in the future—think of them as the Magic 8 Ball of your analytics.
With predictive analytics, your team has the foresight to prepare for events. You’ll have better insight into factors like
Which leads are most likely to convert
Which campaigns are likely to hit diminishing returns
How seasonal shifts might affect demand
Some teams might use a dedicated data science team to model out forecasts for their analytics, but you can also use tools with built-in predictive analytics.
Example: 'If load times stay the same, bounce rate will likely increase and could cost us $94,000 in sales next month.'
💡 Pro tip: Contentsquare’s Impact Quantification ties a predictive dollar value to events, like how much not fixing an API error or changing a CTA will cost you, so you can see the impact of your metrics and focus on initiatives that will bring the greatest return.
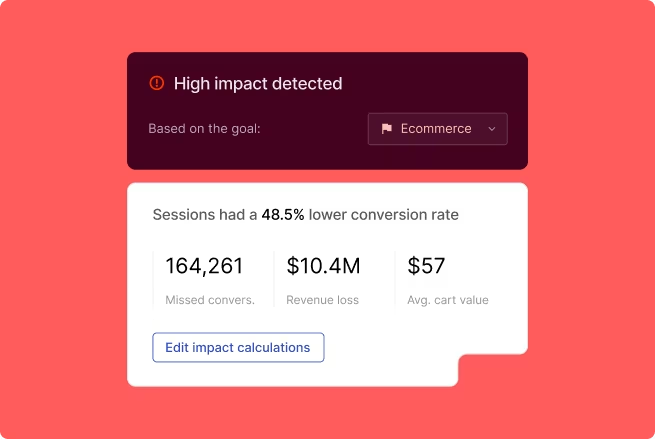
See the impact of each event with Impact Quantification
4. Prescriptive analytics
Prescriptive analytics give you data-backed recommendations and tell you what to do to fix your issues.
Think of prescriptive analytics as the logical endpoint of your analytics practice: descriptive analytics surface the problem, diagnostic analytics explain it, predictive analytics help you prioritize which issues to fix, and prescriptive analytics give you the roadmap.
Example: 'Compress images to increase site speed by 3 seconds and reduce bounce rate by 15%.'
💡 Pro tip: Contentsquare’s Sense is an AI-powered solution with the functionality to surface important insights, so you don’t need to rely on team members to dig through your data to find issues. With Sense, you can ask questions directly within the chat and receive tailored recommendations based on your industry.
![[Visual] sense](http://images.ctfassets.net/gwbpo1m641r7/6WNopM1a7nFgaG37d0upoj/2ca3c191d7eb7e887d36bb473ed42cd0/sense.png?w=1280&q=85&fit=scale&fm=avif)
Use Contentsquare’s AI Sense to quickly understand vast amounts of data
Which marketing analytics metrics to track
The metrics you’ll want to track depend on the stage of the marketing funnel you're measuring and which questions you’re trying to answer.
Category | Metrics to Track | What It Tells You | Key Consideration |
|---|---|---|---|
Acquisition & Reach | Click-Through Rate, Cost Per Acquisition, Return on Ad Spend, Traffic by Channel | How effectively you're reaching new audiences and what's driving acquisition | Use multi-touch attribution instead of last-click for a more accurate picture |
Engagement & Behavior | Bounce Rate, Scroll Depth, Click Rates | What users do once they arrive on your site or app | High-level metrics can be misleading without additional context |
Conversion & Revenue | Conversion Rate by Channel/Campaign, Revenue per Visitor | Which marketing efforts are paying off and how they connect to business outcomes | Conversion data alone won't tell you why users aren't converting |
Retention | Retention Rate, Customer Lifetime Value (CLV) | How well you're holding onto customers and how much each is worth | Retention metrics lag; track early engagement signals to spot churn risks before they show up in the numbers |
Here’s a breakdown by category:
Acquisition and reach metrics tell you how effectively you’re reaching new audiences. Track click-through rate to measure ad and content relevance, cost per acquisition to understand what you’re paying to win each customer, return on ad spend to evaluate revenue return on ad spend, and traffic by channel to see which sources are doing the heavy lifting. Attribution can be tricky here, so use a multi-touch attribution model rather than defaulting to last-click. This gives you a more accurate picture of what’s driving acquisition.
Engagement and behavior metrics show you what users do once they arrive on your site or app. Bounce rate tells you whether visitors are sticking around, scroll depth reveals how far users scroll, and click rates tell you what elements users interact with. Keep in mind that these high-level engagement metrics can be misleading without additional context. For example, a high bounce rate doesn’t always mean users aren't engaged (maybe they found what they needed right away).
Conversion and revenue metrics connect your marketing activity to business outcomes. Conversion rate by channel and campaign tells you which efforts are paying off, while revenue per visitor helps you understand your overall sales efforts. Keep in mind that conversion data alone won’t tell you why users aren’t converting.
Retention metrics measure how well you’re holding onto your customers. Track retention rate, which signals loyalty and satisfaction, and customer lifetime value to understand how much a single customer is worth (so you can manage acquisition costs). Retention metrics can lag, because once the numbers dip, you’ve already lost the customer. Focus on tracking early signals like engagement trends to help you spot churn risks before they affect your retention rates.
Easily track the metrics that matter most to you with Contentsquare Dashboards. Set up one or multiple dashboards to display the numbers you need.
Monitor metrics in one place using Dashboards
Finding the best marketing analytics tool
Knowing your metrics is only half the equation. The other half is having a tool that can actually collect the data you need.
The best marketing analytics tools don’t just collect metrics. They layer in behavioral data (to give you the ‘why’) and use machine learning to provide future forecasts and analysis to help everyone on your team better understand the story behind your data.
When evaluating tool options, look for a tool that:
Connects behavior to revenue so you can quantify the business impact of friction points in your funnel
Tracks users across devices and channels (like Contentsquare’s Journeys) because customer journeys are rarely neat, and you need a tool that tracks users across different touchpoints to give you the full picture
Uses AI to surface insights so your team spends less time digging through dashboards and more time acting on insights
Incorporates data visualization capabilities so you can easily make sense of large datasets
The goal is to find a tool that closes the loop from 'here’s what’s happening' to 'here’s why and how to fix it.'
FAQs about marketing analytics
Marketing analytics is the practice of collecting, measuring, and analyzing data from your marketing activities to understand what’s working, what isn’t, and what’s needed to reach your goals. It covers everything from campaign performance and traffic sources to user behavior and revenue impact.
![[Visual] Contentsquare's Content Team](http://images.ctfassets.net/gwbpo1m641r7/3IVEUbRzFIoC9mf5EJ2qHY/f25ccd2131dfd63f5c63b5b92cc4ba20/Copy_of_Copy_of_BLOG-icp-8117438.jpeg?w=946&q=85&fit=scale&fm=avif)