![[Visual] Group or team](http://images.ctfassets.net/gwbpo1m641r7/32JzPMpv2HCcGRrdmakrvx/c7467f340be42d9d1fdc2d0fcf79d2d6/Neurodiversity__4___1_.png?w=946&q=85&fit=scale&fm=avif)
Your product isn’t a black box, or at least it shouldn’t be. Every click, scroll, error, and abandoned flow is a clue about what’s working and what’s sending users away.
Product monitoring is how you keep tabs on what’s actually happening inside your product. It covers the technical side, such as load times, crashes, and errors, as well as the human side: where users click, pause, get stuck, and leave. Knowing your site crashed is useful. Knowing why users bounced before they got there is better.
Think of product monitoring as a health check and behavioral report card rolled into one. It shows whether a new release is working as planned, flags technical problems before they become bigger issues, and maps the real customer journey, not the neat version designed in Figma. With that insight, you can improve the digital experience in ways that matter to users, not just to your roadmap.
In 2026, more of the customer journey happens across websites and mobile apps, and patience for friction is wearing thin. We spoke with product experts across industries to build this list of the best product monitoring tools, so you can compare what each one monitors, which teams it suits, and which metrics are worth watching.
The tools below fall into two groups:
6 product usage monitoring tools to help you understand user behavior and identify product usability issues
6 product health monitoring tools to help you assess technical performance, including loading speed, bugs, and errors
Key insights
Product monitoring splits into two jobs: product usage monitoring (how people behave, adopt features, and get stuck) and product health monitoring (errors, crashes, and performance). Strong teams cover both.
No single tool does everything, so most teams pair a usage tool with a health tool—or consolidate both jobs in one platform to avoid stitching data together by hand.
The best product monitoring tools turn raw signals into action: they show cross-functional teams where users struggle and why, so product, engineering, and design can prioritize the same fixes.
Product monitoring tools comparison table
Tool | Primary focus | What it monitors | Best for |
|---|---|---|---|
Contentsquare | Product usage and product health | User behavior, feature adoption, journeys, session replay, feedback, errors, performance, and business impact | Cross-functional teams that want usage and health signals in one platform |
Amplitude Analytics | Product usage | Events, user paths, feature adoption, retention, and experiment outcomes | Product teams focused on adoption, engagement, and retention |
FullStory | Product usage and digital experience | Customer journeys, session replay, heatmaps, and frustration signals | Teams investigating usability issues through real user behavior |
Mixpanel | Product usage | User segments, funnels, paths, retention, and experiment outcomes | Product teams that need detailed event and cohort analysis |
UXCam | Mobile product usage and health | Mobile sessions, screen flows, crashes, logs, and UI freezes | Mobile app teams investigating usability and app performance |
Smartlook | Product usage | Session recordings, heatmaps, events, funnels, and user paths | Web and mobile teams analyzing behavior across platforms |
Sentry | Product health | Front-end errors, back-end errors, stack traces, and application events | Engineering teams focused on error tracking and debugging |
LogRocket | Front-end health and usage | Front-end performance, browser issues, session replay, and user paths | Teams investigating front-end problems through user sessions |
Bugsnag | Application health | Crashes, error trends, release stability, and application health scores | Teams prioritizing bugs and monitoring release health |
Grafana | Observability and product health | Logs, metrics, application behavior, and back-end issues | Technical teams that need flexible, customizable dashboards |
Datadog | Application, infrastructure, and product health | Logs, metrics, traces, traffic flows, front-end performance, and errors | Engineering and operations teams monitoring complex systems |
CloudWatch | AWS application and infrastructure health | Logs, metrics, alarms, anomalous behavior, and error triggers | Teams running products and infrastructure on AWS |
6 product usage monitoring tools
Product usage monitoring tools help you understand how users navigate and interact with your product so you can spot usability issues and prioritize initiatives that improve the product and user experience (UX).
1. Contentsquare
Contentsquare (yours truly!) is a customer experience intelligence platform that helps you understand how users interact with your product, what keeps them engaged, and which areas need work.
Our all-in-one platform brings together behavioral analytics and an array of capabilities to give you a complete view of how people use and feel about your digital products. With those combined insights, product teams make smarter decisions and improve products faster—Trove, for example, saves 3,000+ development hours a year by leaning on Product Analytics to see what users actually do.
![[Visual] Dashboard conversion and bounce rate](http://images.ctfassets.net/gwbpo1m641r7/3F2OzaDIkGuM3m2tO3lV01/2514a7af51bc3524d9644f3f61ba86da/platform-overview-dashboard.svg?w=1140&q=85&fit=scale)
Contentsquare Dashboards make it easy for teams to access quantitative and qualitative data in one place
What Contentsquare monitors
Heatmaps: see which page elements attract attention, where engagement drops, and which content users ignore
Journey Analysis: follow the paths users take through your site or app, compare journeys, and find the steps where people drop off
Session Replay: watch recorded user sessions to understand the clicks, pauses, errors, and interactions behind a drop-off or conversion problem
Surveys: collect direct feedback from users at key moments, then use what they say to validate decisions and uncover unmet needs
Error Analysis and Speed Analysis: find JavaScript errors, API failures, slow pages, and other technical issues that can disrupt the user experience
Alerts: monitor important changes in performance and user behavior so your team can investigate issues as they emerge
Impact Quantification: estimate how specific issues affect conversions and revenue, helping teams prioritize fixes based on business impact
Sense: ask questions in plain language about user behavior, feedback, and performance, then surface patterns and identify where to investigate next
![[Visual] Sense-Analyst big](http://images.ctfassets.net/gwbpo1m641r7/2o2mRdIGzXfQpFndz97YYb/e8dc873fdadb87073c422f5922ab206f/Sense-Analyst__1_.png?w=1280&q=85&fit=scale&fm=avif)
Contentsquare's Sense Analyst in action
2. Amplitude Analytics
Amplitude Analytics is a product monitoring platform that gives product teams the audience insights they need to build customer-first products. It captures behavioral data—like user paths and in-app events—so you can better understand the user journey, measure customer engagement, and forecast behavior patterns over time.
![[Visual] amplitude analytics Anomaly Detection](http://images.ctfassets.net/gwbpo1m641r7/15G7iJBIIxuRPvcG0hwT0H/db60faf307887a931e066f4a4a9e58ec/amplitude-analytics.png?w=946&q=85&fit=scale&fm=avif)
Anomalous performance detection with Amplitude Analytics
What Amplitude Analytics monitors
Events: see what users do inside your app
User paths: visualize customer journeys, uncover the 'why' behind every action, spot where users drop off, and remove friction points to reduce churn
Users' reactions to product experiments: run A/B tests to track the effect of product changes on user experience
3. Fullstory
Fullstory is digital experience analytics software that collects quantitative and qualitative data to provide digital teams with a 360-degree overview of their users' product experience.
![[Visual] fullstory-product-monitoring](http://images.ctfassets.net/gwbpo1m641r7/4tyVOGDQZzNuDFmIc4Xhl1/2e1e6820d11f74cd53f199ff4f75fdfe/fullstory-product-monitoring.avif?w=946&q=85&fit=scale&fm=avif)
Fullstory's product performance dashboard
What Fullstory monitors
Customer journeys: discover how users interact with your product, step-by-step
Session insights: capture session recordings and heatmaps to see your users in action
Frustration signals: receive automatic alerts when users are about to churn based on events like rage clicks, error clicks, and thrashed cursors
💡 Pro tip: if you like Fullstory's session replays, you'll love how Contentsquare goes further with a comprehensive approach to user behavior—offering product insights, real-time monitoring, and direct user feedback all in one place.
🔍 Curious how Contentsquare and FullStory stack up? See what each tool does best and which one fits your team in our Contentsquare vs. FullStory comparison.
4. Mixpanel
Mixpanel is a mobile app and website monitoring tool. It answers important questions about how your product is used, returning and churning customers, and where people get stuck.
![[Visual] The Mixpanel dashboard displaying user paths](http://images.ctfassets.net/gwbpo1m641r7/3CexacRJ8B7FLxE5bVaaHh/fc115e46d727adde0147905111ad6bd7/The_Mixpanel_dashboard_displaying_user_paths.png?w=468&q=85&fit=scale&fm=avif)
The Mixpanel dashboard displaying user paths
What Mixpanel monitors
User segments: group users based on common factors and see how different cohorts behave in your product
User paths: see how people progress through your product to spot and fix user interface (UI) and UX issues
Product experiment outcomes: release new features and discover how your users respond to them
5. UXCam
UXCam is a dedicated mobile app experience analytics tool. The combination of user behavior analytics and product health monitoring makes it a good choice for cross-functional mobile app teams.
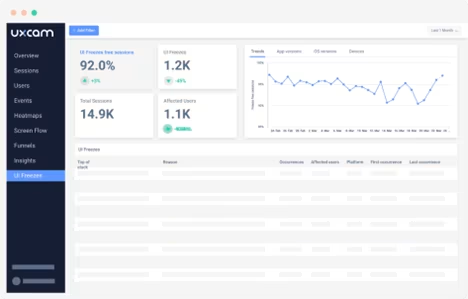
The statistics on UI freezes detected by UXCam
What UXCam monitors
Mobile user sessions: analyze session recordings and heatmaps to capture opportunities for improving your app's UI
Screen flows: identify top user flows throughout your product to reveal trends in user behavior
Logs and app crashes: see what happens in the back-end when users take actions, and set up alerts to learn about crashes, UI freezes, and bugs in real time
6. Smartlook
Smartlook is a user behavior analytics platform for web and mobile products. The tool tracks user behavior across several channels at once, allowing digital teams to build multi-platform funnels.
![[Visual] Session recordings captured by Smartlook](http://images.ctfassets.net/gwbpo1m641r7/33ylG5Ny7TxArEHOOogrfZ/4620ba785483d9f31af2f9d486822ee6/Session_recordings_captured_by_Smartlook.png?w=936&q=85&fit=scale&fm=avif)
Session recordings captured by Smartlook
What Smartlook monitors
Sessions: watch real user behavior with session recordings and heatmaps
Events: get statistics on all user actions, spot event anomalies, and measure new feature adoption
User paths: see whether users follow the paths you've designed for them, identify drop-off points, and optimize your app based on the data
6 product health monitoring tools
A slow loading speed, unresponsive servers, back-end and front-end errors—these are only a few examples of what can go wrong with your product without warning. Product health monitoring tools track performance issues, from error rates to Core Web Vitals, so you can resolve them before they result in customer churn.
1. Sentry
Sentry is a product monitoring platform popular among product teams, and for good reason—the platform is compatible with almost every framework and language.
![[Visual] Sentry’s Alerts dashboard](http://images.ctfassets.net/gwbpo1m641r7/6WHeiAiRvp5dkclXdUuUNw/3cb994d2559ea2c7b31b401606b8703d/Sentry_s_Alerts_dashboard.png?w=468&q=85&fit=scale&fm=avif)
Sentry's Alerts dashboard
What Sentry monitors
Front-end errors: reveal and reproduce front-end errors and see what might cause them
Back-end errors: trace how back-end code causes front-end errors, and vice versa
Events: visualize what's happening inside your app with event monitoring and custom dashboards
💡 If you're using Contentsquare
You've got powerful tools at your fingertips to monitor the health of your digital products. For example, if your product is experiencing errors—like slow page loads or technical glitches during checkout—our real-time Error Analysis capability flags them for you. This way, you can fix issues fast and prevent user frustration.
![[Visual] session error analysis](http://images.ctfassets.net/gwbpo1m641r7/5MXCaODldZPjy3mj2C2LfY/f6a2de7fb9f19ef9dc6de0eda9344433/session_error.avif?w=1280&q=85&fit=scale&fm=avif)
Contentsquare helps you surface both technical and non-technical errors on your sites and apps
2. LogRocket
LogRocket is product analytics software that focuses on spotting front-end issues.
![[Visual] The session statistics by LogRocket](http://images.ctfassets.net/gwbpo1m641r7/3ufBpFkD5AzLCggtq6uQEU/a59ee898df9b7495797820ed8bdb739b/The_session_statistics_by_LogRocket.png?w=936&q=85&fit=scale&fm=avif)
The session statistics by LogRocket
What LogRocket monitors
Front-end performance: monitor page load times, browser crashes, and other front-end aspects that might impact the user experience
Product analytics: learn everything you need to know about your active customers
User paths and sessions: watch session replays and analyze customer journeys to spot drop-offs and confusing UX
3. Bugsnag
Bugsnag is error monitoring and reporting software. If you struggle to assess your product health and prioritize tasks for your software team, Bugsnag helps by monitoring application stability in real time, and uses a stability score to automatically prioritize bugs.
![[Visual] bugsnag](http://images.ctfassets.net/gwbpo1m641r7/6MRZTI1ZRG4VMwPh2X8zLE/f59467e841c9a0e62f017f9ca3ccc0d7/bugsnag.png?w=946&q=85&fit=scale&fm=avif)
The Stability dashboard by Bugsnag
What Bugsnag monitors
Application stability: set up Bugsnag to track app stability against targets and receive alerts when stability drops
Error statistics: monitor error trends to discover how new releases affect application performance
Stability score: instead of reacting to every error, use the stability score as an indicator of whether you should spend time debugging or continue developing the product
4. Grafana
Grafana is an open-source analytics solution compatible with virtually every database. It's a sophisticated solution that doesn't work out of the box: connect it to your data storage and define which data you want to see, and Grafana will query and visualize it to give you full control over your product architecture.
![[Visual] Data visualization dashboard by Grafana](http://images.ctfassets.net/gwbpo1m641r7/2LMfCbi0zVKAxPsLAbzFJd/552074ed29199a1d32e8fc3e06057fb0/grafana.jpeg?w=946&q=85&fit=scale&fm=avif)
Data visualization dashboard by Grafana
What Grafana monitors
Logs: bring together logs from all your applications
Application behavior: measure the health of your product with Grafana's scores and dashboards
Back-end issues: trace everything happening in the back-end to understand the reasons behind technical errors and drop-offs
5. Datadog
Datadog is a multi-functional application performance monitoring platform. Similar to LogRocket, it monitors both user-level data and technical product performance, like front-end and back-end data.
![[Visual] datadog-monitoring](http://images.ctfassets.net/gwbpo1m641r7/5itqXDsvm2tRi0qsqMfLyA/78c76765501baef8b1a3711c7358ca82/datadog-monitoring.avif?w=946&q=85&fit=scale&fm=avif)
Datadog's Error Tracking dashboard
What Datadog monitors
Logs: automatically collect, visualize, and get alerts on log data
User experience: monitor key traffic flows to understand how people interact with your product and enhance your end-user experience
Front-end performance: track and visualize load times and front-end errors for every user session
💡 Pro tip: you can instantly visualize Datadog data in Grafana. If you use Datadog as a data source, you can pull data from there and build dynamic dashboards in Grafana. This integration is helpful when you want to blend data from multiple data sources.
6. CloudWatch
CloudWatch is an application and infrastructure monitoring solution for services running on Amazon Web Services (AWS) and on-premises.
![[Visual] CloudWatch-monitoring](http://images.ctfassets.net/gwbpo1m641r7/67JX2IAz68zfF6tb9DS331/1b5a3c01f93e9aeb3b7104530bc7a7f0/CloudWatch-monitoring.png?w=941&q=85&fit=scale&fm=avif)
Product performance visualization in CloudWatch
What CloudWatch monitors
Logs: monitor logs to perform event analysis and troubleshoot problems much faster
Anomalous behaviors: set standards to get notified when your product doesn't perform as expected
Error triggers: along with receiving alerts on application errors, you'll see the reasons behind arising issues
How to choose a product monitoring tool
Now that you've seen what's out there, take a step back and get clear on what you actually need to monitor. The right tool depends on your team's priorities, your product's complexity, and the gaps in your current setup. A few criteria to weigh:
Coverage: does it track product usage, product health, or both? Teams that watch only one side miss half the picture.
Depth of insight: look beyond dashboards for session replay, journey analysis, and error context that explain why something happened, not just what.
Cross-functional access: product, engineering, design, and marketing should work from the same data without a technical setup for every question.
Real-time alerts: anomaly detection and alerts help you catch issues before they reach users.
Integrations: it should connect to the tools your team already uses, from data warehouses to messaging apps.
If juggling several tools feels like too much, look for a platform that unifies usage and health signals so you're not piecing data together manually.
Find the product monitoring tool that fits your team
Different product monitoring tools track and analyze different metrics and behaviors, so staying on top of your product's performance usually means combining a few solutions.
We suggest choosing at least one product usage monitoring platform and one product health monitoring tool from this list—or just using Contentsquare to get both in one platform. With usage and health signals unified, errors show up right inside session replay and technical issues are tied to their business impact, so cross-functional teams work from one source of truth instead of stitching separate tools together.
For the bigger picture, explore our product monitoring guide and its related chapters to see what users do, where they hit roadblocks, and how to improve their experience.
FAQs about product monitoring tools
Product monitoring is the process of tracking product performance to assess both its technical state and user-level data. It helps product teams promptly spot and resolve back-end and front-end errors, identify usability issues, and make informed decisions on product optimization.
![[Visual] Contentsquare's Content Team](http://images.ctfassets.net/gwbpo1m641r7/3IVEUbRzFIoC9mf5EJ2qHY/f25ccd2131dfd63f5c63b5b92cc4ba20/Copy_of_Copy_of_BLOG-icp-8117438.jpeg?w=946&q=85&fit=scale&fm=avif)

![[Visual] AI analytics home - stock](http://images.ctfassets.net/gwbpo1m641r7/64i3HakmQ9aHWYWEEqpFUM/f1d5d2a41b5c7d7a523a34b58bd50ece/AdobeStock_634961399.png?w=624&q=85&fit=scale&fm=avif)