![[Visual] AI analytics home - stock](http://images.ctfassets.net/gwbpo1m641r7/64i3HakmQ9aHWYWEEqpFUM/f1d5d2a41b5c7d7a523a34b58bd50ece/AdobeStock_634961399.png?w=1280&q=85&fit=scale&fm=avif)
Every abandoned cart tells the same story: someone was close enough to buying to put a product in their basket, but something changed before they reached the finish line.
Sometimes it's an unexpected shipping fee. Sometimes it's a slow checkout, mandatory account creation, or a moment of hesitation that sends shoppers elsewhere. Whatever the reason, those lost purchases add up quickly—and understanding where and why people abandon their carts is the first step toward recovering more of them.
These cart abandonment statistics for 2026 bring together the latest benchmarks, trends, and research to help you compare your performance, uncover common sources of friction, and prioritize the improvements that have the biggest impact on conversions.
Key insights
The global cart abandonment rate sits at 70.22% in 2026—roughly 7 in 10 shopping carts never convert, representing $260 billion in recoverable revenue for US and EU retailers.
Mobile drives most ecommerce traffic but loses the most carts—mobile accounts for 73% of ecommerce sessions, yet its abandonment rate (80%) dwarfs desktop (65-67%) due to small screens, slow forms, and missing one-tap payments.
Checkout friction is the most fixable cause of lost sales—optimizing the checkout process by cutting form fields from 15 to 7 lifts completion by 30%, guest checkout boosts conversions by 34%, and digital wallets reduce mobile abandonment by 35%.
What is cart abandonment rate?
Cart abandonment rate measures the percentage of online shoppers who add items to their cart but leave without completing a purchase. It's a direct indicator of how well your checkout experience converts interest into revenue.
The formula is straightforward:
Cart abandonment rate = 1 - (completed purchases / carts created) x 100
If 1,000 users add items to their cart and 300 complete a purchase, your abandonment rate is 70%.
One important distinction: cart abandonment and checkout abandonment aren't the same metric. Cart abandonment captures everyone who adds an item but doesn't buy, including users who were browsing or saving items. Checkout abandonment is narrower. It tracks only users who enter the checkout flow and then leave, so rates tend to run lower (typically 25-40%).
Average cart abandonment rate in 2026
The average shopping cart abandonment rate reached 70.22% in 2026, according to the latest Baymard Institute and Statista data. Depending on the study, published figures range from 70% to 78%.
The takeaway stays the same: roughly 7 out of every 10 carts never convert.
This isn't a new problem. Cart abandonment rates have climbed steadily since researchers first tracked them in 2006, when the average hovered around 59%. The upward trend reflects growing mobile shopping, rising consumer expectations, and the ease of comparison shopping across tabs and devices.
The revenue impact is staggering. Baymard estimates that $260 billion in lost orders are recoverable for US and EU retailers through better checkout design and targeted recovery campaigns. That's not total lost revenue. It's the share that improved user experience alone could recapture.
Put it into practice: Benchmark your cart abandonment rate against the 70.22% average. If you're significantly above it, prioritize the checkout friction fixes covered later in this article.
Cart abandonment rates by industry
Abandonment rates vary widely by industry. Products that require more research, carry higher price points, or involve complex booking flows see higher drop-off. According to Geysera, here's how industries compare in 2026:
Industry | Abandonment rate |
|---|---|
Travel | 87% |
Fashion | 84.6% |
Luxury goods | 82.8% |
Beauty & personal care | 80.9% |
Retail (general) | 72.2% |
Consumer electronics | 72% |
Grocery | 50% |
Travel leads the pack at 87% because users frequently compare flights and hotels across multiple sites before committing. Fashion and luxury follow closely. Shoppers often add items to see total costs with shipping, or they're curating wish lists without any immediate intent to buy.
Grocery sits at the opposite end at 50%. These purchases are routine, price points are lower, and delivery windows create natural urgency. If your rate sits above 75%, that's not necessarily a red flag. It may reflect normal browsing behavior for your category. The real signal is how your rate compares to direct competitors and how it trends over time.
Put it into practice: Compare your rate to your specific industry, not the global average. A 75% abandonment rate in travel is strong; the same rate in grocery signals a problem.
Cart abandonment rates by device
Mobile devices generate 73% of all ecommerce traffic, but they also produce the highest abandonment rates. The mobile shopping cart abandonment rate sit at around 80%, compared to 65-67% on desktop and roughly 70% on tablet.
Why the gap? Three factors dominate:
Small screen form friction:
checkout forms squeeze onto smaller displays, making data entry slow and error-prone
Inconsistent autofill:
autofill works unpredictably across mobile browsers, forcing manual re-entry of addresses and payment details
Lower purchase intent:
users browse on mobile during idle moments with less commitment than someone sitting at a desktop
💡Pro tip: leverage Contentsquare’s Error Analysis tool to identify the hidden issues behind cart abandonment.
From broken links to API errors, this tool highlights exactly where users encounter errors, helping you fix trust-damaging glitches before they drive customers away.
Pair it with session replay insights to see the story behind each error—because every crash or bug you resolve brings you one step closer to a seamless, secure checkout experience.

As revealed in The 2026 Digital Experience Benchmark Report and Interactive Explorer, our latest annual survey of the digital customer experience, desktop converts at 3.4%—74% higher than mobile web. That conversion gap underscores how much revenue sits on the table for teams that fix their mobile checkout experience.
The challenge is that mobile friction doesn't show up in aggregate analytics. A user struggling to type their address into a poorly sized input field, rage-tapping an unresponsive button, or pinching to zoom on a payment form—those are behavioral patterns you can only catch by watching real sessions. That's why teams focused on mobile conversion need a way to observe actual checkout behavior on small screens, not just track click-through rates.
💡Pro tip: Contentsquare's Session Replay lets you watch real mobile checkout sessions and filter by sessions that include cart activity but no purchase. Look for patterns like repeated form interactions or rage clicks on specific elements—those patterns point directly to the fields and steps that need a redesign.
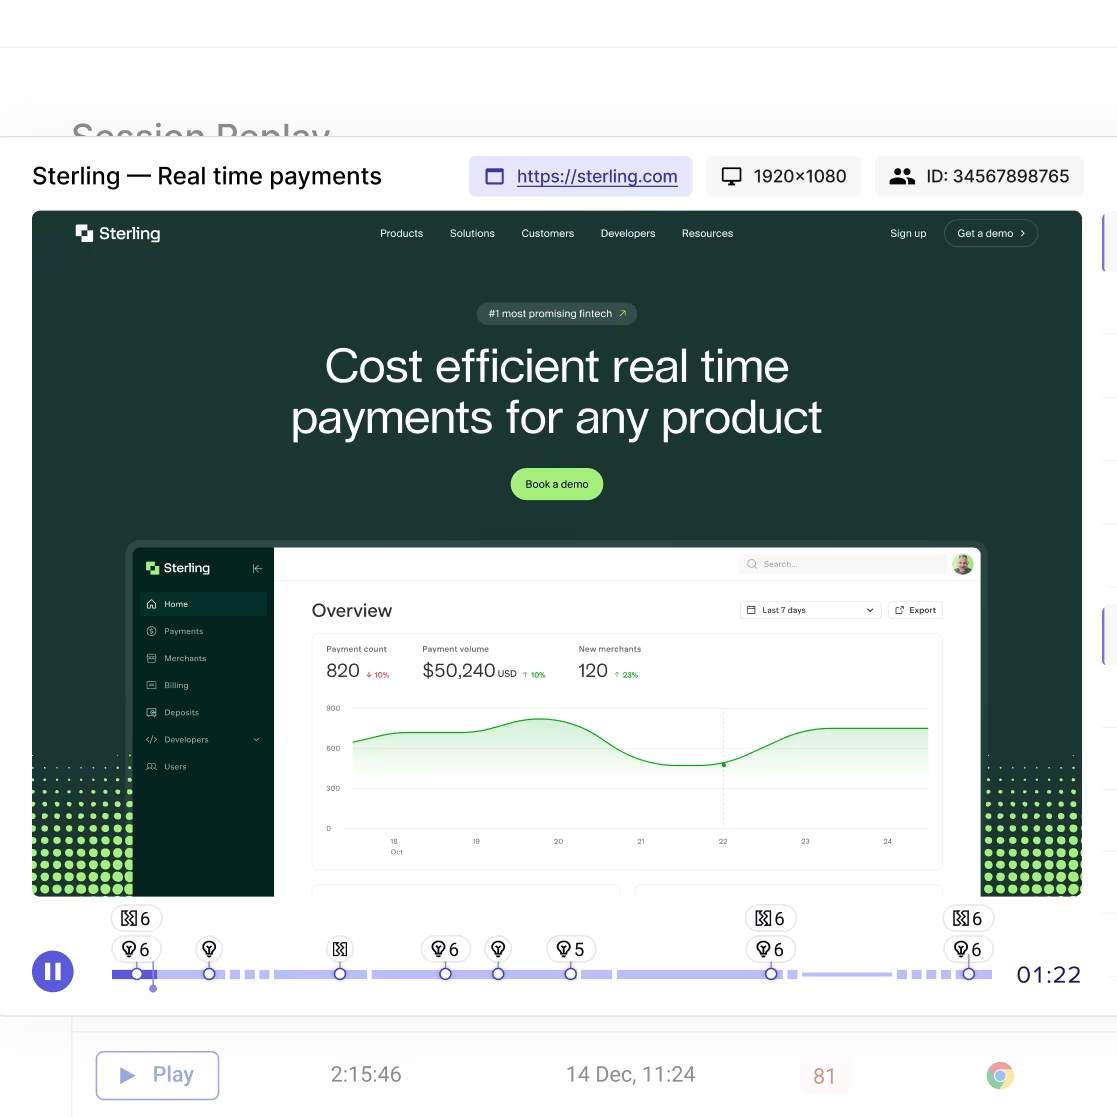
Contentsquare’s Session Replay tool in action
Top reasons shoppers abandon their carts
Understanding why customers abandon shopping carts is the first step toward bringing them back. According to Baymard Institute, here are the 6 most common reasons, ranked by how often shoppers cite them:
Unexpected costs (39%):
these extra costs, such as shipping fees, taxes, or handling charges that appear late in checkout are the single biggest driver. Users feel blindsided when the final price jumps from what they expected.
Forced account creation (19%):
requiring registration before purchasing adds friction and time. Many shoppers won't create yet another account just to buy a single item.
Slow delivery (21%): when estimated delivery times don't meet expectations, users look elsewhere. This is especially true for time-sensitive purchases.
Lack of trust (19%): missing security badges, unclear return policies, or an unfamiliar brand make users hesitant to enter payment details.
Complicated checkout (18%): too many steps, confusing navigation, or redundant form fields exhaust user patience. The longer checkout takes, the more likely users are to leave.
Limited payment options (10%): users expect their preferred payment method. Not offering digital wallets, buy now pay later, or local payment methods costs conversions.
Checkout optimization benchmarks
The good news: checkout abandonment rate responds well to targeted fixes. Here's what the data shows for 4 specific optimizations:
Reducing form fields:
the average checkout has 11.3 form field —Baymard research shows cutting unnecessary fields can reduce abandonment by 20-60%
Single-page or streamlined checkout:
a complicated checkout experience causes 22% of shoppers to abandon—fewer steps directly improves completion
Offering guest checkout:
+34% conversions—one of the single highest-impact changes you can make
Adding digital wallets (Apple Pay, Google Pay):
cuts mobile checkout time from 2+ minutes to 12 seconds, removing the biggest source of mobile friction
Each of these changes addresses a specific pain point from the list above. Fewer fields reduce time and effort. Guest checkout removes the registration barrier. Digital wallets eliminate manual data entry on mobile entirely.
Put it into practice: identify which checkout step loses the most users on your site. Contentsquare's Funnel Analysis tracks drop-off rates at each stage of your checkout flow, so you can see whether users leave at the shipping page, the payment form, or the final confirmation—and prioritize your fix accordingly.
![[visual] Analyzing conversion funnels in Contentsquare](http://images.ctfassets.net/gwbpo1m641r7/767L9TFaw4HywMT1hhwR7/7fa8b800af4ba8a11b55314844fe31ae/analyzing-conversion-funnel.png?w=1280&q=85&fit=scale&fm=avif)
Cart abandonment recovery benchmarks
Not every abandoned cart is a lost sale. Recovery campaigns can recapture a meaningful share of that revenue, but effectiveness varies sharply by channel.
Recovery channel | Open / engagement rate | Conversion rate |
|---|---|---|
Abandonment email | 44.7% open rate | 10.7% |
SMS recovery | 98% open rate | 15-20% |
AI-powered email | — | 8.17% (roughly 2x standard) |
Exit-intent popups | — | 10-15% |
Abandonment emails and SMS each have a strong case in 2026, and the data depends on what you're optimizing for. SMS delivers a near-universal 98% open rate and converts at 15-20% per message—faster and higher per-message than email. Email converts at 5-10%, but its richer format—product images, pricing, direct cart links, and AI-personalized recommendations—makes it more persuasive for higher-consideration purchases and easier to scale at volume. AI-driven recovery emails push conversion to 8.17%, roughly 2x standard templates. Exit-intent popups convert at 10-15% by catching users at the exact moment they're about to leave.
The most effective approach combines all three. Send an immediate exit-intent offer, follow up with SMS within 1-2 hours for speed, and deploy a personalized email sequence over the next 24-72 hours for depth.
Buy now, pay later impact on abandonment
Buy now, pay later (BNPL) options are proving to be a powerful lever for reducing cart abandonment, particularly for higher-value purchases. According to Digital Applied, offering BNPL reduces abandonment by 20% for orders over $100. The effect is even stronger among younger shoppers, where ages 18-34 see a 29% reduction.
One-tap payment methods reduce mobile abandonment by 35%. The common thread is simple: any checkout optimization that removes steps or typing on mobile screens has an outsized impact on completion rates.
Put it into practice: if your average order value exceeds $100, adding BNPL at checkout should be a priority. Pair it with digital wallet support to cover both payment flexibility and speed.
How to diagnose cart abandonment on your site
Industry benchmarks tell you where you stand. Diagnosing why your specific users abandon carts is what drives actual improvement.
In our recent Benchmarks Report, the data paints a clear picture of the current landscape: conversion rates dropped 5.1% year over year, even as average order value (AOV) rose 6% and revenue per visit (RPV) ticked up 1%. Users are spending more per order but converting less often. That's a signal that friction, not demand, is the bottleneck.
The pattern from our Benchmarks data is clear: the brands that win aren't replacing lost traffic. They're building on the relationships they already have—understanding intent earlier, reducing friction relentlessly, and designing journeys that earn not just the current session, but the next one too.
🔥 If you're using Contentsquare:
Start by mapping where users drop off in your purchase funnel. Contentsquare's Journey Analysis visualizes how users move through your site page by page, tracking up to 7 navigational steps so you can pinpoint the exact pages where potential buyers exit.
![[Visual] Journey analysis - Exitanalysis 2](http://images.ctfassets.net/gwbpo1m641r7/3BQeOO8Q7TJ4wcfhWTB8jq/5eb3b4473b8a763b39ccc79c20e4ace1/Journey_analysis_-_Exitanalysis_2.png?w=1280&q=85&fit=scale&fm=avif)
Once you've identified the high-drop-off points, dig into the why. Session Replay lets you watch recordings of real user sessions, complete with AI-powered summaries and detailed event streams, to see exactly what happened before someone left. You can also use Heatmaps to see which checkout elements attract attention and which get ignored—revealing design issues that aggregate data alone won't surface.
![[Visual] Session Replay Summaries](http://images.ctfassets.net/gwbpo1m641r7/74IMQIqR0Nd8iczoJiyvVt/c901d2822dd5b9359fb1c8ac744932e4/Session_replays_summaries.png?w=983&q=85&fit=scale&fm=avif)
For teams that want to surface friction without manually reviewing sessions, Sense lets you ask analytics questions in plain language. It automatically runs deeper AI-powered analyses to highlight the most impactful issues, giving you direct answers about what's blocking conversions and where to focus.
![[visual] Run expert analysis on autopilot with Sense Analyst](http://images.ctfassets.net/gwbpo1m641r7/3dop01rRpadtOr6TYuMUhx/1f4534223c56497068536d1384326fcf/Contentsquare-AI-vs-competitors.png?w=1280&q=85&fit=scale&fm=avif)
The goal is a closed loop: identify the drop-off point, understand the behavior behind it, fix the friction, and measure the impact. That's how you move from knowing the cart abandonment rate statistics to actually improving them.
Next steps
Benchmark your current cart abandonment rate against your industry average using the tables above, then track it monthly to spot trends early. Start with our cart abandonment guide for a complete framework.
Audit your mobile checkout experience for the top friction points: form field count, payment options, and page load speed. Prioritize fixes that address the 48% of users who leave over unexpected costs. See our ecommerce conversion funnel guide for a step-by-step approach.
Set up a multi-channel recovery campaign combining exit-intent popups, SMS, and AI-personalized abandonment emails to recapture lost revenue. Our guide to reducing cart abandonment covers proven recovery tactics in detail.
FAQs about cart abandonment stats
Cart abandonment happens when a shopper adds items to their online cart but leaves without completing the purchase. It’s a natural part of online shopping, but high cart abandonment rates can signal bigger problems and lead to lost revenue.

![[visual] Whether you're starting an ecommerce business or want to increase your online sales, this comprehensive ecommerce guide will set you up for success.](http://images.ctfassets.net/gwbpo1m641r7/2oBR41ta2zGySqne7QEG0t/9e2a6804af71c5da0fe8f51e71f36e93/ecommerce.jpg?w=624&q=85&fit=scale&fm=avif)
![[Stock] 3 tips for your experimentation strategy](http://images.ctfassets.net/gwbpo1m641r7/7rzAn0l1w7lrnyGqqbPQsX/fc7b3d311b738d81ead59cb6144fa3f2/Copy_of_Why_you_need_to_host_an_anxiety_party__1_.png?w=624&q=85&fit=scale&fm=avif)