![[visual] laptop on table with glass of water and books](http://images.ctfassets.net/gwbpo1m641r7/4kNCDkZuHxWka96yJb0Jmp/e20ae24e493e7473cdda1fc5c92a069b/BLOG-website-feedback-tools-3987020.jpeg?w=946&q=85&fit=scale&fm=avif)
A dashboard can tell you that conversions dropped. It can't always tell you what happened between the landing page and the exit. Digital experience analytics (DXA) tools fill in that gap by combining behavioral signals such as clicks, scrolls, journeys, session replays, and feature usage to show where people get stuck, what they ignore, and which parts of an experience are actually working.
Different platforms answer different questions: some are built around product analytics and retention, others specialize in session replay and experience diagnostics, while broader platforms bring multiple sources of behavioral data into one view.
The right combination depends on whether you're trying to find UX friction, understand product adoption, diagnose a drop in conversion, or connect individual user actions to larger business outcomes.
Below, we break down eight essential digital experience analytics tools and the capabilities that make each one useful.
Key insights
DXA goes beyond telling you what happened. Web analytics can show that conversions fell, but behavioral data such as journeys, session replays, heatmaps, and frustration signals can help uncover what users did before they dropped off and where the experience broke down.
No single DXA capability answers every question. Journey tracking shows where users go, segmentation reveals which groups behave differently, session replay exposes individual friction, and experimentation tells you whether a change actually improved the experience.
Context makes behavioral data more useful. Combining user behavior with technical performance, feedback, or business metrics can help teams connect an issue such as a slow page or confusing form to its actual impact on conversions, complaints, or revenue.
AI is changing how teams investigate digital experiences. Instead of manually searching dashboards for anomalies, AI-powered analytics can surface patterns, answer questions in natural language, and identify potential problems that teams might not think to investigate themselves.
The best tool depends on your environment, not just its feature list. Data collection, integrations, mobile support, pricing, privacy requirements, and the amount of analysis your team can realistically handle all matter when evaluating a DXA platform.
Digital experience analytics tools at a glance
The table below compares eight leading DXA platforms to help you shortlist the right fit for your team.
Platform | Best for | Key strength | Pricing |
|---|---|---|---|
Contentsquare | Comprehensive experience analytics | All-in-one platform combining behavioral analytics, AI-powered insights, Session Replay, Heatmaps, and Frustration Score | Free plan; custom pricing for Growth, Pro, and Enterprise |
Fullstory | Session replay and autocapture | Digital experience intelligence with tagless capture and frustration signals | Free plan (30,000 sessions/mo); custom pricing for paid tiers |
Amplitude | Product analytics and experimentation | Deep product usage analytics with robust A/B testing and cohort analysis | Free plan; Plus from $49/mo; Growth and Enterprise custom |
Quantum Metric | Enterprise digital experience management | Real-time quantification of experience issues tied to business impact | Custom pricing, no public rates |
Glassbox | Mobile app analytics | Mobile-first experience analytics with strong compliance features | Custom pricing, no public rates |
Medallia | Voice of customer and feedback analytics | Combines experience signals from surveys, social, and digital interactions | Custom pricing, no public rates |
Mixpanel | Event-based product analytics | Flexible event tracking with powerful segmentation and funnel analysis | Free plan (1M events/mo); Growth usage-based; Enterprise custom |
Microsoft Clarity | Free session replay and heatmaps | No traffic or recording limits, with AI session summaries, at zero cost | Free, no paid tier |
8 best digital experience analytics tools
Each platform takes a different approach to DXA—some lean heavily into session replay, others into product analytics, and a few try to do everything at once. The sections below break down eight essential tools, what makes each one useful, and the trade-offs you'll actually encounter when you start using them.
1. Contentsquare
Contentsquare is an all-in-one experience intelligence platform that shows how people actually move through a site or app, not just what the aggregate numbers did. It captures behavior without tagging, so you can investigate questions you didn't plan for before the data was collected.
![[visual] Zoning analysis in Contentsquare](http://images.ctfassets.net/gwbpo1m641r7/4YmUJ6T747sHKR7qGinoNo/72718581ca4db578f27a2840fcf4f6f8/Contentsquare-vs-Dynatrace-zoning-heatmap.jpeg?w=1280&q=85&fit=scale&fm=avif)
It's built for teams who need to see the full picture—not just what dropped, but why. Analysts use it to size the impact of a conversion dip. UX teams dig into session replays to understand why a checkout page confuses people. Product managers check whether last week's release actually changed how users navigate the site. And if you're running a large, multi-step experience across dozens of pages, Advanced Journey Analytics lets you track behavior across sessions and touchpoints, so you can spot where users abandon a flow days after they started it.
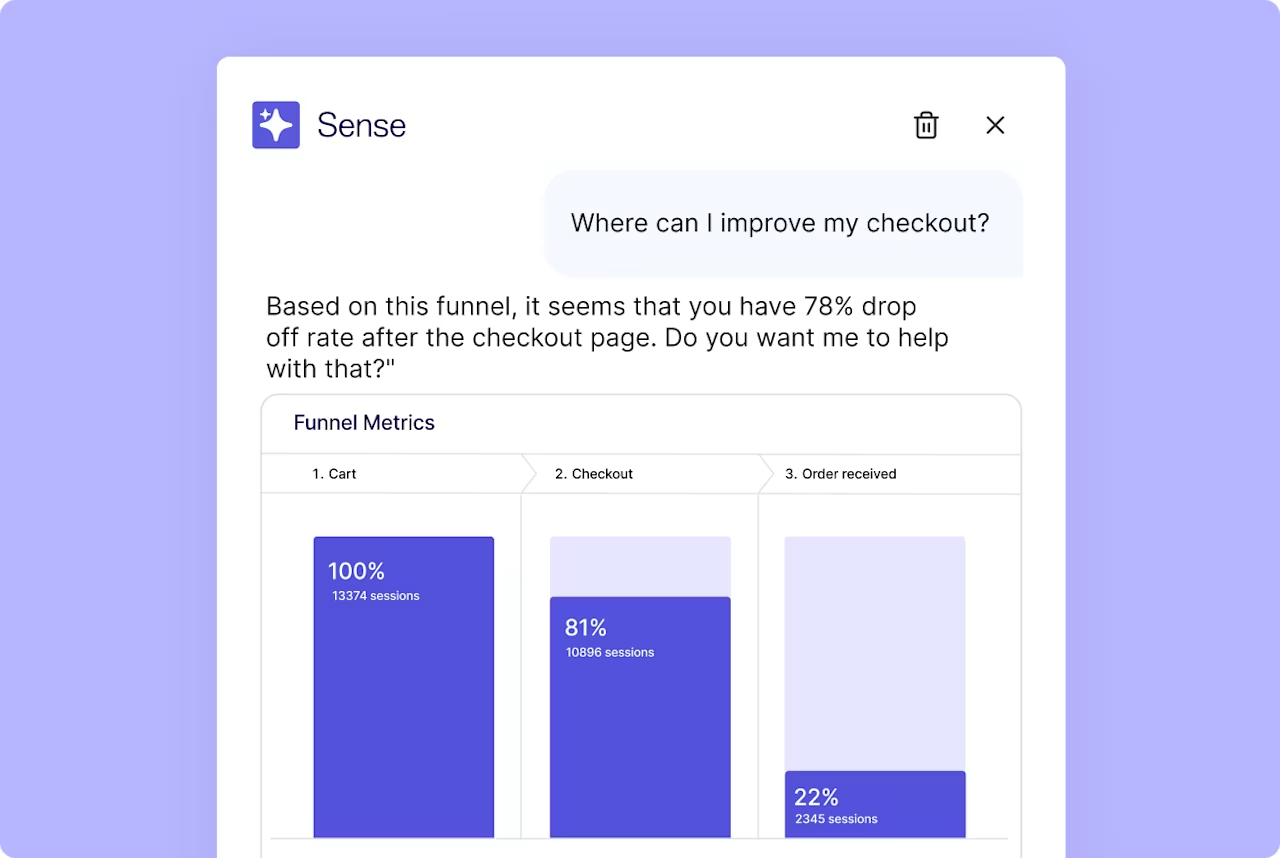
What ties it all together is Sense and Sense Analyst—AI-powered capabilities that work across the platform. Instead of manually building dashboards or hunting for patterns, you can ask questions in natural language and get answers pulled from session replays, heatmaps, journeys, and performance data. Sense surfaces insights automatically, flagging anomalies and friction points you might not think to investigate. Sense Analyst goes further, acting as an on-demand analytics partner that interprets behavioral data, explains what's happening, and suggests where to look next. It means less time searching for problems and more time fixing them.
Highlights
Watch how users move through your pages with Session Replay, including a searchable event stream to jump to errors and friction
See which elements earn attention and which get ignored with Heatmaps, broken down zone by zone
Map real paths and quantify drop-off with Journey Analysis and Funnel Analysis
Diagnose forms field by field with Form Analysis, including drop rate, blank rate, and refill rate
Surface struggling sessions automatically with a Frustration Score built from rage clicks, JavaScript errors, and form resubmissions
Connect technical performance to behavior with Speed Analysis, tracking Core Web Vitals from real sessions
Understand what users say and why they contact support with Conversation Intelligence that lets you analyze chat and voice interactions at scale
Ask questions in plain language and get AI-powered analysis back with Sense
Translate experience issues into business impact with Impact Quantification, estimating the revenue or conversion cost of friction points
Pricing: Free plan; custom pricing for Growth, Pro, and Enterprise
🎥 Real-world example
Premium chocolatier Hotel Chocolat's Contact Us form was confusing users and generating unnecessary submissions. Using Heatmaps and Form Analysis, the UX team pinpointed where people dropped off, then tested improvements to color contrast, numbered steps, and FAQ visibility, producing a smoother form and fewer complaints.
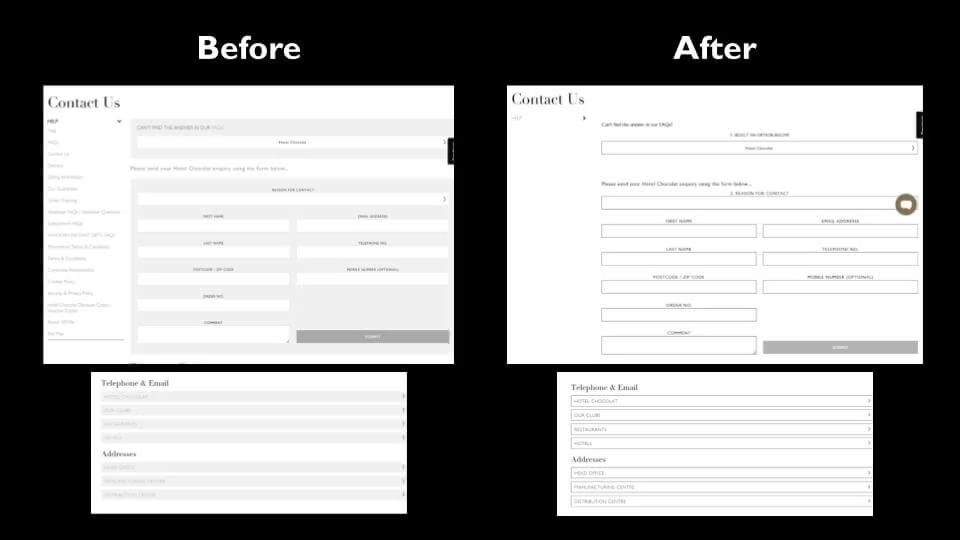
Hotel Chocolat's 'Contact Us' form before (left) and after (right) optimization
2. Fullstory
Fullstory is a digital experience intelligence platform built around autocapture. It records sessions and events without manual instrumentation, then lets you search retroactively for behaviors you didn't define in advance.
It's a common choice for teams whose primary need is session replay with strong search, and whose analysts are comfortable building their own definitions on top of raw captured data.
Highlights
Tagless autocapture, so events can be defined after the fact
Session replay with detailed search and segmentation
Frustration signals including rage clicks, dead clicks, and error clicks
Free tier is genuinely usable at 30,000 sessions a month with 12 months of retention
No published pricing above the free tier, so budgeting requires a sales conversation
Pricing: Free plan (30,000 sessions/mo); custom pricing for paid tiers
💡 Pro tip: Segmentation in Contentsquare applies across your analyses, not just your recordings. Build an unlimited number of custom segments, then apply them to heatmaps, journeys, and funnels to see how mobile users behave differently from desktop, or how first-time visitors compare to returning customers, without rebuilding the query each time. Segments are also retroactive, so a segment you create today shows you historical data that matches it.
![[Visual] Segmentation segments](http://images.ctfassets.net/gwbpo1m641r7/6AicsoldoxudeD1oF786iJ/ae111191cd248700358a8d2cfe339ee7/Segmentation.png?w=1280&q=85&fit=scale&fm=avif)
3. Amplitude
Amplitude is a product analytics platform focused on how users adopt and retain features over time. Its strength is cohort and funnel analysis across long time horizons rather than page-level diagnosis.
It fits product teams with a defined event taxonomy and someone to maintain it. If you want to know whether a feature drove retention, Amplitude answers that well. If you want to know why a specific page confuses people, it's the wrong starting point.
Highlights
Deep behavioral cohorts and retention analysis
Built-in experimentation and feature flags
Session replay available alongside the analytics
Free Starter tier, with Plus at a published price rather than quote-only
Event-based model requires upfront instrumentation and ongoing taxonomy maintenance, and costs scale with monthly tracked users
Pricing: Free plan; Plus from $49/mo; Growth and Enterprise custom
4. Quantum Metric
Quantum Metric is an enterprise platform built around quantifying experience issues in real time and tying them to revenue impact. Its positioning is speed of detection: surfacing an anomaly and its business cost while it's still happening.
It's aimed squarely at large retail, travel, and financial services teams with dedicated analytics headcount, and it's rarely the right fit for a small team.
Highlights
Real-time anomaly detection with quantified business impact
Autocapture across web and mobile
Agentic AI features for surfacing issues without manual querying
Strong fit for high-traffic enterprise ecommerce and banking
No self-serve option, no free tier, and no published pricing
Pricing: Custom pricing, no public rates
5. Glassbox
Glassbox specializes in session capture with a heavy emphasis on mobile apps and regulated industries. Its differentiator is the depth of its data masking and compliance controls.
It's most often chosen by financial services and insurance teams whose blocker isn't analytics capability but whether the tool can be approved by legal and security.
Highlights
Mobile-first capture with native app support
Granular masking and privacy controls for regulated environments
Struggle and journey analysis across web and app
Replay fidelity on complex app interactions
Enterprise-only, with no free tier and no published pricing
Pricing: Custom pricing, no public rates
6. Medallia
Medallia is an experience management platform that leads with voice of customer. Surveys, social listening, and feedback signals are the core, with digital behavior analytics available alongside them.
It suits organizations running a company-wide experience program across contact center, in-store, and digital, where the digital analytics piece is one input among many rather than the main event.
Highlights
Broad feedback collection across survey, social, and digital channels
Text and sentiment analysis at scale
Connects digital signals to wider CX programs
Strong fit for enterprises with an established VoC function
Digital behavior analytics is a module rather than the foundation, and there's no free tier or published pricing
Pricing: Custom pricing, no public rates
7. Mixpanel
Mixpanel is an event-based product analytics tool known for flexible segmentation and fast funnel and retention reporting. It's often the first analytics tool a growing product team adopts after outgrowing Google Analytics.
Like Amplitude, it depends on the quality of your event tracking. Well-instrumented, it answers product questions quickly. Poorly instrumented, it produces confident-looking answers to the wrong questions.
Highlights
Flexible event tracking with powerful segmentation
Generous free tier at 1 million events a month
Session replay included, with volume limits by plan
No heatmaps or form analytics, so page-level diagnosis needs a second tool, and usage-based pricing climbs steeply with event volume
Pricing: Free plan (1M events/mo); Growth usage-based; Enterprise custom
8. Microsoft Clarity
Clarity is Microsoft's free session recording and heatmap tool. There are no traffic limits and no paid tier, which makes it the most common entry point for teams testing whether behavioral data is worth investing in.
It's genuinely useful and genuinely limited. For a small site or a first look at how people use your pages, it's hard to argue with free. For an ongoing optimization program, most teams outgrow it.
Highlights
Free with no limits on traffic or number of sites
Click, scroll, and area heatmaps
Copilot AI for summarizing sessions and querying data
Integrates with Google Analytics
Three heatmap types only, recordings are sampled rather than complete, retention defaults to 30 days, and there's no form analytics or dedicated support
Pricing: Free, no paid tier
How to choose a digital experience analytics tool
Not every tool covers the same ground, and the right choice depends on your team's goals, technical environment, and budget.
Here are six criteria to guide your evaluation:
Data collection method: does the platform capture behavior automatically (tagless), or does it require manual tagging for each event? Tagless capture reduces implementation time and ensures you don't miss interactions you didn't anticipate
AI and automation capabilities: can the tool surface insights automatically, or does your team need to run every analysis manually? AI-powered features like natural language querying save hours of exploration
Integration ecosystem: how well does the platform connect with your existing tools—your CMS, A/B testing platform, CRM, or communication tools like Slack and Jira?
Mobile app support: does it cover native mobile apps in addition to web (like Contentsquare), including session replay and heatmaps on mobile?
Pricing and free-tier availability: is there a free plan to get started, and how does pricing scale as your traffic grows?
Privacy and compliance: does the platform support GDPR, CCPA, and other privacy requirements out of the box?
💡 Pro tip: Contentsquare's Smart Capture automatically collects behavioral data without requiring manual event tagging, so you can analyze user interactions retroactively—even for questions you didn't think to ask when you first implemented the platform. This means faster setup and no missed insights from untracked events.
![[Visual] Smart capture](http://images.ctfassets.net/gwbpo1m641r7/5sTRoU5iRLc7OCSvaFLqgn/0f9ade94a320c0a46618fa9a8642812f/smart_capture.avif?w=1280&q=85&fit=scale&fm=avif)
Contentsquare's Smart Capture capability in action
Optimize the digital experience with the right tools
Optimizing digital experiences goes beyond fixing individual issues—it means building journeys that users find intuitive, fast, and valuable. The tools in this chapter give you a complete toolkit for understanding and improving every touchpoint.
Whether you're evaluating Contentsquare, Fullstory, Amplitude, or another platform, the key is matching capabilities to your team's challenges. Explore the full digital experience analytics guide for more context, or compare DXA platforms side by side.
FAQs about digital experience analytics tools
Digital experience analytics (DXA) is the practice of collecting and acting on data about how users interact with your websites and apps. It goes beyond traditional web analytics by capturing behavioral signals—clicks, scrolls, navigation paths, and frustration indicators—to help teams understand why users behave the way they do. For a deeper overview, visit our digital experience analytics guide .

![[Visual] Man at computer - stock](http://images.ctfassets.net/gwbpo1m641r7/7GloM7xPXUs1M75nfaIWtr/6566092d4d853e43c29d9df2bf791fd1/AdobeStock_540624504__1_.png?w=624&q=85&fit=scale&fm=avif)