
Understanding your customers is essential to online success. Heatmap tools offer a unique lens into user interactions, revealing patterns and pain points that traditional web analytics often miss. With precise segmentation, you can see how different audience groups interact with your site and run an in-depth behavior analysis.
A website heatmap tool graphically represents user actions on a page—where people click, move their mouse, and scroll—as a color overlay on your real pages instead of abstract numbers. Warmer areas signal high engagement, while cooler areas show less interaction. For the full breakdown of how heatmaps work, see our heatmaps guide.
This guide is for marketers, product managers using product analytics, UX designers, and CRO specialists who want to understand customer behavior and turn it into conversions. You'll get an at-a-glance comparison table, the 7 best heatmap tools with pricing and best-for guidance, the features that matter most, and a real-world example.
Key takeaways
Heatmap tools turn raw clicks, scrolls, and mouse movement into a visual map of how users actually experience your pages, so you can fix friction and grow conversions.
The best heatmap tool depends on your goals and budget
Heatmaps are strongest alongside session replay and funnel analysis, which reveal the 'why' behind the patterns and where users drop off in the customer journey.
Turn customer behavior into your next conversion win. Book a demo with Contentsquare today.
The top 7 heatmap tools: a comprehensive comparison
Tool | Key features | Starting price | Best for |
|---|---|---|---|
Contentsquare | Zone-based heatmaps, mobile heatmaps, click maps, tap maps, scroll maps, move maps, session replay, journey and funnel analysis, AI insights | Free plan; custom pricing for enterprise | Enterprises connecting behavior to revenue |
Crazy Egg | Click, scroll, and confetti maps, recordings, A/B testing | Paid plans typically start around $29/mo | All-in-one CRO on a budget |
FullStory | Advanced session replay, rage- and dead-click detection, journey mapping | Free trial; custom paid pricing | Digital experience and product teams |
Mouseflow | Click, scroll, attention, and geographic heatmaps, funnels, form analytics | Free plan; paid plans from around $31/mo | Form and funnel optimization |
Microsoft Clarity | Unlimited heatmaps and session replays, advanced filtering | Free | Getting started at no cost |
VWO (VWO Insights) | Heatmaps and recordings inside an A/B testing suite | Free plan; paid scales with traffic | Teams running experiments |
Lucky Orange | Dynamic heatmaps, recordings, live chat, conversion funnels | Free plan; affordable paid tiers | Small businesses |
Here's a closer look at each of the leading heatmap tools available today, and where each one fits.
1. Contentsquare
Contentsquare offers a range of heatmaps that connect with A/B testing, session replays, user feedback, and surveys all one platform, with AI-powered insights and a centralized dashboard to suit large enterprises and high-growth companies.
Its zone-based heatmaps go a step further by connecting user behavior directly to business outcomes, showing how each page element contributes to conversions and revenue so you can prioritize optimizations by real impact, not engagement alone.
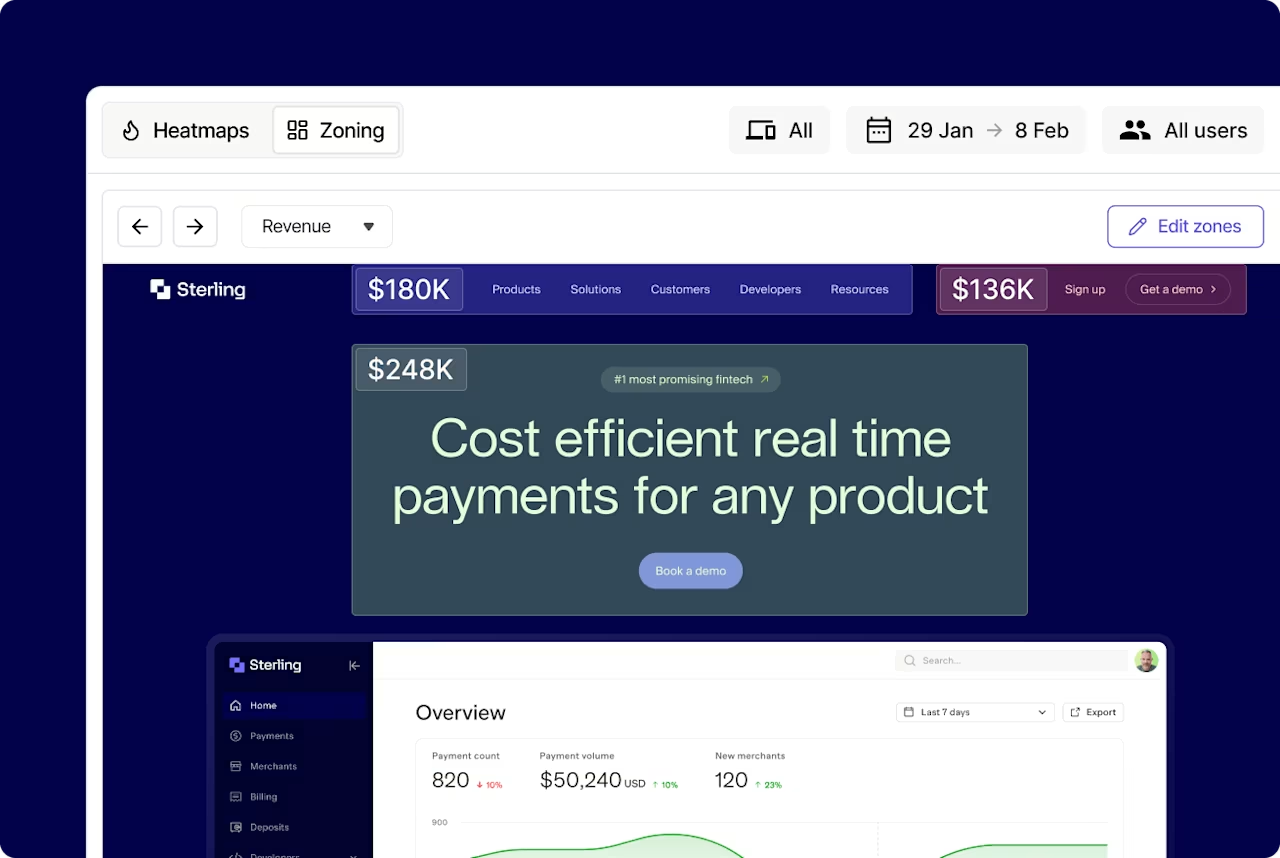
Contentsquare's zone-based heatmaps capability
You can jump straight from an aggregate heatmap view to individual session replays to understand not just what users do, but why.
Best for: enterprises that want to connect customer behavior to conversions and revenue.
Pricing: free plan available; custom pricing for enterprise needs.
2. Crazy Egg
Crazy Egg offers a robust set of visualization options including click maps, scroll maps, and confetti maps. It also provides recordings and A/B testing capabilities, making it a strong all-in-one contender for conversion rate optimization (CRO).
Best for: teams that want all-in-one CRO on a budget.
Pricing: paid plans typically start around $29/mo.
3. FullStory
FullStory excels in its advanced session replay capabilities, providing detailed insights into every user interaction in real time. While it offers a form of 'rage clicks' and 'dead clicks' that function similarly to heatmaps, its strength lies in its meticulous session recording and error tracking to map out the customer journey.
Best for: digital experience and product teams focused on session-level detail.
Pricing: free trial available; paid pricing is custom.
4. Mouseflow
Mouseflow provides comprehensive heatmaps (click, scroll, attention heatmaps, geographic) alongside session replays. It also features funnel analysis and form analytics, making it a powerful tool for optimizing website performance through deep segmentation.
Best for: form and funnel optimization
Pricing: free plan available; paid plans start from around $31/mo.
5. Clarity (Microsoft Clarity)
Microsoft Clarity is a powerful and free heatmap and session recording tool. It offers unlimited heatmaps, session replays, and advanced filtering metrics, making it an excellent option for those on a budget or just starting with user behavior analytics.
Best for: getting started with heatmaps at no cost.
Pricing: free.
6. VWO (VWO Insights)
VWO is primarily known for its A/B testing platform, but its 'Insights' module offers heatmaps and session recordings. This integration is particularly beneficial for teams who want to run experiments and analyze their impact within a single ecosystem.
Best for: teams running experiments who want heatmaps in the same tool.
Pricing: free plan available; paid pricing scales with traffic.
7. Lucky Orange
Lucky Orange provides an affordable and feature-rich solution with dynamic heatmaps, session recordings, live chat, and conversion funnels. Its real-time dashboard is often praised for its ease of use and competitive pricing for small businesses.
Best for: small businesses that want affordable, easy-to-use heatmaps.Pricing: free plan available; affordable paid tiers.
How to choose the best heatmap tool
With so many excellent options, how do you pinpoint the best tool for your specific requirements?
Identify your goals
What exactly do you hope to achieve with a heatmap tool? Consider these use cases:
Are you primarily focused on identifying user drop-off points on specific pages?
Do you need to understand overall content engagement across your site?
Is optimizing complex forms a top priority? Clearly defining your objectives and the specific metrics will narrow down your choices considerably.
Evaluate integration capabilities
Will the heatmap tool integrate seamlessly with your existing tech stack, such as Google Analytics, your CRM, or your A/B testing platform?
Smooth integrations ensure a cohesive data analysis workflow across your entire analytics platform.
Contentsquare integrates with GA4 and leading A/B testing platforms to enhance your existing tech stack. Import GA4 audiences for deeper behavioral analysis, and connect with experimentation tools like Optimizely, AB Tasty, and Adobe Target to segment by test variation and use behavioral insights to inform hypotheses and understand test results.
As an open API platform, Contentsquare can integrate with additional data sources and tools in your analytics ecosystem.
Assess user-friendliness
Consider the learning curve. Does the tool offer:
An intuitive dashboard?
Clear documentation and tutorials?
Responsive customer support?
A user-friendly tool ensures your team can quickly use its full potential to improve the overall digital experience.
Pro tip: many top heatmap tools offer free trials or freemium plans. Take advantage of these to test out features and segmentation capabilities before committing to a subscription.
How heatmaps benefit your business
Heatmaps translate complex user data into actionable insights. Here's how this visual representation directly impacts your business and website performance:
Improve user experience (UX): by identifying confusing elements or ignored content, you can optimize your site's UX and navigation for a smoother digital experience
Boost conversion rates: pinpoint exactly where users drop off in a form or checkout process, allowing you to make targeted improvements that drive CRO
Optimize content placement: discover which headlines, images, or call-to-actions (CTAs) receive the most attention, informing your content strategy
Validate design decisions: test new design iterations and gather empirical evidence on their effectiveness, moving beyond assumptions
Enhance A/B testing: heatmaps provide the 'why' behind A/B test results, helping you understand why one variation performed better than another by highlighting usability issues
![[Visual] ab test heatmaps](http://images.ctfassets.net/gwbpo1m641r7/71Feljv3nwR0ng3PEiPGEG/c5c4f991ef679e660e08970edb2a894a/ab_test_heatmaps.png?w=1280&q=85&fit=scale&fm=avif)
Contentsquare lets you test variations of your site using heatmaps
5 key features to look for in a top heatmap tool
When evaluating heatmap types, certain features stand out as crucial for comprehensive analysis. Here are the capabilities you should prioritize to gain the most valuable insights:
1. Visualizing user engagement
Beyond basic click maps, robust heatmap tools offer various visualization types, including:
Click maps (also known as click heatmaps), which show where users click on a page
Scroll maps (or scroll heatmaps), which indicate how far down a page users scroll, revealing content visibility.
Move maps, which track mouse movements (sampled every 400ms), often correlating with eye-tracking and attention patterns
Rage click maps, which visualize areas where users repeatedly clicked the same element 3 or more times within 2 seconds, indicating frustration or confusion with non-responsive or unclear interface elements
Engagement zones heatmaps, which combine click, move, and scroll interaction data into one unified view to show which parts of your page users engage with most. Color-coded from pink (moderate engagement) to red (highest engagement), with scroll data used to weight interactions that occur further down the page
2. Session replay integration
Session replays (also known as session recordings) let you watch anonymized recordings of actual user sessions. This feature is invaluable for interpreting your heatmap reports. You can see how users navigate in real time, encounter issues, or get stuck, providing a holistic view of the customer journey.
![[Visual] Heatmaps-and-session-replay](http://images.ctfassets.net/gwbpo1m641r7/2wP0r89VqXCSVVWgECyeKy/d5935f3ffda59562270b251885bf1dd6/Heatmaps-and-session-replay.png?w=1280&q=85&fit=scale&fm=avif)
Jump from heatmaps to session replays with Contentsquare
3. Conversion funnel analysis
Does the tool help you track and understand user behavior at each step of your conversion funnel? Top tools integrate heatmaps and session replays with funnel visualizations and key performance metrics to identify where users drop off and why throughout the customer journey.
4. Form analytics
Forms are critical conversion points. Form analytics within a heatmap tool highlight which fields are skipped, abandoned, or cause errors, enabling you to optimize your onboarding for better completion rates.
5. A/B testing integration
A seamless integration with A/B testing platforms lets you apply heatmap analysis to different test variations, providing deeper insights into user responses to design or content changes through detailed segmentation.
Real-world success: how heatmaps transformed Dreams
During a Black Friday, Dreams, the U.K.'s leading mattress and bed retailer, used Contentsquare's Heatmaps capability to monitor their landing page performance and uncover immediate revenue opportunities.
The heatmap analysis revealed their most-clicked 'shop by category' feature was buried at the bottom of the page, while less engaging elements occupied prime visibility at the top.
By simply moving this high-performing section to a more prominent position, Dreams achieved remarkable results: a +150% increase in click rate on mobile devices and an additional +18% boost in revenue over just 5 days demonstrating how data-driven, visual insights can drive significant business impact during critical sales periods.
The power to truly understand your users is within reach. By using the right heatmap tool, you can move from assumptions to data-driven decisions, ultimately leading to a more effective and profitable digital experience.
Turn customer behavior into your next conversion win. Book a demo with Contentsquare today.
FAQs about heatmap tools
The leading heatmap tools for understanding customer behavior include:
Contentsquare
Crazy Egg
FullStory
Mouseflow
Microsoft Clarity
VWO (VWO Insights)
Lucky Orange
![[Visual] Contentsquare's Content Team](http://images.ctfassets.net/gwbpo1m641r7/3IVEUbRzFIoC9mf5EJ2qHY/f25ccd2131dfd63f5c63b5b92cc4ba20/Copy_of_Copy_of_BLOG-icp-8117438.jpeg?w=946&q=85&fit=scale&fm=avif)
![[visual] man using laptop and smiling](http://images.ctfassets.net/gwbpo1m641r7/1z87srPC1ZtqRWZthdA4aW/27570fafd2aa8e49d77161617b8bfd4e/AdobeStock_425210703.jpeg?w=624&q=85&fit=scale&fm=avif)
![[visual[guide][Web analytics] Audit](http://images.ctfassets.net/gwbpo1m641r7/7BFeJly8ya3EbbK28hCDgN/3c5224a95d83a87f3bd37466f7ff1b0c/281092990.jpg?w=624&q=85&fit=scale&fm=avif)