![[Visual] User feedback - Examples - Cover image](http://images.ctfassets.net/gwbpo1m641r7/oCzqFA2ghl1JEUZEnsAwU/a45c6990304a909db6908bdb4caa6cfe/How_to_discover_what_your_users_want_to_read.png?w=946&q=85&fit=scale&fm=avif)
Tracking where users move and rest their mouse cursors captures an image of what attracts users’ attention (or doesn’t) on any website page or product interface. This visual representation is called a move map.
Move maps help you understand user behavior so you can deliver the experience people want when they visit your website or use your product.
What is a move map?
A move map—also known as a mouse movement heatmap, mouse tracking heatmap, or attention map—tracks the overall movement and placement of a user's computer mouse cursor.
Mouse movement heatmaps use color to show how much attention users pay to different page elements: the longer a mouse cursor remains at a certain point, the redder it becomes.
![[Visual] mouse tracking move map on pricing page](http://images.ctfassets.net/gwbpo1m641r7/1LYKgDHcNEYl6S0NXDXyNe/14e732c79426ea36f2bb0443e0b6b572/image1__18_.png?w=946&q=85&fit=scale&fm=avif)
An example of a mouse tracking move map showing popular mouse cursor positions on a pricing page
Why use a move map to track mouse movement
Move maps show you which parts of a page attract the most attention. Since they overlay mouse behavior for multiple users at once, move maps are quantitative representations of page elements that are actively read or seen.
![[Visual] mouse tracking move map on UI-Patterns](http://images.ctfassets.net/gwbpo1m641r7/1sr4PioPvVHTUJ5VC4RQCG/e6aa0fe6cb3d60930bd037d52c661150/image5__5_.jpg?w=946&q=85&fit=scale&fm=avif)
A mouse tracking move map on UI-Patterns.com shows the sidebar getting ignored
Research shows a correlation between mouse and eye movement. This means move maps are also a decent proxy for understanding where people look when browsing your site or using your product.
Compared to eye tracking in a lab, mouse movement heatmaps
Are cheaper and easier to generate
Capture more users at scale, and
Measure real-world behavior
4 ways to use move maps to improve website UX and conversions
Use the examples below to get ideas on how to make the most of mouse-tracking software in your next UX design, usability testing, or conversion rate optimization project:
1. Find where you’re capturing user attention
Move maps show you which elements catch your customer’s eye (and cursor) on any page—just look for the red pixels or hotspots.
Once you know what’s getting seen by page visitors, you can make optimization recommendations and get ideas for what to investigate next.
![[Visual] mouse movements map on a University of Baltimore library site](http://images.ctfassets.net/gwbpo1m641r7/rlqxhJk3LaG90wtY00FAu/2383503c6242acb24c2876a92ff0bc1e/image3__2_.jpg?w=946&q=85&fit=scale&fm=avif)
A mouse movements map on a University of Baltimore library site shows the search box getting all the attention
For example, the University of Baltimore used Heatmaps to add a move map to their library homepage. The heatmap showed most homepage visitors focusing their cursor movements on the tabbed search box, with almost no interaction with other page elements, like the ‘Ask a Librarian’ button.
If this was your site or product, you could
Get more data with Session replays to see exactly how individual visitors use the search box
See where users rage click and get confused
Consider A/B testing new layouts (like three separate search boxes instead of a tabbed one), then put move maps on your A/B test variants to understand why successful variants win
Consider adding an on-site survey to ask your users if anything is missing on the page
2. Confirm whether unclickable elements are being seen
Most text and images don’t require visitors to click, so move maps are the only way you can know at scale if they’re being read and seen.
3. See which elements get ignored
Since move maps measure continuous mouse placement, which can correlate with eye movement, they are better than other analytics tools at showing which elements users ignore.
When De Beers used Contentsquare Heatmaps they noticed users weren’t paying attention to the ‘add-to-cart’ button that appeared at the top of the page.
So, they added a sticky CTA that users couldn’t miss, even as they scrolled the page.
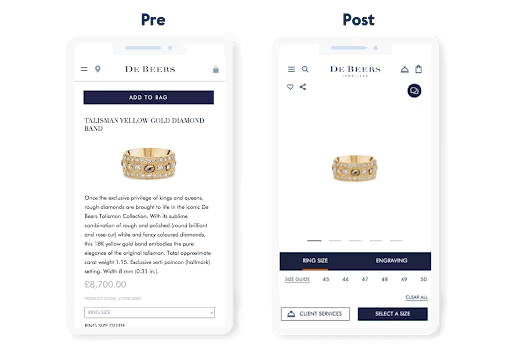
As a result, conversions increased 10%.
For us, we’re a small business of limited people and it’s just a very quick and easy way to get the data you want in a visual, digestible format. Especially when you’re a small team and everything is very fast-paced, you can log in and get the data you need, even if it’s the middle of a meeting. I think that’s really crucial when you’re working in a small business.
4. Segment your move maps to generate targeted insights
Different user segments behave differently on your website or product, and some are more important to your business than others. Segmenting your mouse-tracking move maps helps you focus on your most valuable cohorts.
If you’re using Contentsquare, you can filter heatmaps to get the most relevant data:
![[Visual] toggle your heatmap to show desktop, tablet, or mobile sessions.](http://images.ctfassets.net/gwbpo1m641r7/5Zs7cH08mipnf8s4ZArbZY/575a057d4c7a70084776f9560a09a6ce/image4__9_.png?w=1021&q=85&fit=scale&fm=avif)
Ways you could use this feature include
Filtering by exit page to view what users paid attention to before bouncing
Filtering by event, like clicking a ‘Sign up’ button, to see what users paid attention to before converting
Filtering by referrer or identifier (like UTM parameters) to isolate and investigate paid traffic behavior
Which pages should you use mouse tracking on?
You can track user mouse movements on any website or product page that gets traffic, but move maps are most useful on business-critical pages, and anywhere you want to check interaction with non-clickable elements.
For example:
Ecommerce product pages: use mouse tracking tools to see if shoppers spend time reading product descriptions and looking at product images
Blog posts: use move maps to see which paragraphs and images attract readers’ attention the most
Pages with high drop-off rates: use funnel analysis and tools like Google Analytics to identify conversion leaks, and then move maps to see which areas get user attention
Business-critical CTAs: if calls-to-action (CTAs) aren’t getting clicked, use a move map to troubleshoot the issue
Move maps vs. click maps vs. scroll maps
Move maps aren’t the only type of heatmap you can use: click maps track where users click or tap, and scroll maps track how far users scroll down a page. Unlike these alternatives, move maps measure user behavior continuously, even in between page actions, revealing insights other heatmaps might miss.
For example, a scroll map could show a high percentage of users scrolling to the bottom of a page—but a move map would reveal they completely ignore the sidebar. Similarly, a click map may show no clicks on a product description, but a move map would reveal that users who see it go on to convert.
![[Visual] Click Scroll Move Map comparisons](http://images.ctfassets.net/gwbpo1m641r7/2xGiAsoQeOveqJcLq1zDDg/848fcdbf8a52beab8bdb5faead9c1f0c/image6__2_.jpg?w=781&q=85&fit=scale&fm=avif)
Each type of heatmap helps you investigate a slightly different aspect of your website and product performance
No type of heatmap is better or worse—use them together to get clearer insights:
Click maps to track user engagement: use click maps to see if people click CTA buttons, broken links, or unlinked elements
Scroll maps to visualize user interaction: use scroll maps to view the average fold and see how far most users venture down the page
Move maps to identify patterns: use move maps to find which areas of a page attract attention, and expedite the decision-making process
Engagement Zone Maps to aggregate heatmap data: combine click, move, and scroll data in a grid form, and get an overview of user behavior and engagement in the form of zone-based heatmaps
Rage click maps to pinpoint frustration: discover areas of high visitor frustration and reading struggles, then reduce friction in your key flows
Desktop, tablet, and mobile heatmaps to compare performance: visualize mouse tracking on different devices to ensure you’re providing an amazing experience for all users
Move maps vs. session recordings
A session recording (aka session replay) recreates an individual user’s browsing session across multiple pages: you’ll see mouse movements, but only for a single user at a time.
Move maps, however, aggregate mouse movement for multiple users on a single page. You can use them to look for overall trends and get a broad idea of how different elements attract attention.
💡 Pro tip: combine qualitative and quantitative datasets to draw stronger conclusions. Use move maps to spot the main trend, like an element being ignored, then use Contentsquare Session Replay for a qualitative understanding of what individual users do instead.
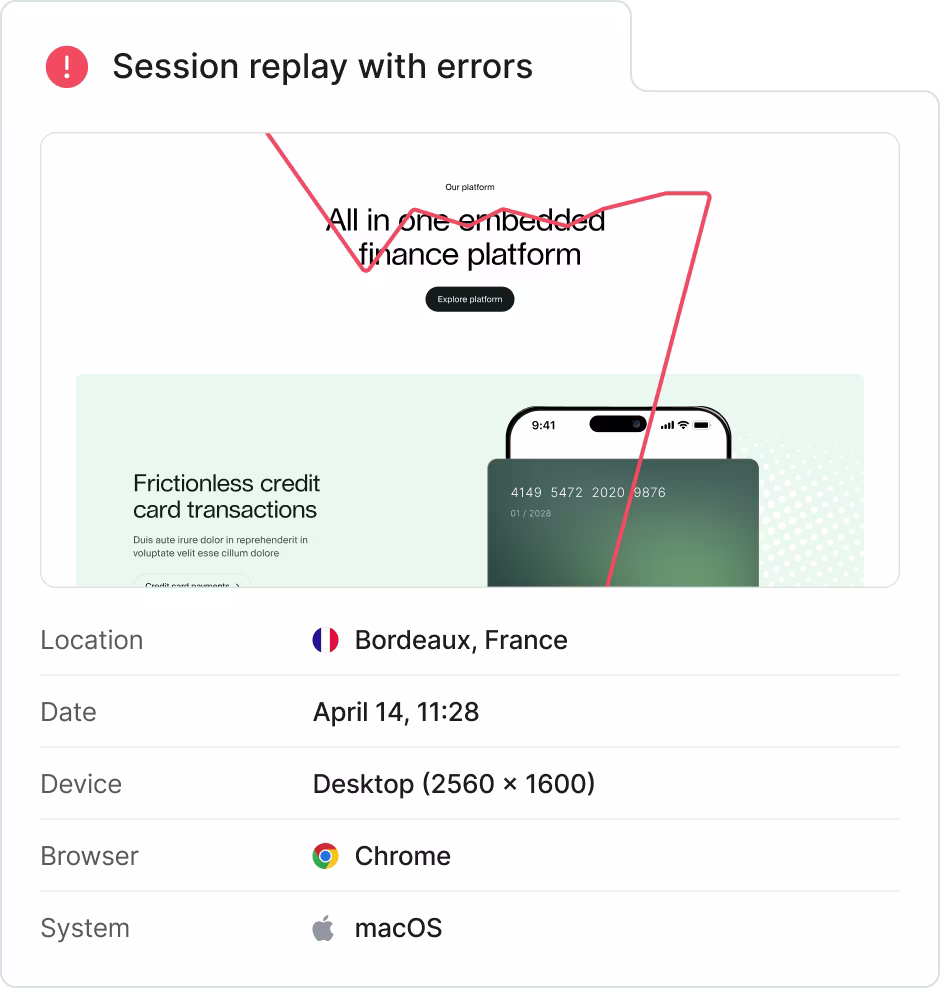
Contentsquare Session Replay provides playbacks of user interactions on your site. Understand how users navigate your pages to uncover the ‘why’ behind their actions.
How to set up a move map on your website
To get started, sign up with Contentsquare to get a unique tracking code (we have a free plan you can try).
Then, install Contentsquare’s tracking code on your site by following our detailed instructions.
Contentsquare will collect data for your move maps once you’ve installed the tracking code.
We also put together detailed walk-throughs on setting up heatmaps depending on your plan:
Once you’ve received some website traffic, your move map will be viewable.
Heatmaps are continuously captured on all pages, so you can toggle between click, move, and scroll maps without changing any settings.
![[Visual] toggle between click, move, and scroll heat maps](http://images.ctfassets.net/gwbpo1m641r7/7N2UarrjCtNXR7xUNkU9in/a41c2b4be2e3c1aa17670d17dc1f9a7f/image2__20_.png?w=1280&q=85&fit=scale&fm=avif)
Create a free move map and increase conversions today
Move maps give you a big-picture overview of what people pay attention to (and ignore) on your web and product pages.
On their own, they’re great visual assets to help explain user behavior to your team and stakeholders. But they become much more valuable when combined with other insights from your analytics stack:
Journeys to tell you where you’re leaking conversions
Session Replay to show you how people browse across your entire site
Surveys to get feedback in your customers’ own words
And guess what? You can do all of the above with Contentsquare. 😉
FAQs about move maps
Mouse tracking is the process of capturing user mouse trajectories or movements on website pages or product interfaces. This helps you measure where users look, what elements they interact with, and which parts of a page or product receive the most attention.
Heatmapping tools like Contentsquare Heatmaps track mouse behavior, including where people click, scroll, and hover their cursors on desktop, and generate heatmaps that aggregate this information.
The mobile equivalent of mouse tracking measures where people tap and scroll with their fingers on touchscreen devices.
![[Visual] Contentsquare's Content Team](http://images.ctfassets.net/gwbpo1m641r7/3IVEUbRzFIoC9mf5EJ2qHY/f25ccd2131dfd63f5c63b5b92cc4ba20/Copy_of_Copy_of_BLOG-icp-8117438.jpeg?w=946&q=85&fit=scale&fm=avif)