
Customer experience (CX) is the sum of every interaction someone has with your brand — from the first moment they land on your site to what happens after they buy, cancel, or leave. It’s not a single touchpoint or department, but the full shape of how people feel while moving through your product, your support, and your communication.
That’s why CX is rarely “fixed” with one initiative. It’s built (or broken) across dozens of small moments: how fast a page loads, how clearly a pricing page answers a question, how easy it is to get help when something goes wrong.
Improving CX means paying attention to those moments, understanding where people struggle or drop off, and making it easier for them to move forward without friction. It’s part mindset, part measurement, and part continuous iteration.
In this guide, we’ll break down what CX looks like in practice, why it has such a strong impact on retention and revenue, and how teams use behavioral data to improve it in a structured way.
Key takeaways
Customer experience (CX) encompasses every interaction customers have with your brand, from first discovery through post-purchase support—it goes beyond customer service to include all touchpoints along the customer journey.
Effective CX measurement combines survey metrics (Net Promoter Score® (NPS®), Customer Satisfaction Score (CSAT), Customer Effort Score (CES)) with behavioral analytics that reveal what customers actually do—helping you increase customer engagement, improve customer retention, and reduce customer churn rates
Improving CX requires systematic customer feedback collection, journey mapping, and acting on insights to reduce friction at key moments
AI-powered tools now enable teams to identify friction patterns and prioritize fixes based on business impact
Customer experience vs. customer service
Customer experience is broader than customer service. It includes every touchpoint a customer has with your company, from the moment they first hear about you in a blog post they found on Google, all the way through to the time they call your support team to ask for help with your product (and, hopefully, get a prompt response).
Comparatively, customer service refers to specific touchpoints within the end-to-end experience where a customer requests and receives assistance or help. For example, calling a contact center operator to request a refund, getting support from a self-service chatbot, or interacting via email with a service provider.
In short, customer service is just one part of the whole customer experience.
What makes a good customer experience?
There's no universal checklist to follow to guarantee good customer experience—your business is unique and so are your customers. However, we've found a number of common principles. In short, good customer experience can be achieved when you:
Make listening to customers a top priority
Use customer feedback to develop an in-depth understanding of your customers
Implement a system to help you regularly collect, analyze, and act on feedback
Reduce friction and solve your customers' specific problems and unique challenges
It's not rocket science: a good customer experience comes from asking your customers questions, listening to their responses, and acting on their feedback.
When you get CX right, the business impact follows. Companies that prioritize customer experience see increased loyalty, higher customer satisfaction, better word-of-mouth marketing, and a competitive advantage over businesses that aren't investing in their CX.
👉 Check out CX stats and trends or learn more about improving your CX strategy
What makes a bad customer experience?
Bad customer experience is primarily caused by:
Long wait times
Employees who don't understand customer needs
Unresolved issues/questions
Too much automation/not enough of a human touch
Service that doesn't provide a personalized experience
Rude/angry employees
If you need any more ideas, just think about the last time you were frustrated as a customer—it's quite likely that one (or more) of the above was the cause.
Ultimately, though, what counts as a poor customer experience in your business will be unique. And you'll only learn about it by opening the door to customer feedback. The good news? Each of these friction points can be identified and measured—which brings us to how you actually track CX.
How to measure and analyze customer experience
From what we've described so far, customer experience might sound like a subjective concept that's difficult to measure. That's why you need to rely on a number of different customer experience metrics that can be used individually or together to get an indication of CX in your business.
You may know some theory behind what makes good and bad CX, but for it to make an impact on your business, you need to have a reliable method of collecting insight from your customers so you can take action and make impactful changes.
Customer feedback is information you collect from your customers about their experience with your product, service, website, or business as a whole. You can use this feedback to improve customer experience by removing or reducing areas of friction, cultivating positive touchpoints, and creating pleasant in-store or digital customer experiences.
You're probably already collecting user feedback without realizing it: when a customer sends an email, calls your support team, or leaves a review on social media, that's feedback. But if you don't measure and analyze that feedback and other valuable voice of customer data, you're missing out on the opportunity to use it to improve customer experience and leverage its growth potential.
By having a measurable indicator of CX, you can track how it improves (or worsens) over time and use customer behavior analytics to evaluate the success or failure of changes you make that might affect your customers.
👉 Read more about the CX surveys you can run to collect feedback from your customers
Survey-based CX metrics
Here are 4 top metrics used by customer experience management (CXM) professionals and customer relationship management (CRM) teams to track and measure customer experience over time, at different points along the entire customer journey:
Customer Effort Score (CES)
Customer Effort Score measures the experience with a product or service in terms of how 'difficult' or 'easy' it is for your customers to complete an action.
CES surveys are usually sent out after an interaction with customer service, with questions such as "How easy was it to get your issue resolved today?" and a rating scale going from '1: very difficult' to '7: very easy'.
These surveys also work well after customers reach important milestones in their journey, particularly the customer activation moments when a customer actively engages with your product or service (for example, after they sign up for a free product trial or successfully conclude a transaction).
💡Pro tip: use Contentsquare's CES survey template (available within Surveys) to discover how hard or easy to use your site or product is. Or run an exit-intent survey to get to the heart of user values and discover why people leave your site.
![[Visual] Surveys - Blue Scale - Grey Background](http://images.ctfassets.net/gwbpo1m641r7/EjdAhCg604qc4ALm2l04R/248d1dfcae429a59ad21ca5546bb7a52/Placeholder__5_.png?w=1280&q=85&fit=scale&fm=avif)
An example of a Contentsquare Customer Effort Score (CES) survey
Net Promoter Score® (NPS®)
Net Promoter Score® is a customer loyalty score derived from asking customers a simple closed-ended question: "On a scale from 0 to 10, how likely are you to recommend this product/company to a friend or colleague?"
You can choose to adapt the question slightly to better suit your business and use a follow-up NPS® question to get more insight, but the point of NPS® is to get a simple numerical score on a scale from 0 to 100 that represents customer experience or brand loyalty.
Net Promoter, Net Promoter System, Net Promoter Score®, NPS® and the NPS®-related emoticons are registered trademarks of Bain & Company, Inc., Fred Reichheld and Satmetrix Systems, Inc.
💡Pro tip: use Contentsquare's NPS® survey at specific moments in the customer journey rather than as a single post-purchase send. A customer who just completed onboarding will give you different signal than one who just renewed, and both are more useful than a quarterly blanket survey.
![[Visual] NPS® surveys](http://images.ctfassets.net/gwbpo1m641r7/1xJjUdkWN6jxZD23Sb3z0y/f4cfd02fc2c488b405dc164aa07bd22e/NPSÂ__surveys.png?w=655&q=85&fit=scale&fm=avif)
Customer Satisfaction Score (CSAT)
CSAT surveys measure customers' satisfaction with the product or service they receive from you. They can be expressed with a 5- or 7-point scale (with '1: very unsatisfied' and '7: very satisfied'), or through binary 'yes/no' questions.
Unlike the Net Promoter Score®, which asks customers to consider their overall feeling towards the brand (and thus, their likelihood of recommending it or not), CSAT focuses the customer's attention on specific touchpoints they were satisfied or dissatisfied with.
Taken in context with CES and NPS, customer satisfaction is a meaningful indicator of whether your customers are cultivating a pleasant emotional connection with your business—what product teams like to call customer delight.
💡Pro tip: Contentsquare has a CSAT survey template to measure how satisfied your users are with your site, product, or service.
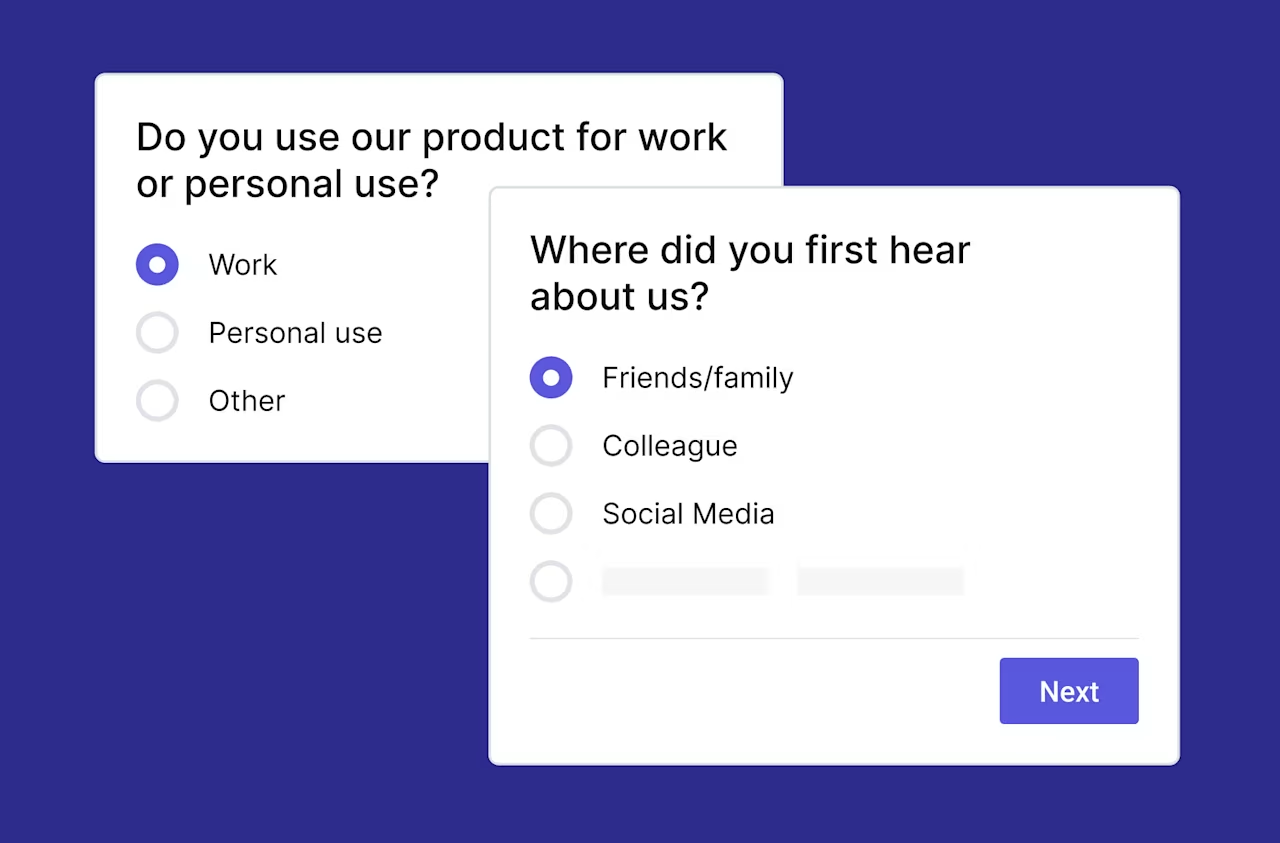
Time to Resolution (TTR)
TTR is the average length of time it takes customer service teams to resolve an issue or ticket after it's been opened by a customer. It can be measured in days or business hours, and is calculated by adding up all times to resolution and dividing the result by the number of cases solved.
And the shorter your TTR, the higher the chances your customers won't experience frustration when they reach out for help.
💡Pro tip: use Contentsquare's TTR survey template to evaluate the effectiveness and perception of your support.
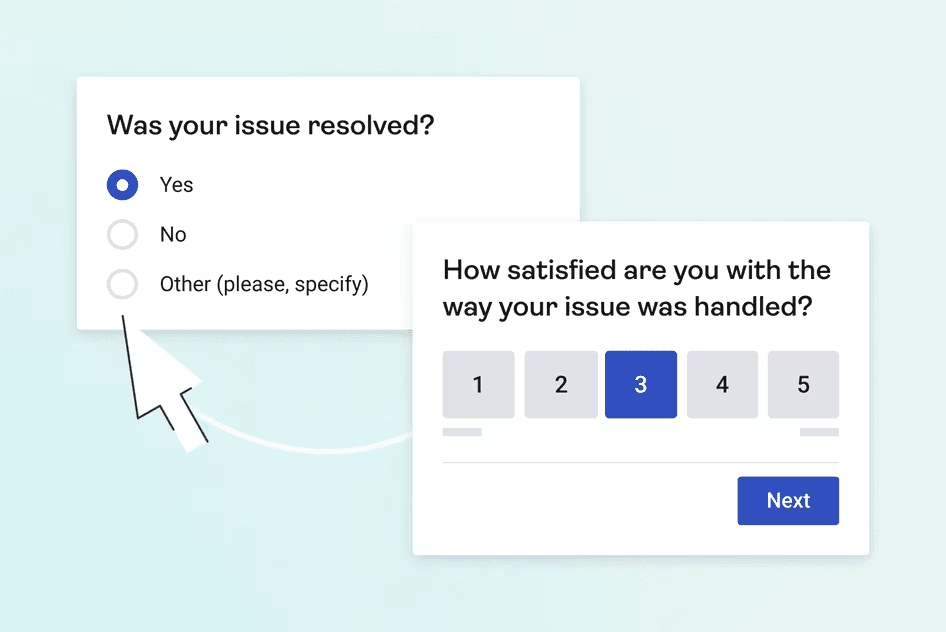
Behavioral analytics for CX measurement
Survey metrics tell you how customers say they feel—but behavioral analytics reveals what customers actually do. This is where you can spot friction that customers might not even consciously notice or report.
Key behavioral signals to track include:
Rage clicks: rapid, repeated clicks on an element that isn't responding as expected
Dead clicks: clicks on non-interactive elements where users expect something to happen
Excessive scrolling: users hunting for information they can't find
Drop-off rates: where users abandon key flows like checkout or signup
Time on task: how long it takes users to complete specific actions
U-turns: users who navigate to a page and immediately go back
These signals often surface friction points that surveys miss. A customer might complete a purchase and give you a decent CSAT score, but if they rage-clicked 6 times on a confusing shipping calculator, you've got a problem worth fixing.
💡Pro tip: Contentsquare's Session Replay capability lets you watch exactly where users hesitate, struggle, or abandon—giving you the context behind the numbers. And with Frustration Score, you can automatically surface sessions where users had the hardest time, so you know where to focus first.
![[Visual] frustration score](http://images.ctfassets.net/gwbpo1m641r7/3qemr2Hn8uBwHwiLrAlPkZ/a7dce69a39ff0689c668cc62f0facd53/frustration_score.png?w=1280&q=85&fit=scale&fm=avif)
CX metrics comparison table
Metric | What it measures | When to use | Limitations |
|---|---|---|---|
NPS® | Overall loyalty and likelihood to recommend | Post-purchase, quarterly relationship check-ins | Doesn't explain why customers feel that way |
CSAT | Satisfaction with specific touchpoints | After support interactions, feature releases | Point-in-time snapshot, can miss broader trends |
CES | Effort required to complete an action | After key tasks (signup, checkout, support) | Focuses on ease, not overall satisfaction |
TTR | Speed of issue resolution | Support interactions | Doesn't capture quality of resolution |
Behavioral signals | What users actually do on your site | Continuously, across all digital touchpoints | Requires interpretation—shows what, not always why |
The most effective CX measurement combines survey data (what customers tell you) with behavioral data (what customers show you). Together, they give you the full picture.
Putting CX measurement into practice
Here's a practical example of what tracking a CX metric and acting on the insight can do for customer experience.
One of our customers, jewelry ecommerce Taylor & Hart, specializes in bespoke engagement rings—not the kind of product people usually think about buying online, and also not the kind of product customers typically buy more than one of.
The company's goal was to turn reluctant users into one-time buyers, and one-time buyers into lifelong promoters who would recommend the same service to their family and friends.
After choosing Net Promoter Score® as their primary CX metric, Taylor & Hart identified 2 essential customer touchpoints and set up NPS® surveys at each milestone:
The moment a customer places an order
The moment the customer receives their order
The resulting NPS® numbers were kept visible on metrics dashboards in the office, and everyone's focus was on improving the scores. It wasn't an easy feat, but the team used each piece of negative feedback to fix parts of their business, from manufacturing to shipping methods, to give customers the best experience they could (if you're curious about the logistics, you can read a full write-up of this NPS® case study).
With a focus on providing a better customer experience, Taylor & Hart grew their NPS® score to over 80 (the highest in their industry). Annual revenue followed suit and doubled to €4.5M.
How to map the customer journey
Understanding your customer journey is essential for improving CX—you can't fix friction you can't see. Journey mapping helps you visualize every touchpoint a customer has with your brand, from first awareness through purchase and beyond.
A customer journey map isn't just a diagram. It's a diagnostic tool that reveals where customers succeed, where they struggle, and where they drop off entirely.
Key touchpoints to analyze
Most customer journeys include these critical moments:
Discovery: how customers first find you (search, ads, referrals, social)
Evaluation: how they research and compare options on your site
Purchase: the checkout or signup flow
Onboarding: first-time use and activation
Support: how they get help when something goes wrong
Renewal/repurchase: what brings them back (or doesn't)
Each touchpoint is an opportunity to delight customers—or frustrate them. The goal is to understand what's happening at each stage and where the biggest friction points exist.
Identifying friction in the journey
Friction shows up in different ways depending on the touchpoint. Here's what to look for:
High drop-off rates between steps in a flow (e.g., 40% of users abandon at the shipping page)
Unusual time spent on pages that should be quick (e.g., users spending 3 minutes on a simple form)
Support tickets clustered around specific features or flows
Negative feedback mentioning the same pain points repeatedly
💡Pro tip: Contentsquare's Journey Analysis visualizes how users actually move through your site—not how you think they move. You can see where users loop back, where they drop off, and which paths lead to conversion versus abandonment. This makes it much easier to prioritize which friction points to fix first.
![[Visual] Trace every user path is journey analysis](http://images.ctfassets.net/gwbpo1m641r7/5P5sT9SL1LLFu5dLEd4kl/cd9e19d9543ada967d1e37a000b492c2/Complex.svg?w=655&q=85&fit=scale)
7 ways to understand and improve customer experience
Here are 7 ways to understand and improve customer experience—and how Contentsquare's AI-powered customer experience intelligence platform supports each approach:
1. Identify high-drop-off pages
Use Journey Analysis to visualize how users move through your site and identify unusually high churn rates in your most important flows, then watch Session Replays to see exactly what users did before dropping off. Uncover the pain points in their user journey and improve their website experience.
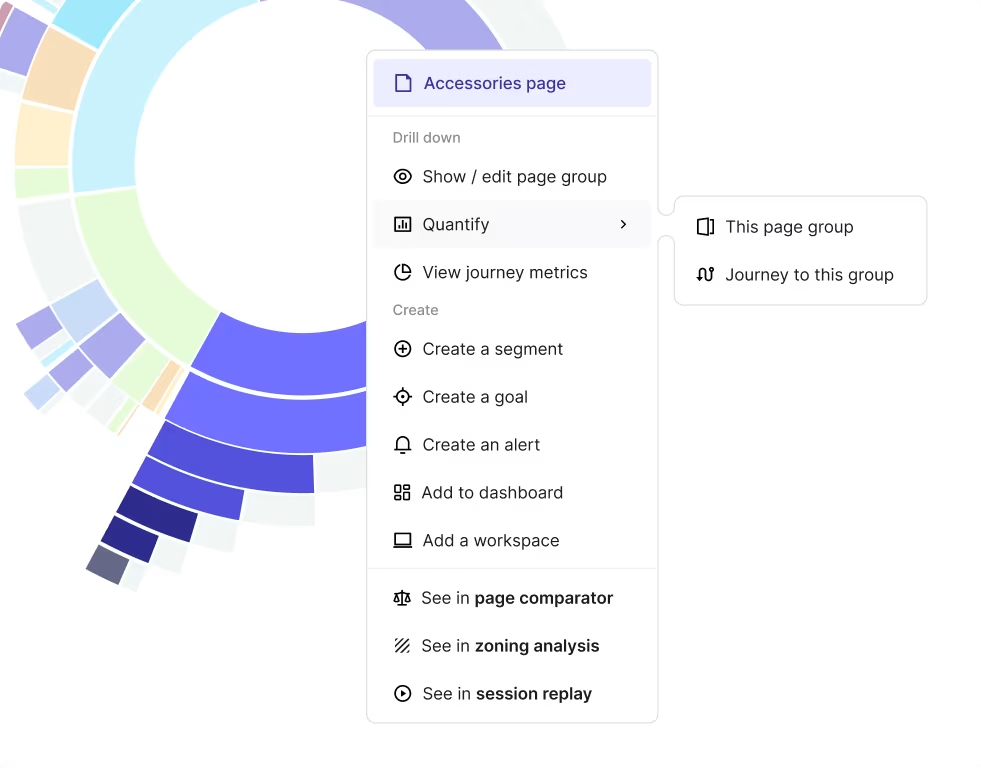
2. Discover how users engage with your page
Heatmaps help you understand how users click, scroll, and move on a page. With zoning analysis, see which areas of your page users most interact with. If you notice some rage clicks on a non-clickable element, improve user experience by making it clickable, or revisit your page's design.
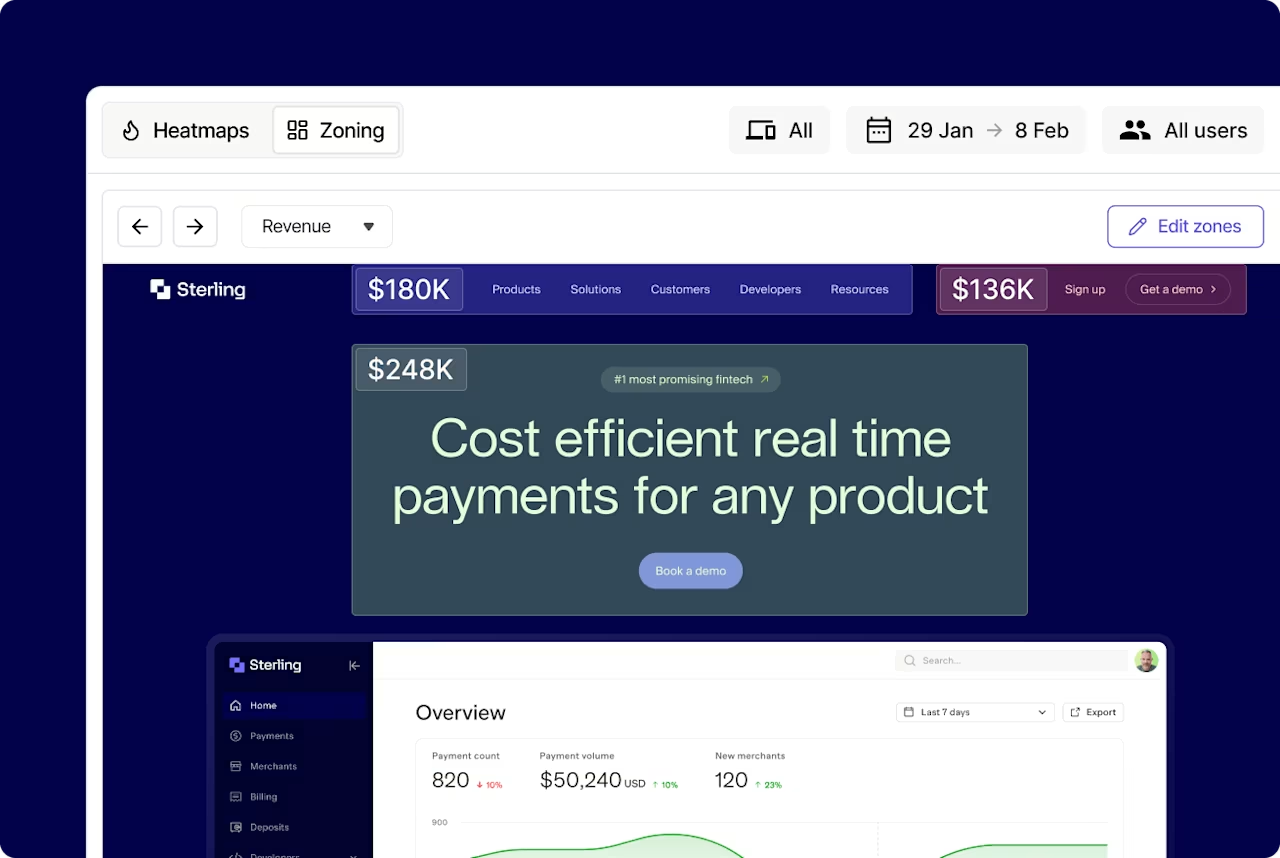
3. Watch session replays of frustrated users
Filter session replays by frustration and intent-driven behavior to dive into sessions where users rage-clicked, u-turned, or generally had a bad time on your site. Filter by errors to review sessions in which users encountered a JavaScript or API error, then let Contentsquare's Error Analysis help you get to the bottom of it.
![[Visual] Session Replay | Error Details](http://images.ctfassets.net/gwbpo1m641r7/5DZbkzo3qFEHFqYFZ7eKsE/755984f322cabf5a7554ccbf5c244e6c/Screenshot_2024-11-04_at_21.10.30.png?w=1280&q=85&fit=scale&fm=avif)
4. Gather in-the-moment feedback
Floating or embedded widgets let you collect feedback from users as they experience your site. Discover how they feel when running into blockers or interacting with something they love on your site, then review their feedback to spot pain points and 'aha moments'.
![[Visual] Survey rate your experience](http://images.ctfassets.net/gwbpo1m641r7/1rlMimxL169NWAT0uWYXXI/a3c1c178194d1574b39e23b49f35b1d3/Screenshot_2024-11-04_at_19.36.31.png?w=1280&q=85&fit=scale&fm=avif)
5. Test changes made to improve CX
Speaking of changes, of course you'll want to know what CX updates to make, and how each one performs, based on all the user feedback you collect. Contentsquare integrations make it easy to act on that digital experience feedback: conduct effortless A/B testing with Optimizely or Omniconvert, then filter your session recordings and user feedback by experiment to understand how users interact with different versions of your site.
![[Visual] ab test heatmaps](http://images.ctfassets.net/gwbpo1m641r7/71Feljv3nwR0ng3PEiPGEG/c5c4f991ef679e660e08970edb2a894a/ab_test_heatmaps.png?w=1280&q=85&fit=scale&fm=avif)
6. Share findings with your team
Last but not least, spread the word: you'll be sitting alone on a mountain of information unless you clue in your team. Share live CX insights and use them to collaborate on initiatives by integrating Contentsquare directly with Slack or Microsoft Teams.
![[Visual] Share in real time via Slack](http://images.ctfassets.net/gwbpo1m641r7/NrQzonnNWGmn6RAF33WFI/ea4eb10640a11305675b4c4df6b0b0e1/Real_time_dashboards__1_.png?w=1280&q=85&fit=scale&fm=avif)
7. Catch performance issues before they damage the experience
Slow load times and layout shifts push users away before the experience even begins. Contentsquare's Speed Analysis capability monitors your Core Web Vitals and performance metrics continuously, showing which pages are underperforming and how they're affecting conversion rates and bounce rates.
👉Real-world example: international optical and audiology retailer Specsavers saw a 33% boost in conversion rate after optimizing their site speed with Contentsquare.

How AI is transforming customer experience
AI is changing how teams identify and fix CX problems. Instead of manually reviewing hundreds of session recordings or sifting through survey responses, AI can surface patterns and priorities automatically.
AI for CX analysis and insights
Here's how AI helps teams work faster and smarter on CX:
Pattern recognition: AI can identify common friction patterns across thousands of sessions—spotting issues that would take humans weeks to find manually
Automatic summarization: instead of watching full session recordings, AI can summarize what happened and flag the key moments worth reviewing
Anomaly detection: AI surfaces unusual behavior or sudden changes in metrics, so you catch problems before they become widespread
Prioritization: by connecting friction signals to business outcomes, AI helps you focus on fixes that will have the biggest impact
💡 Pro tip: Use Sense, Contentsquare's AI, to move from CX data to CX action without the manual work in between:
Sense Chat: ask a plain-language question about where users are struggling and get an instant answer drawn from behavioral data, frustration signals, and journey patterns
Session Replay summaries: scan what happened in individual sessions without watching full recordings, with key moments and potential issues flagged automatically
Sense Analyst: run multi-step analyses autonomously on a schedule and get results delivered to your inbox, so friction points surface before they show up in your support queue
![[Visual] Sense-Analyst](http://images.ctfassets.net/gwbpo1m641r7/6bCIA31ddnLtnu5ZZiq8Ba/fc9dcd6fda33b554190e970fe7bff738/Sense-Analyst.png?w=1280&q=85&fit=scale&fm=avif)
Balancing automation with human touch
"Too much automation" is one of the top causes of bad customer experience, and it's easy to see why. When every interaction feels scripted or deflected by a bot, customers stop feeling like they matter.
The right approach isn't less AI, it's AI in the right places. It excels at:
Surfacing friction patterns and priorities at scale
Handling high-volume, routine queries quickly
Personalizing experiences based on behavioral signals
But some moments can't be automated:
Complex problems that require genuine empathy
Building trust through real human conversation
Making judgment calls in situations that don't fit a script
💡 Pro tip: use Contentsquare's Conversation Intelligence capability to make those human interactions count more. It analyzes existing support conversations across chat, email, and voice to surface what customers are really asking, how agents are responding, and where the biggest gaps are between the 2. That's not replacing the human connection. It's making sure the humans on your team have the context and direction to do their best work.
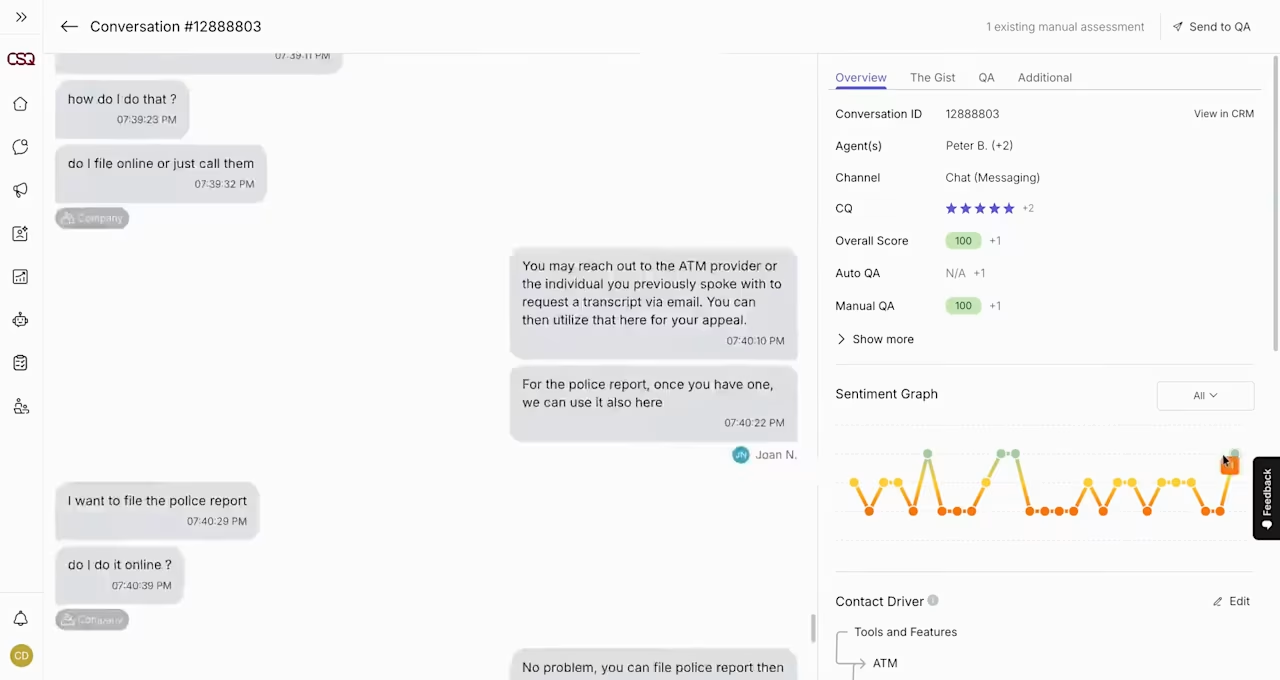
The best CX teams use AI to handle the analysis and the routine, so their people can focus fully on the interactions that actually build loyalty.
FAQs about customer experience
Customer experience is the sum of how people perceive your brand across every interaction—discovering you, browsing, buying, using your product, getting support, and renewing. It's shaped by what customers can do (usability), how easy it feels (effort), and how confident they are (clarity, trust, performance). Improving CX usually means removing friction at key moments and reinforcing what already works.

![[visual] workmates outdoor huddle](http://images.ctfassets.net/gwbpo1m641r7/3CmlQ0z5DbWVh6I44nghlW/1c8d86e84664b82cca03626bd7912039/BLOG-prioritize-brilliantly-2422281.jpeg?w=624&q=85&fit=scale&fm=avif)
![[Visual] Churn prevention - stock image](http://images.ctfassets.net/gwbpo1m641r7/1pt2xn0ppryr3YCMcnF22C/58b89c56360789c3df903a756975a35c/AdobeStock_520992702.png?w=624&q=85&fit=scale&fm=avif)