
You're personalizing pages and running tests, but conversion keeps slipping and you can't tell which changes actually worked. And every visit to your site costs more to win.
Using AI for website personalization and experimentation helps you show each user the right content and prove what works. This guide covers 5 AI personalization tactics and a 6-step loop to test and validate them.
Key insights
AI personalization pays off when it learns from real user behavior so it doesn't need to assume how users will act
One loop works best, so personalize for a segment, test it, and learn why it worked before moving on
Define a win first. Set a primary metric, a minimum lift, and metrics that mustn't drop.
What is AI website personalization and experimentation?
Using AI in website personalization and experimentation means showing each user the most relevant content, then testing which experience converts best.
Website personalization is changing what a page shows based on who's viewing it. With AI, models adapt the page as the user browses, which is called real-time personalization.
Experimentation is checking whether a change helps. The most common method is A/B testing, which splits traffic between the current page (the control) and a new version (the variant).
Before AI, teams wrote "if this, then that" rules, called rule-based personalization. Here's how the 2 compare.
Factor | Rule-based | AI |
|---|---|---|
Who decides | A marketer writes each rule | A model learns from behavior |
Speed | Manual updates | Adapts in session |
Scale | A few segments | Many segments at once |
Risk | Rules go stale | Hard to explain without testing |
Why AI personalization and experimentation work better together
Personalization without testing is a guess. Testing without personalization treats a first-time user and a loyal customer the same.
That gap is getting expensive. In our recent Benchmarks Report, conversion rates fell 5.1% while the cost of a visit rose 9%. Repeat visitors converted at 2.9%, compared to 1.7% for new visitors. So who's on your site should shape what you show. And what you show will affect conversions.
Conversion rate optimization (CRO) is getting more users to take a key action, like buying. AI conversion rate optimization joins 3 jobs in one loop:
Personalization decides what to show: AI picks the content that fits each user
Experimentation proves it worked: an A/B test shows whether the personalized version won
Behavior analysis explains why: user behavior analytics shows how people click, scroll, and move
5 ways AI personalizes the website experience
Each of these 5 tactics removes effort. When users see relevant products sooner, they decide faster.
1. Personalized product recommendations
Personalized product recommendations are suggestions based on what a user browsed or bought. This means shoppers see products that fit them.
They matter most on product detail pages (PDPs), which describe one product. In our Benchmark Report, 1 in 3 visits started on a PDP, and nearly 2 in 3 of those landings bounced.
People bounce for a number of reasons. Rather than guess why your visitors are leaving, use a tool like Surveys to ask directly.
2. Real-time content and offer changes
A banner written for everyone rarely fits one user. So AI swaps banners, copy, calls to action (CTAs), or offers based on each user's actions.
A user viewing running shoes sees a running-gear banner.
A user hesitating on the shipping page sees a free-returns message.
A user comparing 3 laptops sees a comparison CTA.
3. Predictive analytics for user intent
Predictive analytics is using past behavior to guess what a user will do next. This means you can spot who might buy or leave, early enough to act.
For example, AI can offer a discount only to users likely to leave.
4. Landing pages tailored to traffic source
Landing page optimization is improving the first page a user sees after clicking a link. This means the page keeps the promise of the ad or email that brought them.
AI matches the message to each source, including AI assistants. AI-referred traffic was only 0.2% of visits in our report, but its conversion rate rose 55% to 1.3%.
5. AI-driven customer segmentation
Customer segmentation is grouping users who share traits so you can treat each group differently. AI groups users by behavior instead of demographics alone.
Good segments need good behavior data. The Contentsquare platform's 115+ integrations send behavior insights into personalization and A/B testing tools like Optimizely, AB Tasty, Dynamic Yield, Monetate, and Adobe Target.
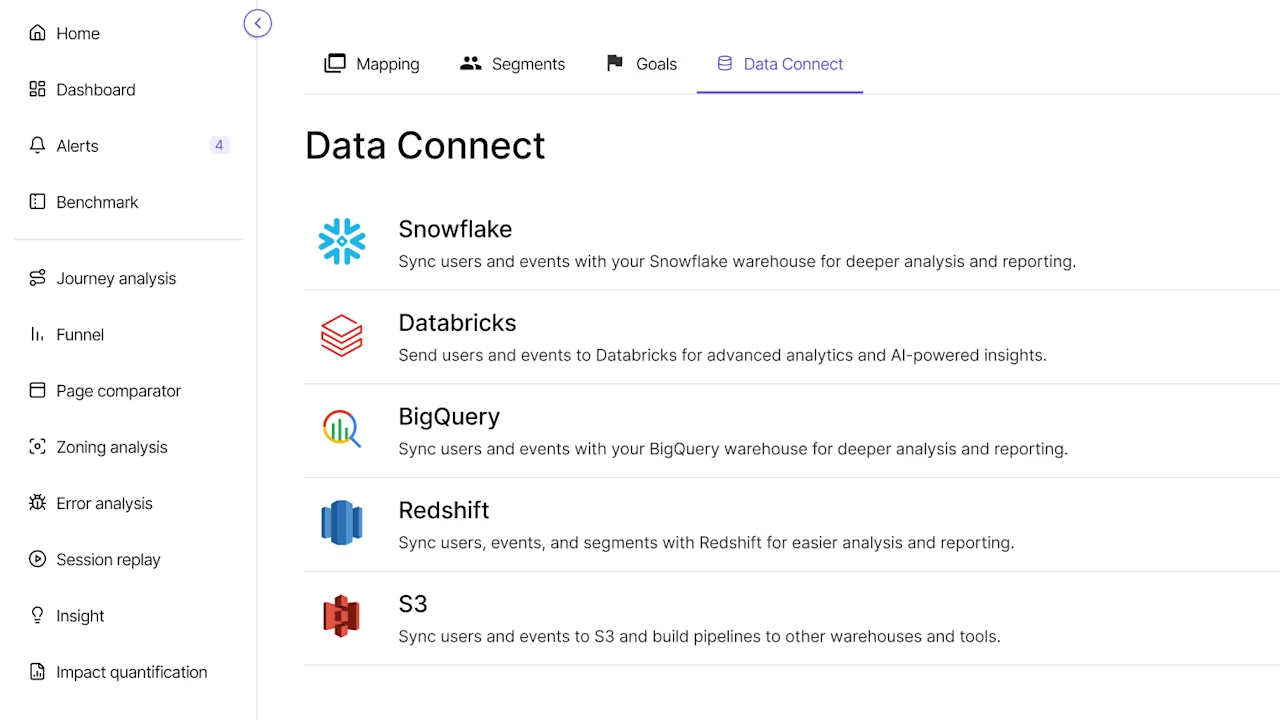
Data Connect syncs that data to your data warehouse, your company's central database. Your personalization and predictive models then learn from real user actions.
How to use AI for personalization and experimentation in 6 steps
These 6 steps form one continuous loop. What each test teaches you shapes the next one.
1. Find your highest-impact friction points
Friction is anything that slows users down, like a confusing form. It hurts most where high-intent users, like shoppers in checkout, drop off.
Finding it by hand takes hours. Sense Analyst, Contentsquare's AI agent, finds and ranks these problems for you.
Ask it, "Analyze my checkout funnel and show me where users are getting stuck and why." It then checks your funnels, page zones, and session recordings.
It also uses Journey Analysis, a sunburst chart of every user path, to show where people exit. Then it estimates each issue's revenue impact and suggests what to fix first.

Contentsquare customer Optimum used Sense Analyst to cut analysis time to minutes per insight, down from 2-3 hours.
2. Pick the segment you want to personalize for
A segment is the group of users who'll see your personalized experience. Choose it using behavior signals like these:
New vs returning users: returning users need less introduction
Traffic source: paid social and search users may need different messages
Device: desktop converted 74% higher than mobile web in our report
High-intent pages: users on pricing or checkout are close to deciding
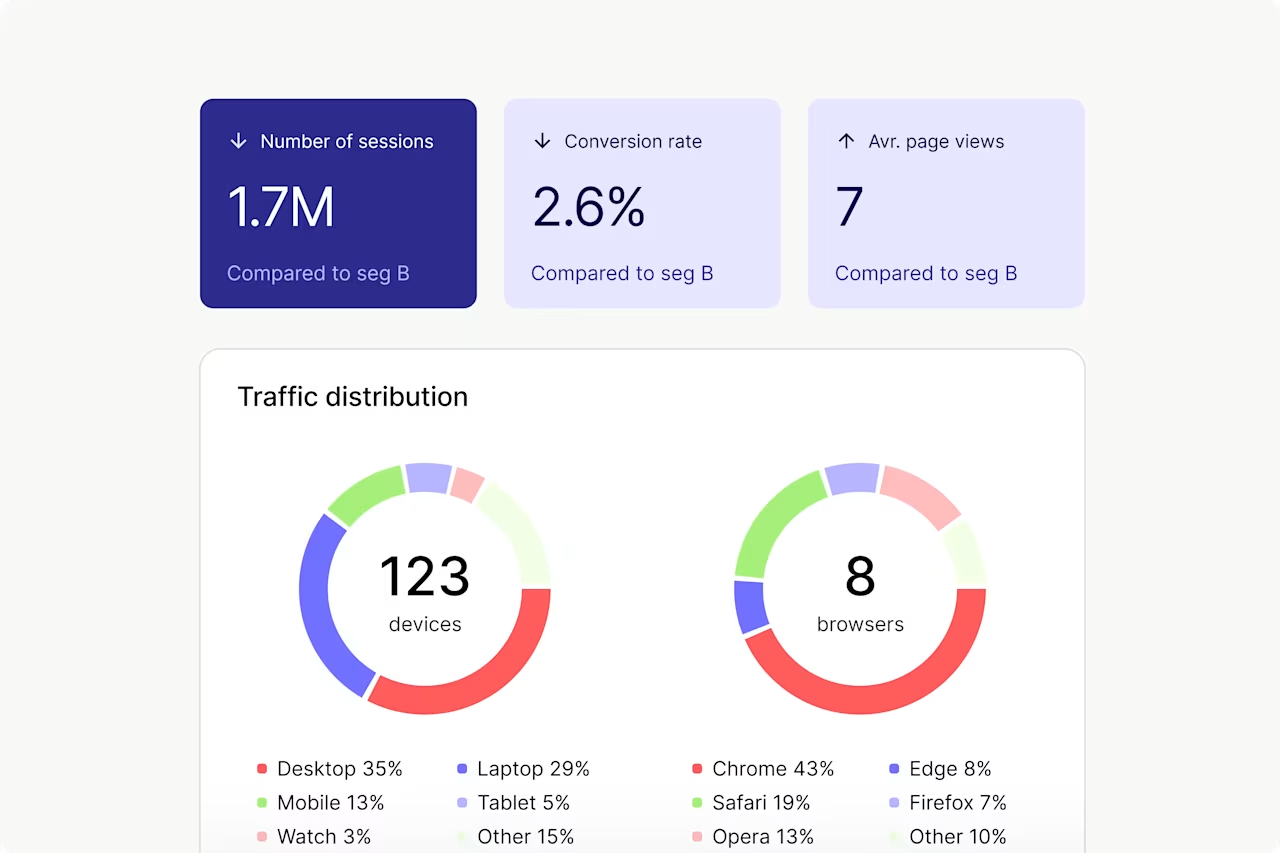
Before you build, Impact Quantification compares conversion and revenue between segments, so you know what each group is worth.
3. Turn the opportunity into a hypothesis
A hypothesis is a testable guess about what a change will do. It keeps tests focused by naming the change, the reason, and the metric.
For example, "If we cut the sign-up form to 4 fields for returning mobile users, completions will rise, because most abandon at field 5."
4. Set success criteria before launch
Success criteria are the rules that decide whether a test won. Setting them first stops you from cherry-picking numbers later.
Primary metric: the one number to move, like free-trial sign-ups
Minimum lift: the smallest gain worth shipping, like a 5% increase
Secondary key performance indicators (KPIs): numbers that should hold steady, like trial-to-paid rate
5. Build and launch the personalized variant
When every test needs a developer, good ideas sit in the backlog. AI tools let marketers build simple front-end tests, while engineering handles backend changes.
Contentsquare Experimentation gives you a visual no-code editor, so you can change copy or swap images without a developer. You can also ask Sense Analyst to recommend a test.
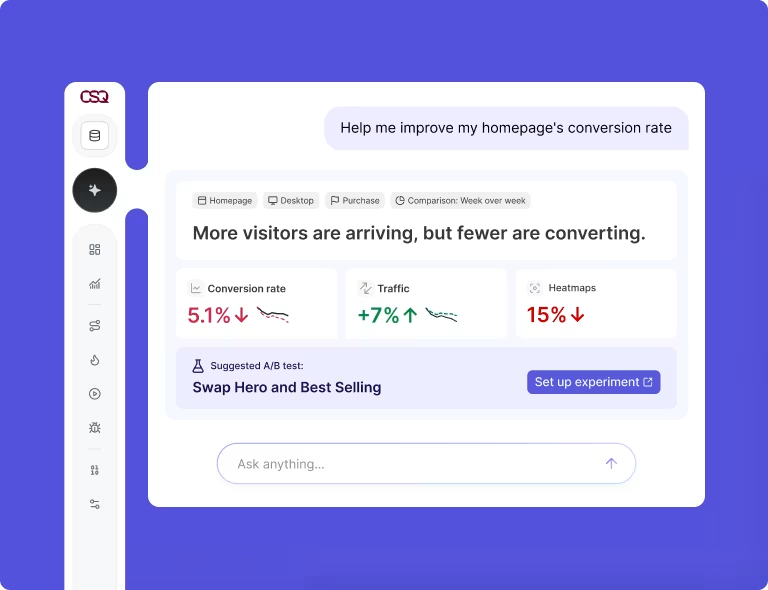
Sense Analyst then drafts the setup, including hypothesis, variants, audience, and primary metric. Review and launch, then create a Jira ticket if engineering needs to make a winner permanent.
6. Validate the result and learn why it won
A variant can look like a winner early and then fade. Bayesian statistics helps you call the result reliably by estimating how likely a variant is to beat the control.
Probability of beating control: how likely the variant beats the original
Expected loss: what you'd lose if the variant is actually worse
Meaningful absolute lift: whether the gain is big enough to matter
Contentsquare Experimentation runs these checks and labels a test 'Inconclusive' until the effect is meaningful. The numbers show which version won, but not why.
Zoning Analysis shows how users engage with each part of a page, so you can compare both versions side by side. Session Replay lets you watch real sessions to see where users hesitate.

Canyon Bicycles tested a homepage video against a still image. The team used Zoning Analysis to compare how the control and variant segments engaged with each version.
Document what you learned, even from losing tests, and feed it into your next hypothesis.
4 metrics to measure AI conversion rate optimization
One metric can hide a problem. An offer might lift conversion but shrink order size, so track numbers that check each other.
Conversion rate by segment: conversion rate is the share of users who complete a goal, like a purchase. Track it per segment, since a win can vanish in the sitewide average.
Revenue per visit: revenue per visit (RPV) is total revenue divided by visits, so it reflects buying and spending. In the report, RPV rose 1% even as conversion fell, because average order value (AOV) climbed 6%.
Guardrail KPIs: guardrail KPIs are metrics that shouldn't drop when your primary metric rises. They stop a "win" from quietly hurting the business. Examples include AOV, bounce rate, and activation, the share of new users who reach a first key action.
Returning user conversion: returning users already know your brand, so they're often closer to buying. Repeat visitors made up 53% of all visits in the report. Test whether return experiences, like "pick up where you left off" modules, beat the default. Contentsquare's A/B testing dashboards segment the control and each variant, so you compare KPIs in one view.
3 risks to manage with AI personalization
AI personalization can backfire on weak data or broken pages. Plan for these 3 risks.
1. Personalizing on too little data
Small segments give noisy results, where random swings look like wins. If a test stays inconclusive, add traffic, broaden the segment, or test fewer variants.
2. Privacy and consent gaps
Personalization runs on user data, so it has to respect user choices. Use consented first-party behavior data, and explain how you use it.
3. Broken dynamic experiences
Personalized content often loads through application programming interfaces (APIs), which pull content into pages. In the report, API errors rose 16% as more of the experience was assembled dynamically, so monitor errors after launch.
FAQs about AI website personalization and experimentation
Yes, B2B sites can personalize by industry, company size, traffic source, or funnel stage. For example, you can show users on your pricing page a demo CTA.

Dana is a copywriting specialist with deep expertise in creating assets like blog posts and landing pages that position organizations as the obvious first choice in their market. She holds a Bachelor of Business Administration in Marketing and has over 10 years of experience helping leading B2B brands drive traffic and increase conversions. Having taught more than 1,000 entrepreneurs the art of persuasive copywriting, Dana brings unique insight into what resonates with audiences and delivers results.

