
Website experience analysis shows you how real users move through your site, where they get stuck, and why they leave before converting. This guide walks marketing, UX, and ecommerce teams through what to measure and how to turn those findings into a smoother, higher-converting experience.
Key insights
Numbers show what, behavior shows why: traffic and ranking reports tell you what happened, but watching how people actually use your site tells you why they stayed or left.
Small friction fixes add up: finding and removing the moments where users get stuck can extend visits and lift conversions more than a full redesign.
It's an ongoing habit, not a one-time audit: the sites that keep improving check their experience regularly and act on what they learn.
Blend 2 kinds of data: pairing hard numbers with real behavior gives you a full, honest picture of your site.
What is website experience analysis?
Website experience analysis is the practice of studying how real people use your website so you can make it easier and more rewarding to use. It looks at what users click, where they scroll, where they get stuck, and where they drop off.
The goal is to turn that behavior into changes that improve the experience. It's a step beyond basic website analysis, which often stops at traffic counts, rankings, and speed.
Website experience analysis adds the human side. So you understand not just how many people came, but how they felt and what got in their way.
It's also different from web analytics. Web analytics measures events like page views and sessions, while experience analysis explains the story behind those events and helps you decide what to fix first.
Why website experience analysis matters
People are visiting fewer sites, and they expect more from every visit. As revealed in The 2026 Digital Experience Benchmark Report and Interactive Explorer, our latest annual survey of the digital customer experience, engagement dropped 10% and conversion rates fell 5.1% year over year.
When every visit is harder to earn, understanding the experience is what separates sites that keep users from sites that lose them.
The good news is that the experience itself improves where teams pay attention. Frustration signals fell 4.3%, and slow page loads dropped 20% and now affect just 1 in 10 sessions.
Fixing these problems has a direct payoff. Reducing rage clicks by 1.5 percentage points per page view adds about 1 more page view per session.
Returning users are where performance holds up. Repeat visitors now make up 53% of all visits, and they convert at 2.9% compared with 1.7% for new visitors.
Every visit counts more: with traffic harder to earn, the quality of each experience matters more than raw volume.
Friction is measurable: signals like rage clicks and slow pages can be tracked and fixed.
Loyalty pays off: understanding returning users protects growth when new traffic is expensive.
The layers of a website experience analysis
A complete analysis looks at your site from a few angles at once. Each layer answers a different question, and together they show the full picture.
Here are the 4 layers to cover.
Technical performance and speed
This layer checks how fast and stable your site is. Slow pages, layout shifts, and errors push users away before they ever see your content.
Start here, because speed shapes every other part of the experience.
Search and discoverability
This layer looks at how people find your site in the first place, through search engines and, increasingly, AI answers. If the right pages aren't visible, the rest of the experience never gets a chance.
Web analytics and search tools show you which pages earn attention.
User behavior and experience
This is the heart of the analysis, and it answers why people act the way they do. User behavior analytics show where people click, how far they scroll, and where they hesitate.
Heatmaps turn that behavior into a simple color picture of what users notice or ignore. Session replay goes further and lets you watch a real recording of a visit, so you can see exactly where someone got stuck.
![[Visual] Heatmaps-and-session-replay](http://images.ctfassets.net/gwbpo1m641r7/2wP0r89VqXCSVVWgECyeKy/d5935f3ffda59562270b251885bf1dd6/Heatmaps-and-session-replay.png?w=1280&q=85&fit=scale&fm=avif)
Conversion and customer journeys
This layer follows users along their path toward a goal, like a signup or a purchase. Website traffic analysis and funnel views show where people drop off on the way.
That's where your biggest conversion rate optimization wins usually hide.
How to conduct a website experience analysis
You don't need a huge project to get value. A clear, repeatable process works better than a one-time overhaul.
Follow these 5 steps.
1. Set a clear goal
Decide what you want to learn or improve before you open any tool. A goal like "reduce checkout drop-off" keeps your analysis focused so you don't drown in data.
2. Gather your quantitative data
Start with the numbers. Use web analytics to see traffic, popular pages, and where users leave, which is the core of website traffic analysis.
This tells you where to look more closely.
3. Add qualitative and behavioral insight
Numbers rarely explain themselves, so add the why. Watching real visits with session replay and asking users directly with on-site surveys shows what people were trying to do and where they felt confused.
Usability testing, where you watch people attempt real tasks, is another simple way to hear the reasoning behind the clicks.
4. Find and prioritize friction
Now look for the moments that break the experience, like rage clicks, dead clicks, and slow pages. You'll find more issues than you can fix at once, so rank them by impact.
This is where the Contentsquare platform's Impact Quantification earns its place. It shows how much each issue costs you in conversions, so you fix the ones that matter most first.
![[Visual] Impact Quantification](http://images.ctfassets.net/gwbpo1m641r7/4IJqJ0oQjeIPQarJo5Penh/7b50e86a64798268f7ce9bf84184815a/Impact_Quantification__1_.svg?w=655&q=85&fit=scale)
5. Test, fix, and keep monitoring
Make a change, then measure whether it actually helped. This is where conversion rate optimization becomes a habit rather than a guess.
Keep monitoring after the fix, because experiences shift as your site and your users change.
Metrics to track in a website experience analysis
The right metrics connect behavior to business results. Track a small set consistently instead of chasing every number.
These are the ones that tell you the most.
Engagement: time on page, scroll depth, and pages per session show whether content holds attention.
Bounce rate: the share of users who leave after one page, which can flag a mismatch between what they wanted and what they found.
Conversion rate: the share of users who complete a goal, the clearest tie to revenue.
Frustration signals: rage clicks, dead clicks, and errors that reveal broken moments.
Retention and repeat visits: how often users come back, a strong sign of long-term value.
Website experience analysis tools
No single tool shows everything, so most teams use a small mix. The easiest way to choose is by what you want to learn.
Here are the 3 main groups of website analysis tools.
Behavioral analytics tools
These tools reveal the why behind user behavior, and they're where the Contentsquare platform does much of its work. Heatmaps show where users click, scroll, and pay attention, so you can see what draws the eye and what gets missed.
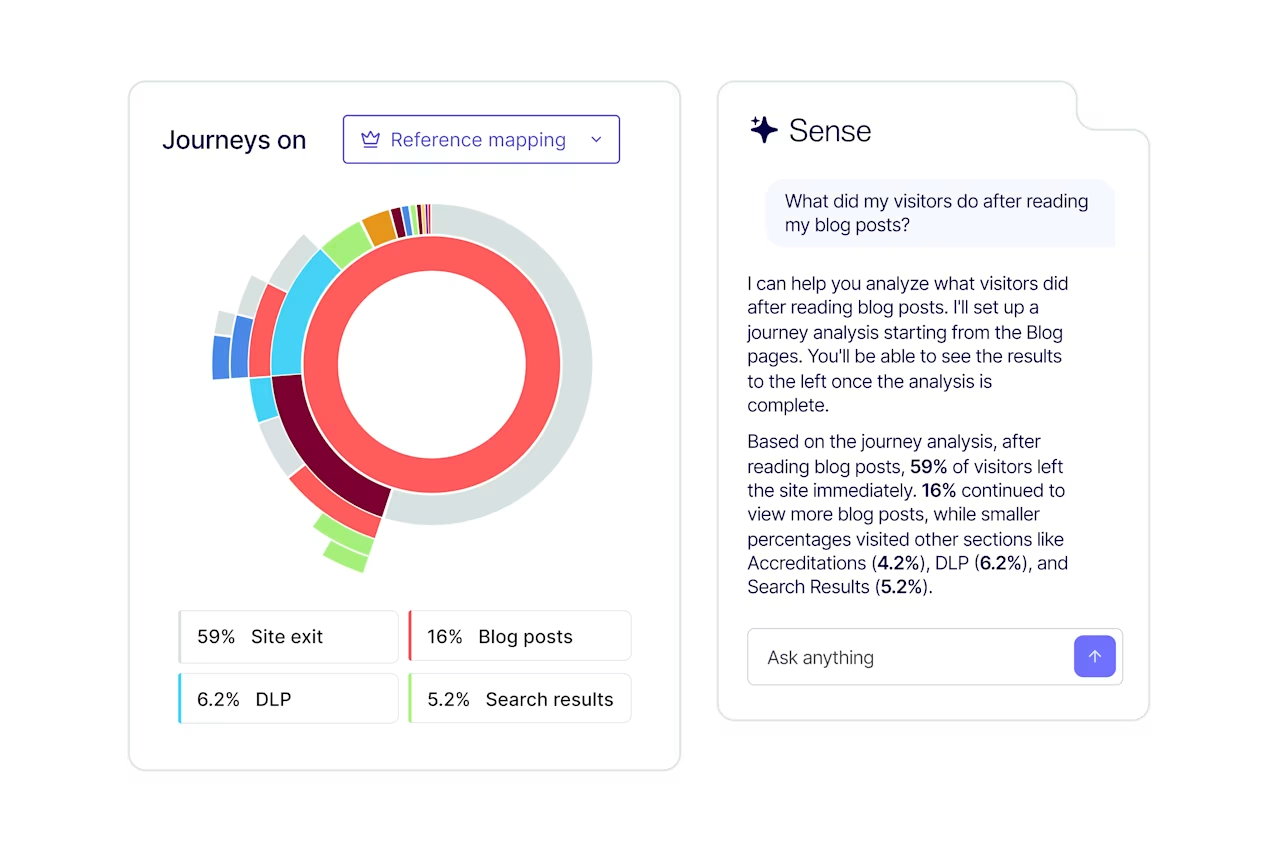
Session Replay lets you watch individual visits to spot friction firsthand. Journey Analysis then shows how users move from page to page, so you can find exactly where they drop off.
Feedback and survey tools
These tools let you hear from users in their own words. On-site surveys and feedback widgets, which you can run with Contentsquare Surveys, capture how people feel in the moment, like why they're about to leave a page.
![[Visual] Exit-intent survey - Help us improve website experience](http://images.ctfassets.net/gwbpo1m641r7/xYQkQJeSQsBO4fZZ7rtlj/4a1cd1b989b57206a5ae490f944a4a72/Exit-intent_survey.webp?w=1280&q=85&fit=scale&fm=avif)
It's the fastest way to add real voices to your data.
Technical and search tools
These tools cover the performance and visibility layers. Speed and monitoring tools track how fast your pages load and connect that speed to conversion, and the Contentsquare platform can watch performance over time so you catch slowdowns before they cost you.
![[Visual] Speed analysis](http://images.ctfassets.net/gwbpo1m641r7/FCbnGzBAwCbWbTyLprEo3/519d9f70f62d63667a8c1ce9de3bd825/eyJwYXRoIjoiY29udGVudHNxdWFyZVwvZmlsZVwvYXluRVpNcEtXUjlyMmZmempSa0UucG5nIn0_contentsquare_JJt3WG8OGOksUM7oCOwfVnNu8q5IgJmQvH.png?w=1280&q=85&fit=scale&fm=avif)
Search and web analytics tools round out the picture by showing how people find and enter your site.
Common mistakes in website experience analysis
A few habits quietly limit the value of an analysis. Avoiding them keeps your work honest and useful.
Watch out for these.
Studying traffic without the why: counts alone never explain behavior.
Chasing vanity metrics: numbers that look good but don't tie to goals waste time.
Treating it as one and done: experiences change, so a single audit goes stale fast.
Ignoring mobile and returning users: these groups often behave very differently.
Fixing everything at once: without prioritizing by impact, you spread effort too thin.
FAQs on website experience analysis
Website analytics is the data collection layer that tracks events like page views and conversions. Website analysis is the practice of interpreting that data, along with user behavior, to decide what to improve.

![[visual] Create a customer-centric web analytics strategy in 6 steps to understand what's happening on your site and how to use those insights efficiently.](http://images.ctfassets.net/gwbpo1m641r7/71H9F3zT0PYJvTdJLi7npH/0ada5a14d0f5d7913e1e4600e0e3874f/435362361.jpg?w=624&q=85&fit=scale&fm=avif)
![[visual] two woman indoor workplace with computer](http://images.ctfassets.net/gwbpo1m641r7/2zTNYaIwbTRLzB4yKps94k/db306dbef569a11c2d3b70eef5d2af4e/AdobeStock_846419006.png?w=624&q=85&fit=scale&fm=avif)