
Behavior analytics can unlock a whole new world of insights about your users, but knowing what to do with those insights is the real challenge.
In this article, we explore how to build and implement a behavior analytics strategy that works for your business, website, product, and audience—not just to improve a metric, but to help your users achieve their goals, so you can achieve yours.
Key insights
Users lead, goals follow: a behavior analytics strategy starts with how real people use your site or app, then shapes your goals around what you learn.
Layered data reveals the why: heatmaps, session replays, journeys, and surveys each show a different side of the experience, so combine them.
It's a cycle, not a checklist: fix the highest-impact issues first, measure the results, and repeat.
What is a behavior analytics strategy?
A behavior analytics strategy is a set of steps designed to improve the user experience based on what you learn about from behavior analytics tools. As the rest of this behavior analytics guide shows, discovery tells you what users need. To get results, you have to act on what you learn.
4 steps to implement a customer-centric behavior analytics strategy
In the past, your product and marketing strategy may have gone something like this:
Set a business goal (like increase revenue or customer acquisition)
Figure out a strategy (based on 'best practices') that gives you the best chance to hit your goal
Execute the strategy
Keep at it until you meet your goal
It's time to flip this approach on its head: start with what your users already experience when they use your website or app and let that lead your strategy.
Instead of forcing users into an experience that matches your goal, collect data about their user journey, make improvements to help them reach their goal, and then use that to inform your goal and strategy in these 4 steps:
1. Understand the current user experience
Your first step is deceptively simple: understand the current user experience by learning how real people interact with your site or product.
This is where you put your behavior analytics tools to work—with Contentsquare tools like Heatmaps and Session Replay, it's almost like peeking over your users' shoulders to see
What users pay attention to and ignore
How they move between website pages or product features
Confusing or frustrating bugs or issues they experience
Actions users take before they exit
To zoom out further, Contentsquare's Journey Analysis shows the paths users take from entry to exit, so you can spot where they loop back or leave. To know which numbers to watch, read the behavior analytics metrics chapter.

Contentsquare's Journey Analysis tool.
💡 Pro tip: use Google Analytics and behavior analytics tools together. Reviewing hundreds of session replays or heatmap reports might sound intimidating and time-consuming. That's because it is.
Instead of relying on every report you get from your behavior analytics tools, complement your user activity data with a tool like Google Analytics (GA) to identify pages or elements to focus on.
For example, you could use GA to find low-converting pages, under-used product features, or pages with high drop-off rates, and then use filters in your behavior analytics tools to locate and analyze relevant reports.
2. Identify issues that keep users from the experience you want them to have
Find what's standing between your users and their ideal experience with your site or product. Dig deeper into the user experience and look for specific blockers or areas where users get stuck.
Look for friction points and issues like
Repeated clicks (also known as rage clicks) on an element that isn't clickable, like an image or plain text
calls to action (CTAs) users miss because they don't scroll far enough
Broken buttons or links
Product features that are ignored or overlooked
Some behavior analytics tools, like heatmaps, give you aggregate data to understand issues your users experience on a larger scale. Others, like session replay, show you individual users' clicks, mouse movements, and navigation from page to page.
To find where issues hit hardest, segment your users. New and returning users, or mobile and desktop users, often struggle in different places. Follow each segment through your key conversion funnels and journeys using funnel analysis to pinpoint where they drop off.
For a quick first pass, map a 2-4 step journey with this free Journey Analyzer, or run a low-converting landing page through this CRO Analyzer.
Then rank the issues you find by reach (how many users hit them) and impact (how much they hurt conversion).
When choosing your behavior analytics tools, ask yourself: 'Will the insights I get from this tool help me understand where my users struggle and decide which changes I need to make to my site or app?'
Use this behavior analytics tools chapter to understand the different tools and choose the right one for your situation.
💡 Pro tip: combine tools for even more powerful insights. The fun thing about behavior analytics tools is that each gives you a different type of data. The real magic happens when you start layering user behavior analytics tools for even deeper insights.
For example, you can combine:
Heatmaps and A/B testing tools: compare heatmaps for A/B test variations of the same page, or use heatmaps to come up with a hypothesis for an A/B test (try the free A/B Test Generator).

Contentsquare's Heatmaps lets you see how users interact with A/B tests.
Heatmaps and session replays: use heatmaps to catch behavioral patterns (for example, only 30% of people scroll deep enough to see a feature update), then use session replays to see what users do on that page (for example, what do they do when they don't scroll to the updated feature).
Session replays and A/B testing tools: compare session replays for A/B test page variations to see how each of them impacts the user's experience with your product.
3. Understand your users' goals
You're providing the most value to your users when your product helps them reach their goals. Now, it's time to learn what your users are trying to do when they visit your site or use your product.
Think about using the Jobs-to-Be-Done framework (JTBD), which implies users 'hire' your product to do a job for them. This includes your product as a whole, individual product features, and your website. This customer behavior analysis chapter explores these motivations further.
To understand your users' goals—the job they hired your product for—ask:
Why did they come to your website or app today?
What are they trying to find or accomplish while they're there? Did they successfully do that?
Did any of the issues identified in Step 2 (above) stop them or slow them down?
You can learn a lot about your users' goals from how they navigate your website (using tools like heatmaps and session replay), but you can learn even more from user feedback.
User feedback is gold. It gives your users a voice and allows you to prioritize fixes, UX improvements, and product updates that matter most to them.
💡 Pro tip: make it easy for users to share instant, direct feedback. Tools like Contentsquare's Surveys let you ask targeted questions and limit them to specific pages users visit or devices they're on. By asking questions like
What persuaded you to [take action] today?
What, if anything, stopped you from [action] today?
What are your main concerns or questions about [product or service]?
What were you looking for when you landed on this page?
You'll add context to what you've learned through heatmap reports and session replays.
Use the feedback option in Surveys to let your users leave feedback on specific elements of the page or product. See what users love and hate, the issues they run into, and how improvements you make impact their experience over time.
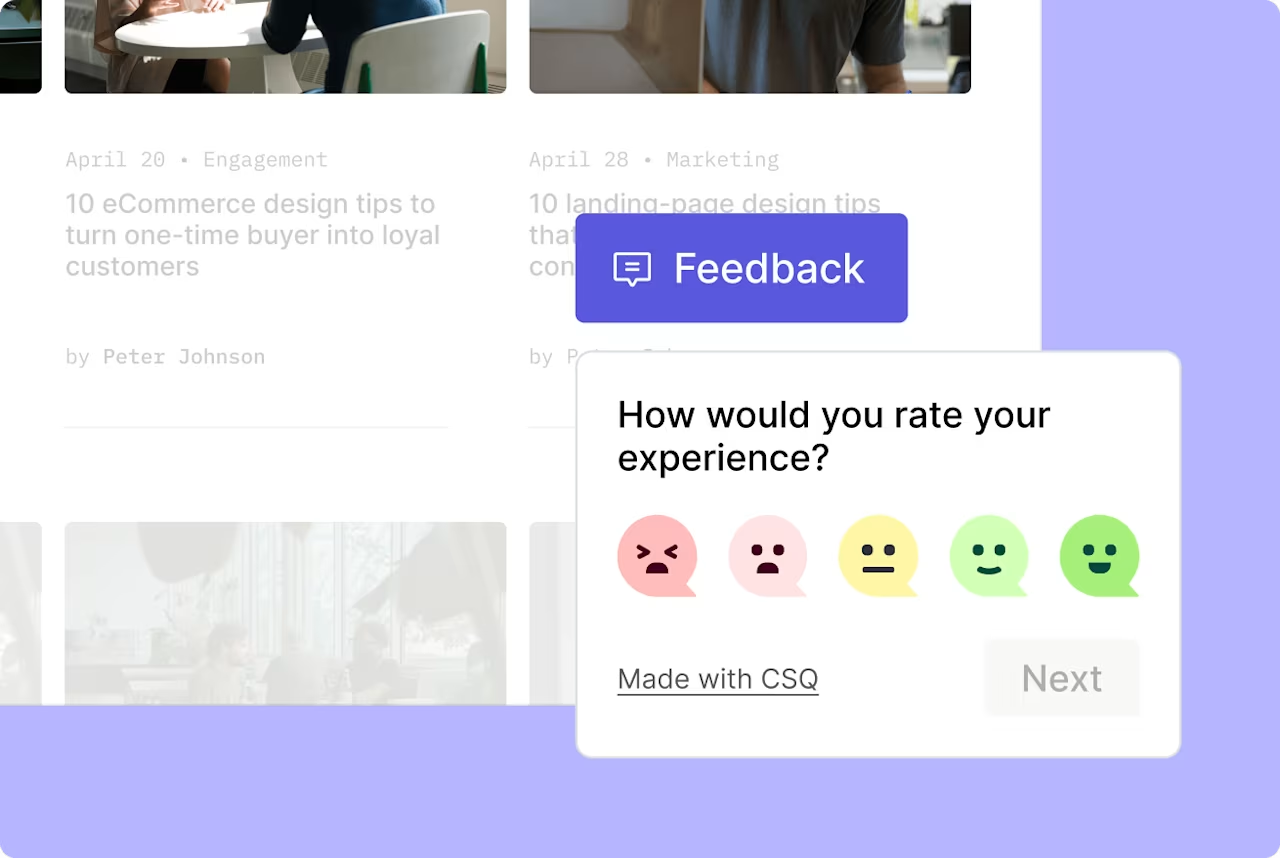
Add a Contentsquare feedback button to your pages so users can leave you feedback whenever they like.
4. Use what you've learned to inform your goal
So far, you've focused on your users' experience and goals. In this final step, it's time to identify and reflect on how improving the user experience will lead to business results.
A customer-centric approach to product development, marketing, and company culture is the groundwork for a successful business.
A great customer experience (CX) generates and increases customer loyalty, customer satisfaction, positive reviews, and word-of-mouth marketing. Naturally, your goal to create a better user experience—and how seriously you take it—impacts your business goals.
If your users can have a frictionless product experience—meaning they can hit their goals and get maximum value from your website or product—how does this reflect on your business?
Think:
Leads: webinar signups, contact form completions, free trials, demo requests
Sales and revenue: new customers, repeat purchases, subscriptions, average transaction value
Customer satisfaction: customer satisfaction score (CSAT), Net Promoter Score® (NPS), which you can work out with our free NPS® calculator
Check this data regularly as you implement improvements and use Contentsquare's Impact Quantification capability to understand the true impact of your behavior analytics strategy for every aspect of your business.
Why can't I just apply 'best practices'?
There's a deceptively easy path towards improving results from your site or app: industry benchmarks.
Benchmarks are comfortable. They tell us what other brands are doing and give us a tangible, measurable goal to aim for. If we hit that number, we've done our jobs, right?
Think again.
Benchmarks and 'best practices' are past practices by definition: something that worked in the past, for someone else. These practices took months (or years!) to develop, test, implement, and pass on. Using other companies' 'best practices' means you're just playing catch-up.
Benchmarks tell you how a range of companies, with many different websites, products, and customers, are doing on average. You've heard of benchmarks for metrics like conversion rate, bounce rate, and cart abandonment rate.
Without details and context, these behavioral baselines are pretty useless. Let's unpack the benchmark for landing page conversion rates:
Let's say your landing page converts 1% of its users. The benchmark is 6.6%, so you use that as your goal. To make this happen, you implement some landing page 'best practices':
You add a contrasting color to your CTA button
You add scarcity to your landing page copy ('Limited quantities/spots!')
You reduce the number of fields in your signup form
You add an exit pop-up
what's the issue with this approach?
You have no clue what 99% of the people who visit your landing page actually do before they leave without converting. You don't have answers to questions like:
Are users missing a key piece of information they need to take the next step?
Are users confused by what the landing page offers?
What do users look at on your website right before they open this landing page?
How long do users stay on the landing page before leaving?
What do users focus on, and what do they completely ignore?
The only way to get more than 1% of your users to convert is to explore what's standing in the way of the other 99% and then fixing it for them—not simply applying a best-practice-band-aid.
The good news is, your users are already telling you what they need from your site or product—they're telling you what's missing, where they get stuck, and what needs to improve—you just need to know where to look and take action based on what you learn.
Make behavior analytics an ongoing cycle of learning
Behavior analytics strategy isn't just a once-off, sequential checklist you work through and then file away. It's an iterative, cyclical process that allows you to perpetually learn from your customers so you can help them reach their goals—so you can reach yours.
Explore behavior analytics use cases for inspiration, and keep each cycle on track with the user behavior analytics behavior analytics checklist.
FAQs about behavior analytics strategy
Your behavior analytics strategy is unique to how your users behave on your website or product. To understand user behavior, track actions using event tracking tools and collect data like:
Clicks and taps: see what users engage with or ignore, and issues they experience
Mouse movements: understand how users progress through pages
Scrolling: learn whether users reach important page elements
Navigation and UX: follow your users from page to page to understand their experience
User feedback: direct feedback in users' own words
These data sources will inform your strategy and help you identify and prioritize fixes and updates to your website or app to improve the user experience and customer retention.


