![[Visual] e-commerce home page - stock image](http://images.ctfassets.net/gwbpo1m641r7/48LwhhIBbtyQTIlfcYjn1a/dd9430036a248ce594ef151965365a7f/AdobeStock_846417258.png?w=1280&q=85&fit=scale&fm=avif)
You're collecting more data than ever. Every tool you use tracks something, and the numbers keep piling up.
But that data sits scattered across systems that don't talk to each other, so you can't fully trust it, connect it, or act on it in time. When the answer you need is buried in 5 different tools, you fall back on gut feel instead.
A modern digital analytics data stack fixes that. It's the set of connected tools that collect, store, clean, and analyze your data so every team works from one trusted source.
This guide is for digital marketing, analytics, product, and CX and UX teams at mid-market and enterprise brands. You'll learn the layers that make up the stack, how they fit together, and how to build one step by step.
Key insights
A modern digital analytics data stack is a set of connected cloud tools. Together they collect, store, prepare, and analyze your data so you can act fast.
The 'why' (known as behavioral data) matters as much as the 'what.' Dashboards show what happened through metrics, while behavioral data shows why users act the way they do. You need both types of data to reach your goals.
The best stacks are built around a business goal, then grown one layer at a time. So, start with a question, and then find the best tools available to collect the data needed to answer your question.
What is a modern digital analytics data stack?
A modern digital analytics data stack is the set of cloud-based tools that work together to collect, store, transform, and analyze the data your website and apps produce.
In plain terms, the stack moves raw data from where it's created to a place where your team can make sense of it and act.
The word 'stack' describes how these tools are layered. Each layer depends on the one below it, and each one does a specific job.
That setup makes a modern stack flexible, because you can swap a single tool without rebuilding everything.
It also runs in the cloud instead of on your own servers, so it scales up when you need more power and down when you don't, and you only pay for what you use.
How a modern stack differs from a legacy data stack
A legacy data stack runs on physical servers you own and maintain, while a modern stack runs on cloud services you rent. That difference shows up in cost, speed, and how easily your team can get to the data.
With a legacy stack, you pay for servers whether you use them or not, and adding capacity means buying and setting up new hardware. A modern stack charges you for what you actually use, and you can scale up or down in minutes. Legacy systems often take longer to query because they weren't built to handle today's data volume. And getting access usually means waiting on IT to set up a new server or account—with a modern stack, anyone with permission can log in and start pulling data themselves.
The other big shift is the order of operations. Older stacks used ETL (extract, transform, load), which transformed data before loading it into storage. This means that if you wanted to change how the data looked later, you had to redo the whole process from the start.
Modern stacks use ELT (extract, load, transform), which loads raw data first and transforms it later inside the warehouse. ELT is more flexible, because you keep the raw data and can remodel it whenever your questions change.
Feature | Legacy data stack | Modern data stack |
|---|---|---|
Infrastructure | On-premises servers | Cloud-native services |
Scaling | Manual, hardware-bound | Elastic, automatic |
Data flow | ETL into rigid warehouses | ELT into flexible warehouses |
Integration | Monolithic, vendor lock-in | Modular, best-of-breed tools |
Access | IT-controlled reports | Self-service analytics |
The core layers of a modern digital analytics data stack
Most modern stacks share the same basic shape. Data comes in, gets stored, is cleaned and modeled, and then becomes insight that people use.
The layer names vary between teams, but the flow stays the same. Here are the 6 layers you'll find in almost every stack.
1. Data sources
Data sources are where your raw data is created. These include your website and apps, your customer relationship management (CRM) system, advertising platforms, and product events.
Each source produces messy, unconnected data that needs to be brought together before it's useful.
2. Data ingestion and the data pipeline
Data ingestion is the process of moving data from your sources into central storage. The path that data travels along is called a data pipeline.
Ingestion tools like Fivetran, Airbyte, and Stitch use ready-made connectors to pull data automatically, so your team doesn't have to build that plumbing by hand.
3. Cloud data warehouse and data lake
A cloud data warehouse is the central place where your organized data lives, ready for analysis. Popular options include Snowflake, Google BigQuery, and Amazon Redshift.
A data lake is different. It stores raw, unstructured data in low-cost storage before it's shaped.
Here's the simple way to tell them apart: a warehouse holds data that's ready to use, while a lake holds data that's still raw.
4. Data transformation and modeling
Raw data is rarely clean enough to analyze right away. Data transformation is the step where you remove errors, standardize formats, and apply business logic so numbers mean the same thing to everyone.
Tools like dbt let your team write these changes in a way that's version-controlled and reusable.
5\. Business intelligence and analytics
Business intelligence (BI) tools turn modeled data into dashboards, reports, and charts that people can read. This is where self-service analytics comes in, which lets business users answer their own questions instead of waiting on a data team.
Dashboards are great at showing what happened, but they rarely explain why. That's where behavioral and experience analytics help.
With Session Replay, you can watch real recordings of user sessions and see exactly where people hesitate or give up.
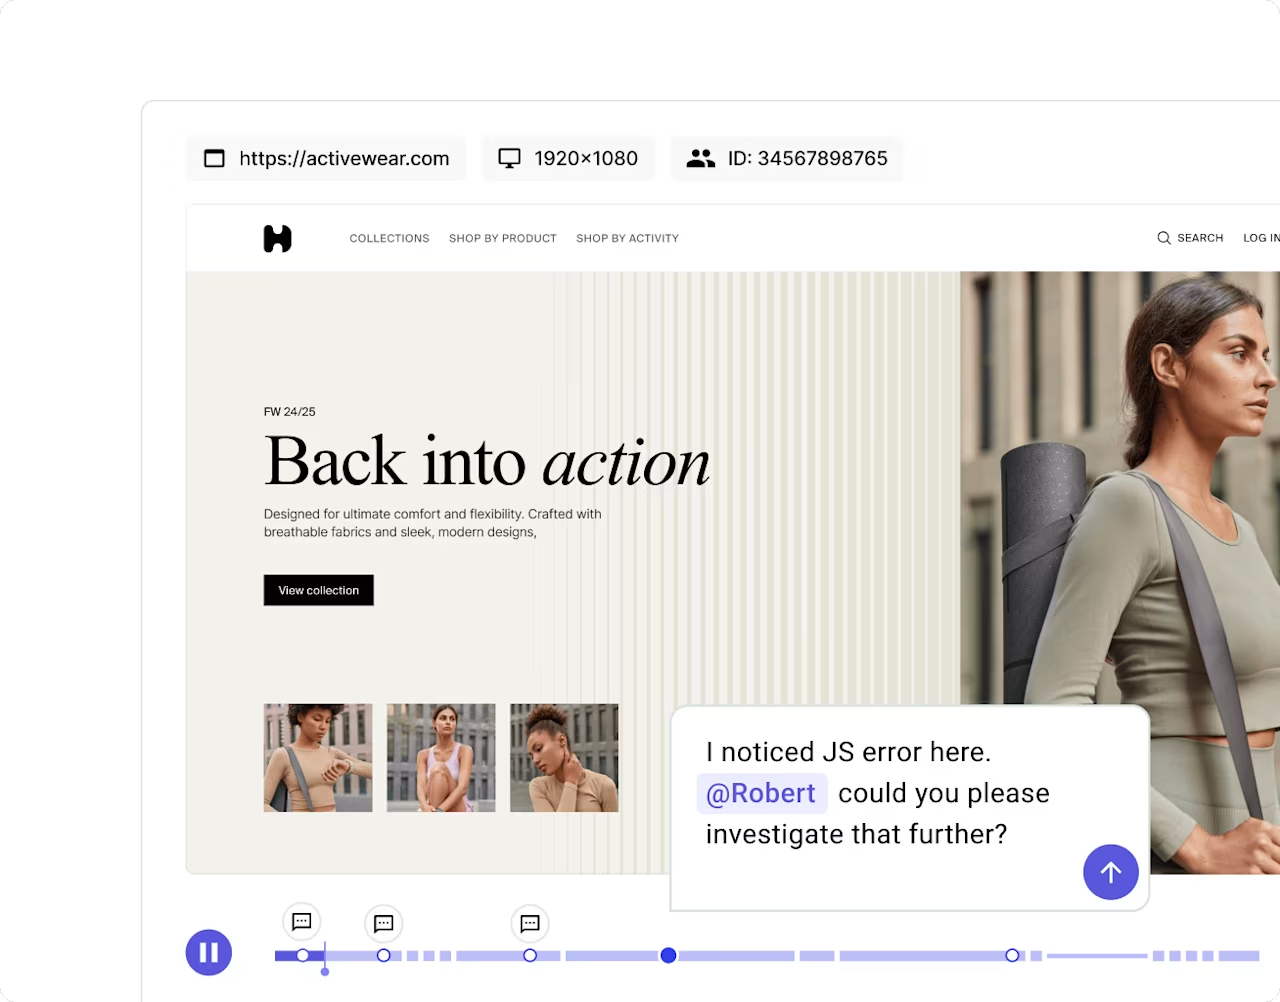
Heatmaps show you where users click, scroll, and focus their attention, so you can spot the parts of a page that help or hurt.
![[Visual] Contentsquare-vs-Medallia-vs-Qualtrics-revenue-zone-heatmaps](http://images.ctfassets.net/gwbpo1m641r7/5TvIVXAw53lVIvJMesWSeX/dd1a4e7d8d9d2bd1754e75e7eb6f402a/Contentsquare-vs-Medallia-vs-Qualtrics-revenue-zone-heatmaps.png?w=1228&q=85&fit=scale&fm=avif)
Together, Heatmaps and Session Replay add the human context behind the numbers on a chart.
6. Data activation and orchestration
Data activation, often called reverse ETL, pushes insights from the warehouse back into the tools your teams use every day, like your CRM or marketing platform.
Data orchestration is the layer that schedules and coordinates these jobs, so they run in the right order and you notice quickly when something breaks.
Where digital experience analytics fits in the stack
Most stacks are very good at answering 'what happened' and much weaker at answering 'why.' A dashboard can tell you conversion dropped, but not what frustrated the users who left.
Digital experience analytics fills that gap. It's the practice of studying how real users behave on your site, click by click, so you can see the reasons behind a metric.
This matters more than ever. In our recent Benchmarks Report, built on 99 billion web and app sessions across 6,500+ websites, we found that website visits have dropped 3.8% YoY. As website traffic drops, understanding user behavior to retain your traffic is increasingly important.
Behavioral and experience data
Behavioral data records what users do on your site, like the pages they view, the paths they take, and the moments they get stuck.
It's different from the totals in a warehouse, because it shows individual actions in context. It's the layer that explains the story behind a metric.
Connecting experience data to your warehouse
Experience data is most powerful when it sits alongside the rest of your stack.
Instead of simply knowing which page causes most visitors to exit, you'll know why users are exiting and can pinpoint the exact elements turning them away.
Data Connect syncs behavioral data straight into cloud warehouses like Snowflake, BigQuery, Redshift, and Databricks, so you can join it with your revenue and marketing data.

From there, Sense lets you ask questions in plain language and get answers back in seconds, so you don't have to wait on a manual analysis.
![[Visual] Sense-analyst text](http://images.ctfassets.net/gwbpo1m641r7/4dqiTB7LQNzyw1cpPlLuov/4890be37219c2344bf2e1ede7f9c2022/Sense-analyst_text.png?w=1280&q=85&fit=scale&fm=avif)
How to build a modern digital analytics data stack
You don't need to build the whole stack at once. The best approach is to start small, prove value, and add layers as you go, so here are 6 steps that keep the work focused.
1. Start with a business question: begin with a decision you want to support, like reducing checkout drop off. A clear question tells you which data and tools you actually need, and it stops you from buying software you'll never use.
2. Choose a cloud data warehouse: pick a cloud data warehouse sized to your data and budget. Most teams choose Snowflake, BigQuery, or Databricks, because they scale easily and connect to the rest of the stack.
3. Connect your data sources: use an ingestion tool to pull data from your core systems, like your website, CRM, and ad platforms. Start with the sources that answer your first question, then add more over time.
4. Transform and model your data: clean and model the raw data so it reflects your business logic, like how you define an active user. This step turns scattered records into trusted, analytics-ready tables.
5. Add analytics and experience insights: layer on BI for dashboards and experience analytics for the human context. Journey Analysis shows you how users move through your site page by page and where they drop off, so you can see not just that a step is failing but where it happens.
![[Visual] Contentsquare-vs-UXCam-vs-Amplitude-journey analysis](http://images.ctfassets.net/gwbpo1m641r7/6bAMOzB579iaIxjR0fSUPr/b2e10d6a2ee0fda5b984b4abb1dca78d/Amplitude-vs-UXCam-vs-Contentsquare-journey-analysis.png?w=1280&q=85&fit=scale&fm=avif)
6. Activate insights where decisions happen: push what you learn back into the tools your teams use, so insight turns into action. This closes the loop between analysis and the day-to-day work of marketing, product, and support.
What to look for when choosing data stack tools
The right tools depend on your goals, but a few qualities separate a stack that grows with you from one that holds you back. Keep these in mind as you compare your options.
Scalability and cloud-native design
Choose tools built for the cloud that scale automatically as your data and users grow.
This protects you from painful rebuilds later, when demand spikes.
Ease of use and self-service
Look for tools with clear interfaces and self-service access.
If only a few specialists can use a tool, adoption stalls and the data stays locked away.
Integration and governance
Pick tools that connect cleanly with the rest of your stack and support governance, which means clear rules for access, quality, and privacy.
Good governance keeps your data trustworthy as more people use it.
Common mistakes when building a data stack
Even strong teams hit the same avoidable problems. Watching for these mistakes will save you time and money.
Buying tools before defining the question: it's tempting to start with software, but tools without a clear goal create cost and confusion. Define the decision first, then choose the tool that supports it.
Letting tool sprawl take over: when every team adds its own tools, integration gets messy and costs climb. Keep your stack lean, and audit it regularly to remove what you no longer use.
Treating governance as an afterthought: bolting on rules for access and quality after the fact erodes trust in the data. Build governance in from the start, so your numbers stay reliable as you scale.
Ignoring the experience data that explains the numbers: a stack that only tracks metrics can show movement but never explain it. Include behavioral and experience data, so you can answer why a number changed, not just that it did.
Bringing your digital analytics data stack together
A modern digital analytics data stack isn't about owning the most tools. It's about connecting the layers so raw data becomes a clear view of your customer.
When your warehouse metrics sit next to the behavioral story behind them, every team can see not just what happened but why, and act with confidence.
FAQs one modern digital analytics data stacks
The terms overlap and are often used together, but a data stack usually emphasizes the underlying plumbing like ingestion, storage, and transformation, while an analytics stack emphasizes the tools people use to explore and act on the data.

Dana is a copywriting specialist with deep expertise in creating assets like blog posts and landing pages that position organizations as the obvious first choice in their market. She holds a Bachelor of Business Administration in Marketing and has over 10 years of experience helping leading B2B brands drive traffic and increase conversions. Having taught more than 1,000 entrepreneurs the art of persuasive copywriting, Dana brings unique insight into what resonates with audiences and delivers results.
![[Visual] Stock image - people at computers](http://images.ctfassets.net/gwbpo1m641r7/4dLS2lpl35VuAo0llA8dzU/5ac7799927c07517e600a2ae77499bf0/AdobeStock_376405487.png?w=624&q=85&fit=scale&fm=avif)