
Imagine a customer lands on your product page from a mobile ad, scrolls, and leaves—no purchase, no email signup. Crickets. Your dashboard logs it as a drop-off, and you’re already fending off questions of whether the campaign is worth the spend.
Then, three days later, that same person opens their laptop, searches your brand name, and buys.
If your analytics can’t connect activity across devices, you see two separate stories: a customer who dropped off on mobile—and a new conversion on desktop that appears to have come out of nowhere.
That’s the limitation of relying on session-level data alone: each visit gets measured on its own, which makes it harder to see the complete journey once a customer moves between devices.
Cross-device analytics closes that gap. In this article, you learn how to
Tell a genuine drop-off from a customer who’s simply continuing their journey on another device
Spot the cross-device patterns hiding in your data
Decide what to fix, what to leave alone, and who’s worth retargeting
Key insights
A mobile ‘drop-off’ and a desktop ‘conversion’ are often the same customer, not two separate outcomes—treat them as connected before deciding the drop-off is a problem
Session-based reporting can’t answer whether a customer is lost or not—you need a view that connects sessions and devices to the same user to make that call with confidence
The most valuable customer journeys often span several sessions and devices—spotting and understanding those patterns is how you find where to invest and where to fix actual friction in the user experience
What is cross-device analytics?
Cross-device analytics connects a customer’s activity across devices, sessions, and channels into one continuous journey.
Session-based analytics, the more common approach, does the opposite. It looks at each visit as a standalone event: a session starts when a user arrives on a site and ends when there is no more activity for 30 minutes after the last event or user action.
That works fine when someone browses, decides, and buys in a single sitting. It falls apart the moment they don’t.
And most customers, well, don’t. They might:
Research a product on their phone during a commute
Get interrupted before checkout
Come back on their laptop three days later to actually buy
Session-based analytics logs that as two separate visits: one from a phone that ended in a drop-off, and one from a laptop that converted. Cross-device analytics recognizes one user who visited twice—first from a phone, then later from a laptop—before eventually converting.
That difference matters more than it might seem. Session-based analytics can make it look like desktop converts better than mobile, when mobile was an essential part of the journey. With cross-device analytics, you understand how each session contributed to the conversion.
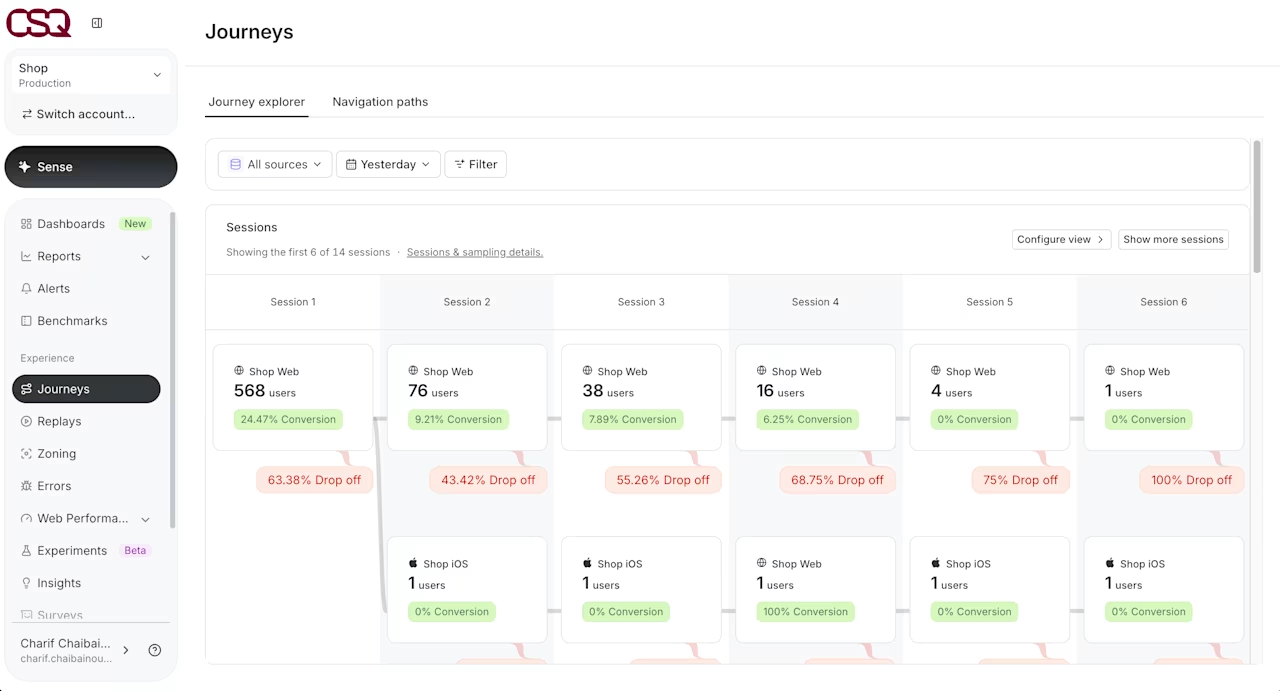
💡Pro tip: use Contentsquare’s Journey Explorer to get a cohort-level view of customers across multiple sessions and devices. That way you can see what actually happens between the first mobile visit and the moment someone converts (or doesn’t).
Why is cross-device analytics important?
Cross-device analytics matters because when you only look at individual sessions, you have an incomplete picture that can point you in the wrong direction.
For example, you might end up:
Redesigning a mobile flow that was never actually broken
Cutting budget for a campaign that’s working—just not converting on the same device it started on
Chasing ‘fixes’ for a drop-off that was really just a customer picking up where they left off
Cross-device analytics gives you the missing context to make those calls with the full journey in view, not just the fragment your session data happened to capture.
💡Pro tip: before you trust a metric on ‘lost customers’, check whether your platform can really recognize the same customer across devices—through logins, unique identifiers, and consented tracking. If it can’t, some journeys will always look more broken than they really are.
In case you’re wondering: yes, Contentsquare can do all of the above—while keeping privacy regulations top of mind. Contentsquare uses first-party, analytics-only cookies by default—and only with visitor consent (in line with regulations like GDPR). Cross-device analytics needs a way to recognize the same visitor, but that doesn’t mean tracking people across the entire web.
What’s really happening after a mobile drop-off?
A ‘drop-off’ technically means abandoning a specific workflow—like checkout—without finishing it, though the term often gets used more loosely for any non-converting visit. Underneath that label is a handful of very different mobile user journeys, and understanding them helps you decide what step to take next. Here are four patterns worth looking for before you take action:
1. Researching on mobile, buying on desktop
This one isn’t new. Mobile-for-research, desktop-for-purchase has been a familiar pattern for years—and the numbers still back it up. According to Contentsquare’s 2026 Digital Experience Benchmark report, mobile traffic outpaces desktop, with 69.9% of all traffic. But it’s not always where people feel ready to reach for their wallet.
At the same time, desktop conversions are still 70% higher than mobile ones (3.4% desktop vs. 2% mobile).
Does that mean the mobile experience is underperforming? Not necessarily. It’s just doing a different job: buyers are using mobile for research, and desktop for closing the sale.
📚 Read more in our guide on how to monitor mobile user behavior.
2. Switching between web and app
Most mobile analytics tools treat the mobile browser and the app as two separate channels, with different tracking, reports, and teams. But often, it’s the same customer toggling between the two, depending on which one’s more convenient at the moment—for example, a quick browse in the mobile browser now, the app later when they’re ready to buy.
In session-based analytics, that looks like a mobile web drop-off and a separate, unrelated app conversion. To the customer, it was one decision, made in two steps.
If your reporting keeps web and app in separate silos, you’re likely crediting the wrong channel for the sale, or penalizing the one that started it. (Learn more about how to credit conversions accurately in our multi-touch attribution blog.)
Users hop between app and web more than we expected; we now see where projects start and what blocks those starts. Aligning app and site experiences was a must. Contentsquare’s user-based data model lets us track users across platforms and sessions, which is critical when projects span phone and web.
3. Returning after a push notification on re-engagement nudge
Sometimes a customer doesn’t wander back on their own—they get a nudge. A push notification arrives, they tap it, and they re-enter the shopping flow. But a basic session view often just shows a new session, without making it clear that this session was prompted by the notification, or how it connects to the one the customer left behind.
That’s a problem, because push notifications are a powerful re-engagement channel. Opt-in rates for app push notifications average 61%, and open rates roughly triple when the message relates to the shopping task the customer was actually doing—climbing from about 4% for a generic push to over 14% for one built around their specific behavior.
The bottom line is that sometimes a drop-off is just a pause, waiting for a well-timed, well-targeted prompt to continue.
4. Taking several sessions to convert
Some purchases take longer to decide on—a few extra sessions to compare options or check reviews. But that doesn’t always show up as progress in session-based reporting. Each visit that doesn’t end in a purchase or sale looks like a fresh drop-off, even if it’s actually someone getting closer to buying.
The data backs this up: returning visitors convert at nearly double the rate of new ones—2.9% compared to 1.7%.
Treat every one of those earlier sessions as a separate, failed attempt, and you’ll miscount how many chances it takes to win a customer—and undervalue the visits that got them there.
How to turn a cross-device pattern into action
Understanding cross-device patterns is only part of the job. Next comes figuring out what to do about it—and that depends on whether the customer is coming back or truly gone.
1. Check whether visitors came back—and how
Not every non-converting session deserves the same response. Some customers are just pausing mid-journey, while others aren’t coming back at all.
To tell the difference, use a customer journey analytics tool like Contentsquare’s Journey Explorer to answer questions like:
Did this visitor return on a different device within a reasonable window for this type of purchase?
When they came back, did they pick up close to where they left off—or start over entirely?
Did they eventually convert, or drop off again?
Customers who return and convert weren’t lost in the first place—they just needed time, or a nudge from a retargeting ad or email. But customers who never return are worth further investigation to see how you can improve their experience.
This distinction matters differently depending on your team—Marketing cares whether the fizzled-out cohort is worth retargeting, Customer Relationship Management (CRM) wants to know what nudge might work, and Product wants to know if there’s a fixable friction point. But none of that can be answered yet. That’s where the next step comes in.
![[Visual] journey analysis returning customers](http://images.ctfassets.net/gwbpo1m641r7/3ciHvN72GQXQxhIMnswabb/96ca0360a19a87d1d5b398e4dd1414ce/journey_analysis_returning_customers.png?w=624&q=85&fit=scale&fm=avif)
Use Contentsquare’s journey analytics tools to analyze how users leave and return.
2. Dig into why customers are really lost, and then act
This is where that Product and CX lead gets resolved, and where a broad pattern turns into a definite answer.
If you’re using Contentsquare, the workflow looks like this:
Spot the pattern in Journey Explorer: see the cohort’s full path across sessions and devices, including where it splits between converters and non-converters
Surface unusual behavior with our AI assistant Sense Analyst: ask it to flag significant behavior within the cohort, like a high-value group of shoppers who research across devices
Confirm your finding with Funnel Analysis and Session Replay: check where users actually drop off across devices and sessions, and then watch real replays to see the friction, like a call-to-action button that’s broken or a form that causes fatigue
![[Visual] funnel analysis](http://images.ctfassets.net/gwbpo1m641r7/65zxGlG5RjGXrUnlwWofOE/6e0a2b9a6b812670f6c47e3effdb72a6/funnel_analysis.png?w=624&q=85&fit=scale&fm=avif)
See conversions and drop-offs by funnel step with Funnel Analysis, and then hit the ‘Play’ button to jump directly to relevant session replays.
Once you’ve done that, you can take the next step with confidence—whether that’s prioritizing a product improvement, adjusting how a campaign gets credited, or bringing back the genuinely lost cohort.
Tell a drop-off from a detour
Think about that customer from the start of this blog post—the one who left on mobile and looked like a lost sale. They weren’t lost. They were mid-journey, and three days later, they bought. Session data couldn’t see that. Cross-device analytics can.
That’s the shift worth making: instead of treating every non-converting session as a final verdict, start checking whether it’s actually just one step in a longer path. That changes the way you view their journeys, nurture the relationships, and allocate your budget.
FAQs about cross-device analytics
Cross-device analytics connects a customer’s activity across devices and sessions into a single, continuous journey—instead of treating each visit as its own isolated event.

Kelly is a freelance content writer for Contentsquare. She's been writing and editing content for SaaS clients and agencies for over three years. When she's not working, Kelly enjoys reading, solving crossword puzzles, cooing over her cats and dogs, and savoring a good cup of coffee.
![[visual] Blog - anscombe quartet stock image](http://images.ctfassets.net/gwbpo1m641r7/5cPY8sQJxGIEOu052njiCb/b6ff0931add6905d4ff939909663c8f6/adam-satria-uXLgmicKSi4-unsplash.jpg?w=624&q=85&fit=scale&fm=avif)