![[Visual][experience client] improve](http://images.ctfassets.net/gwbpo1m641r7/3HaprV0AM5l5D58FDpcSME/e30bcd2d57361b1d53620dd510363c35/customer-experience-improve.jpeg?w=1280&q=85&fit=scale&fm=avif)
There was a healthy demand for travel services in 2023, and this was reflected in metrics measuring the customer experience in Travel & Hospitality—with sites seeing increased traffic and a notable uptick in revenue per visit.
But these positive results were part of a mixed bag of performance metrics that indicate lingering challenges to overcome in the year ahead.
The travel & hospitality sector faced its fair share of hurdles last year, with frustration levels reaching an all-time high and bounce rates seeing a slight bump from the previous year**.**
While mobile devices dominated the landscape in terms of visitation, the shorter session durations associated with them are worrisome, particularly as bounce rates climbed across both mobile and desktop platforms.
Additionally, conversion rates on paid and organic social remained disappointingly low, with direct and paid channels emerging as the primary drivers of conversions.
But what does this all mean for you?
In this blog post, we’ll take a deep dive into these five key metrics, equipping digital leaders with insights to navigate the nuances of 2024 and beat industry benchmarks.
For additional insights and strategies (and to compare the performance of Travel & Hospitality against other industries) make a beeline for Contentsquare’s 2024 Digital Experience Benchmarks.
1. Frustration is at an all-time high
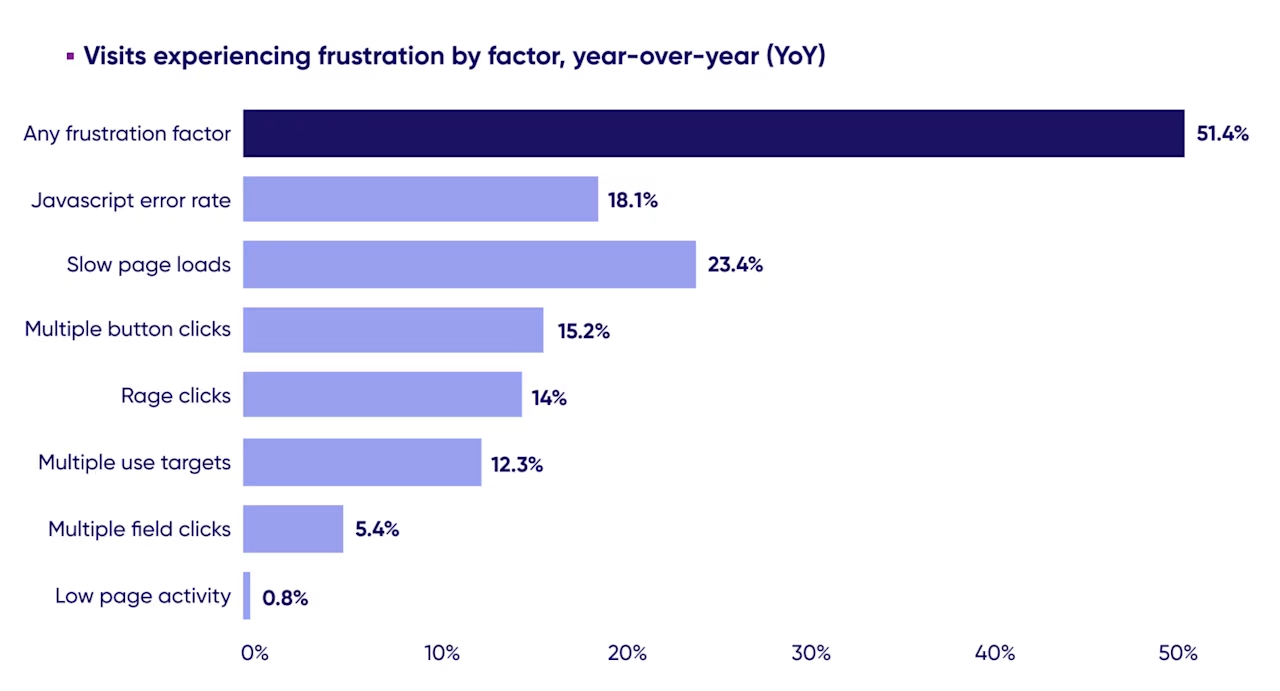
Visitor frustration reached an all-time high in 2023, affecting a whopping 51.4% of all visits, the highest across all 10 industries surveyed in our 2024 Digital Experience Benchmark report.
Frustration is measured by instances of specific moments of friction observed in the on-site experience, including JavaScript errors, slow page loads or rage clicks (when visitors click repeatedly and quickly on a malfunctioning or non-interactive page element).
These (often apparently small) moments of frustration have a major impact on the quality of experiences and can lead to increased bounce rates and reduced engagement, ultimately affecting conversion rates.
In 2023, JavaScript errors (18.1%) and slow page loads (23.4%) dominated frustration in the travel and hospitality sector.
To combat this, travel & hospitality brands must implement rigorous testing to catch such errors early, optimize website infrastructure to ensure faster loading times and prioritize lightweight design elements.
2. Google’s Core Web Vitals (CWVs) aren’t being met
On the topic of frustration, it’s imperative for brands to factor in Google’s Core Web Vitals if they want an objective set of site performance standards.
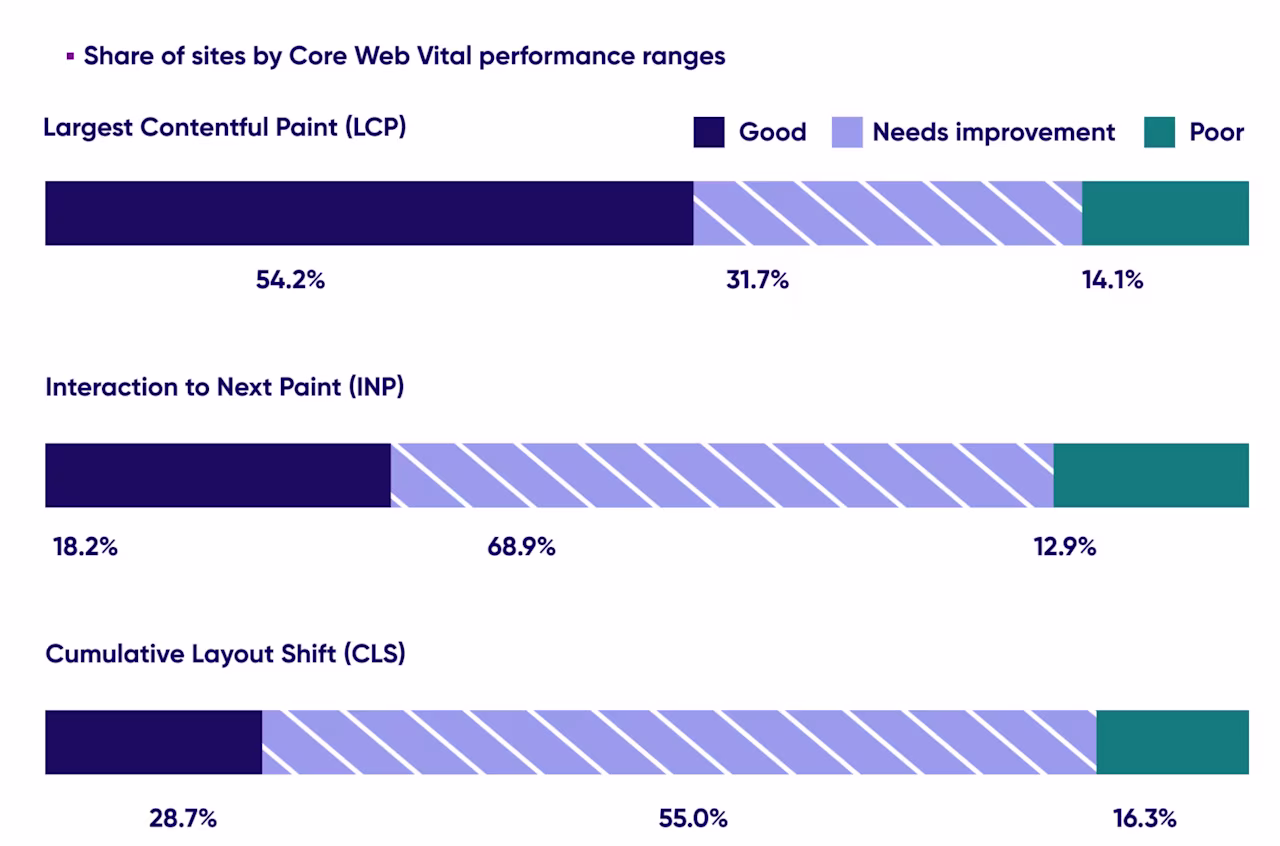
Share of sites by Core Web Vital performance ranges
As we can see in the chart above, too many sites still fail to meet the mark for the legacy measures of LCP and CLS.
This year, it’s also important to take note of the latest Core Web Vital: Interaction to Next Paint. This measures the time it takes for a user to interact with a webpage (e.g. clicking a button or scrolling) after the initial loading of the page, and is crucial for assessing user interface (UI) responsiveness.
To achieve an optimum INP rating, brands need to prioritize critical rendering, minimize render-blocking resources and reduce server response times.
3. Mobile dominated traffic, but mobile bounce rates rose
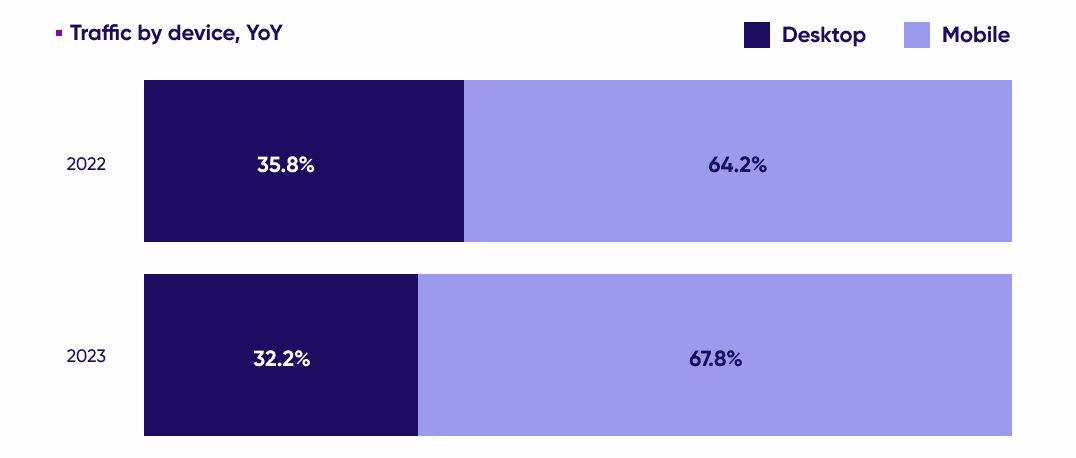
Traffic by device
Mobile dominated in 2023, capturing 67.8% of traffic, an increase of 3.5 percentage points from the previous year.
However, this increase in traffic share is worrisome when factoring in the growth of mobile bounce rates.
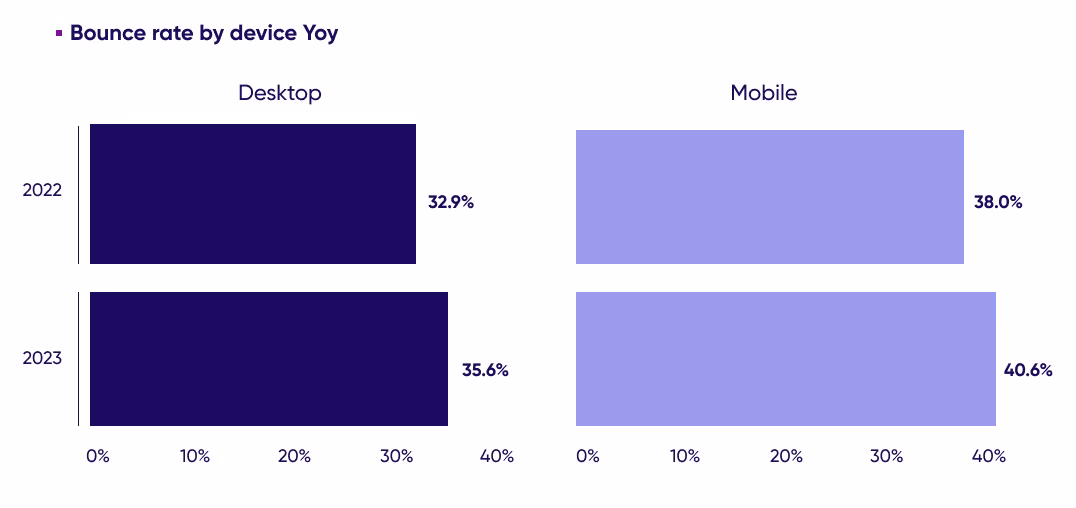
Bounce rate by device year-on-year
Brands should look into optimizing page load speeds by compressing images and reducing unnecessary scripts, prioritize mobile-friendly design and ensure responsive layout, streamline content and make information digestible at a glance and reduce friction in conversion paths by simplifying the checkout or conversion process for mobile users.
4. New vs. returning visitors pose an opportunity
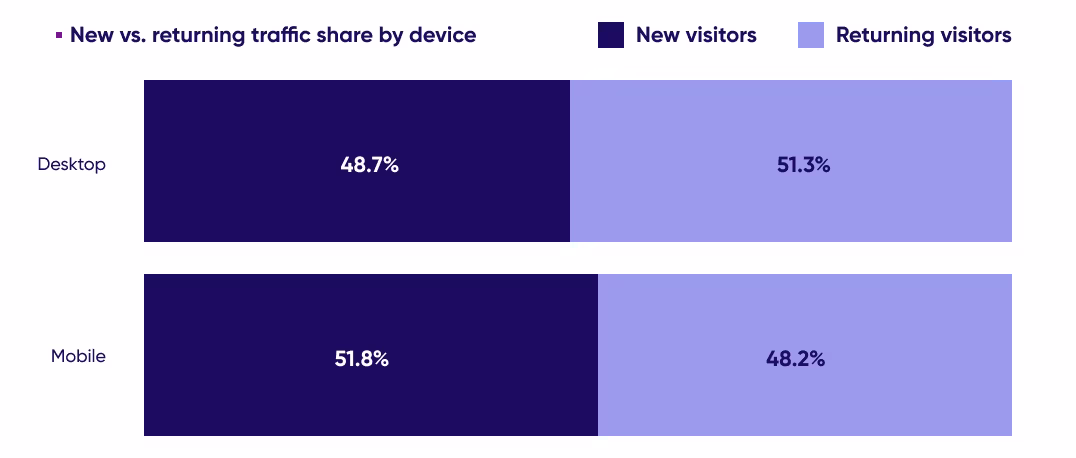
New vs. returning traffic share by device
The (almost) equal distribution between new and returning visitors highlights the importance for brands to segment and personalize traffic based on visitor types in 2024. These two segments should be treated differently with personalized journeys and content to ensure deeper engagement and reduced bounce rates.
5. Social has minimal impact on traffic share
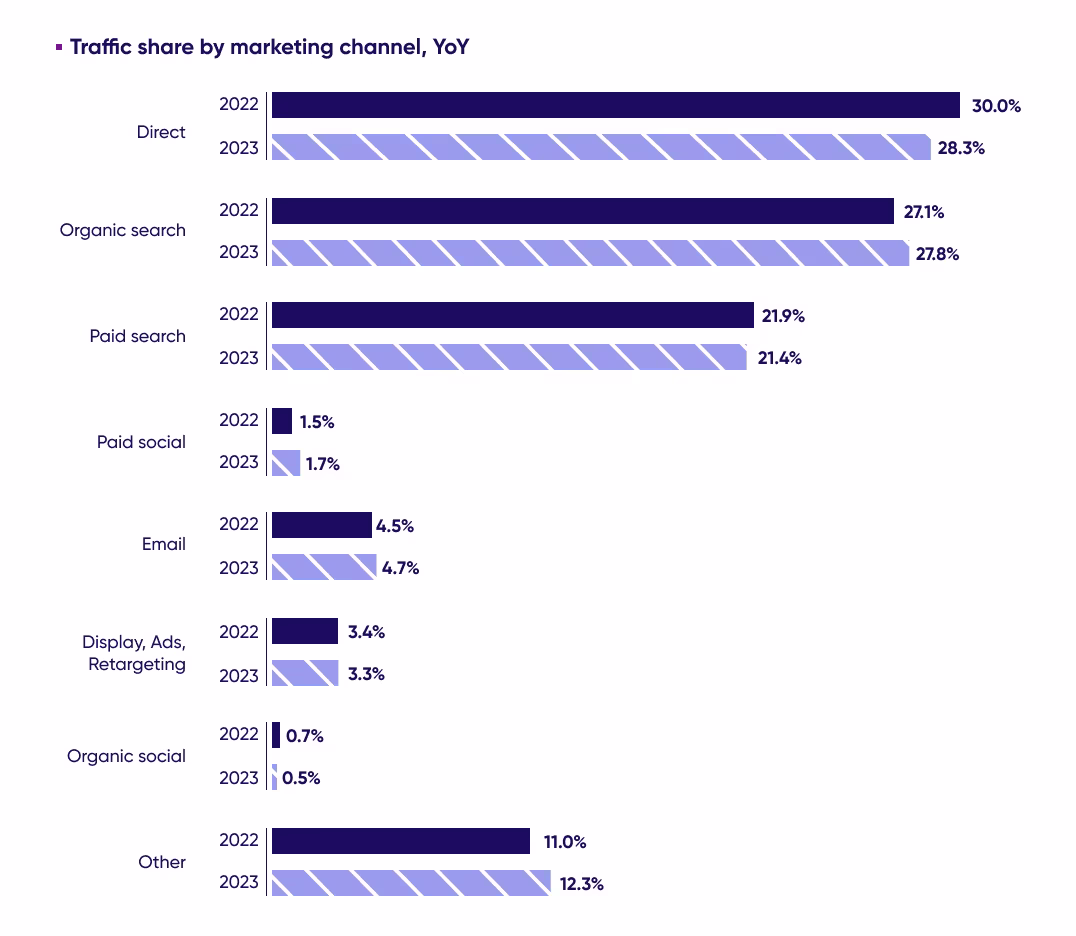
Traffic share by marketing channel, year-on-year
Direct (28.3%), organic (27.8%) and paid search (21.4%) drove a majority of traffic share for the travel & hospitality industry in 2023, with only organic search seeing a tiny increase from the previous year. More interestingly, paid social (1.7%) and organic social (0.5%) contributed the least to the marketing mix.
Considering that this industry lends itself particularly well to visual storytelling, with travel influencers and your average traveler posting a wealth of user-generated content, it presents travel & hospitality teams with an excellent opportunity to invest in social media.
Using platforms like Instagram and Pinterest and collaborating with influencers to create aspirational content makes for a powerful tool, allowing brands to expand their reach, engage with their audience and drive bookings and revenue.
Looking for more insights? Access the 2024 Digital Experience Benchmarks for additional insights that will help guide your digital strategy this year.
The customer experience in Travel & Hospitality is going places—with Contentsquare
Wouldn’t it be great to be able to access the kind of valuable insights found in our Benchmark report on a 24/7/365 basis? With Contentsquare Cloud, you can.
Get rich, contextual insights into how your site and/or app visitors are behaving and feeling with features like Zone-Based Heatmaps, Customer Journey Analysis and Session Replay.
Leverage our AI Analytics Engine to prioritize actions based on their impact to key business metrics.
Track down and tackle friction in your journeys with Digital Experience Monitoring, which brings client-side technical errors and UX obstacles to your immediate attention—and monitors your all-important site speed.
Compare your digital experience metrics to your industry peers in real-time so you can meet and beat the benchmark with our platform’s Benchmarks capability.
Contentsquare lets travel and hospitality companies achieve the holistic understanding of their customers they need to drive conversions, loyalty and growth based on data analytics on Travel.
Want to learn more? Let us show you around…
![[Visual] Jack Law](http://images.ctfassets.net/gwbpo1m641r7/6K99ulcVqLqKGyNZUaPiF8/145af0b27131005d862c790ddcafb3c5/Jack_Law.jpg?w=1280&q=85&fit=scale&fm=avif)
Jack has been creating and copywriting content on both agency and client-side for seven years and he’s ‘just getting warmed up’. When he’s not creating content, Jack enjoys climbing walls, reading books, playing video games, obsessing over music and drinking Guinness.