
You have more data than ever—but turning it into clear, actionable insight? That’s the hard part.
Many teams track metrics across countless tools and touchpoints, yet still struggle to answer key questions about what’s working, what’s not, and why. Without a digital analytics strategy, data stays disconnected, and decisions are driven by gut feelings instead of real evidence.
But a strong strategy changes that: it brings structure, clarity, and focus to your efforts, helping you connect user behavior to business outcomes and prioritize what truly moves the needle.
In this guide, learn how to build a strategy that actually delivers—one that turns digital data into measurable results.
Key insights
Think journeys, not touchpoints: customers don't experience your brand in silos, so your analytics shouldn't either. Focus on understanding complete user journeys across sessions and devices to identify what truly drives long-term value.
Choose comprehensive platforms over individual tools: tool sprawl creates more problems than it solves. An all-in-one platform, such as one that gives you analytics and voice of customer feedback, eliminates data silos and gives teams a unified view they can actually act on.
Democratize insights across your organization: when analytics are accessible to non-technical team members through AI summaries and plain-language reporting, your entire organization can make data-driven decisions instead of relying on a few analytics experts.
5 steps to build your digital analytics strategy
Strong analytics strategies are rooted in clarity—about what you’re measuring, why it matters, and how it will drive action. This 5-step framework helps you focus on key metrics, align your teams around shared goals, and turn insight into impact.
1. Align analytics with business objectives
Without clear business alignment, analytics efforts often become disjointed and fail to influence real decisions. This step grounds your entire strategy in shared, outcome-driven goals.
Think about it: if your business goal is to increase customer lifetime value (CLTV) but your analytics focuses solely on website traffic, you're missing the bigger picture. The most powerful analytics strategies start with you identifying what success looks like for your organization, and then working backward to determine which metrics actually matter.
Here's how to create that alignment:
Start with your core business objectives. Whether you aim to increase revenue, improve retention, or expand your market share, your analytics should align with these objectives. Treat these goals as your north star—every metric you track should align with them.
Identify the customer behaviors that drive those goals. Once you know the outcome you want, define the key user actions that influence it. For instance, if reducing churn is a priority, look at digital analytics metrics like time to first value, product usage frequency, or support ticket volume.
Align teams around shared, customer-centric metrics. Different departments care about different metrics, but the customer journey connects them all. Choose key performance indicators (KPIs) that reflect end-to-end customer experience—like CLTV, Net Promoter Score® (NPS®), or feature adoption—that everyone can rally around, and add them to your Contentsquare dashboard for easy access.
💡Pro tip: use Contentsquare to create and customize digital analytics dashboards that align perfectly with your business objectives. Start from a dashboard template—geared toward acquisition, retention, or feature adoption, for example—or start from a blank page to add your team’s most requested charts and metrics.
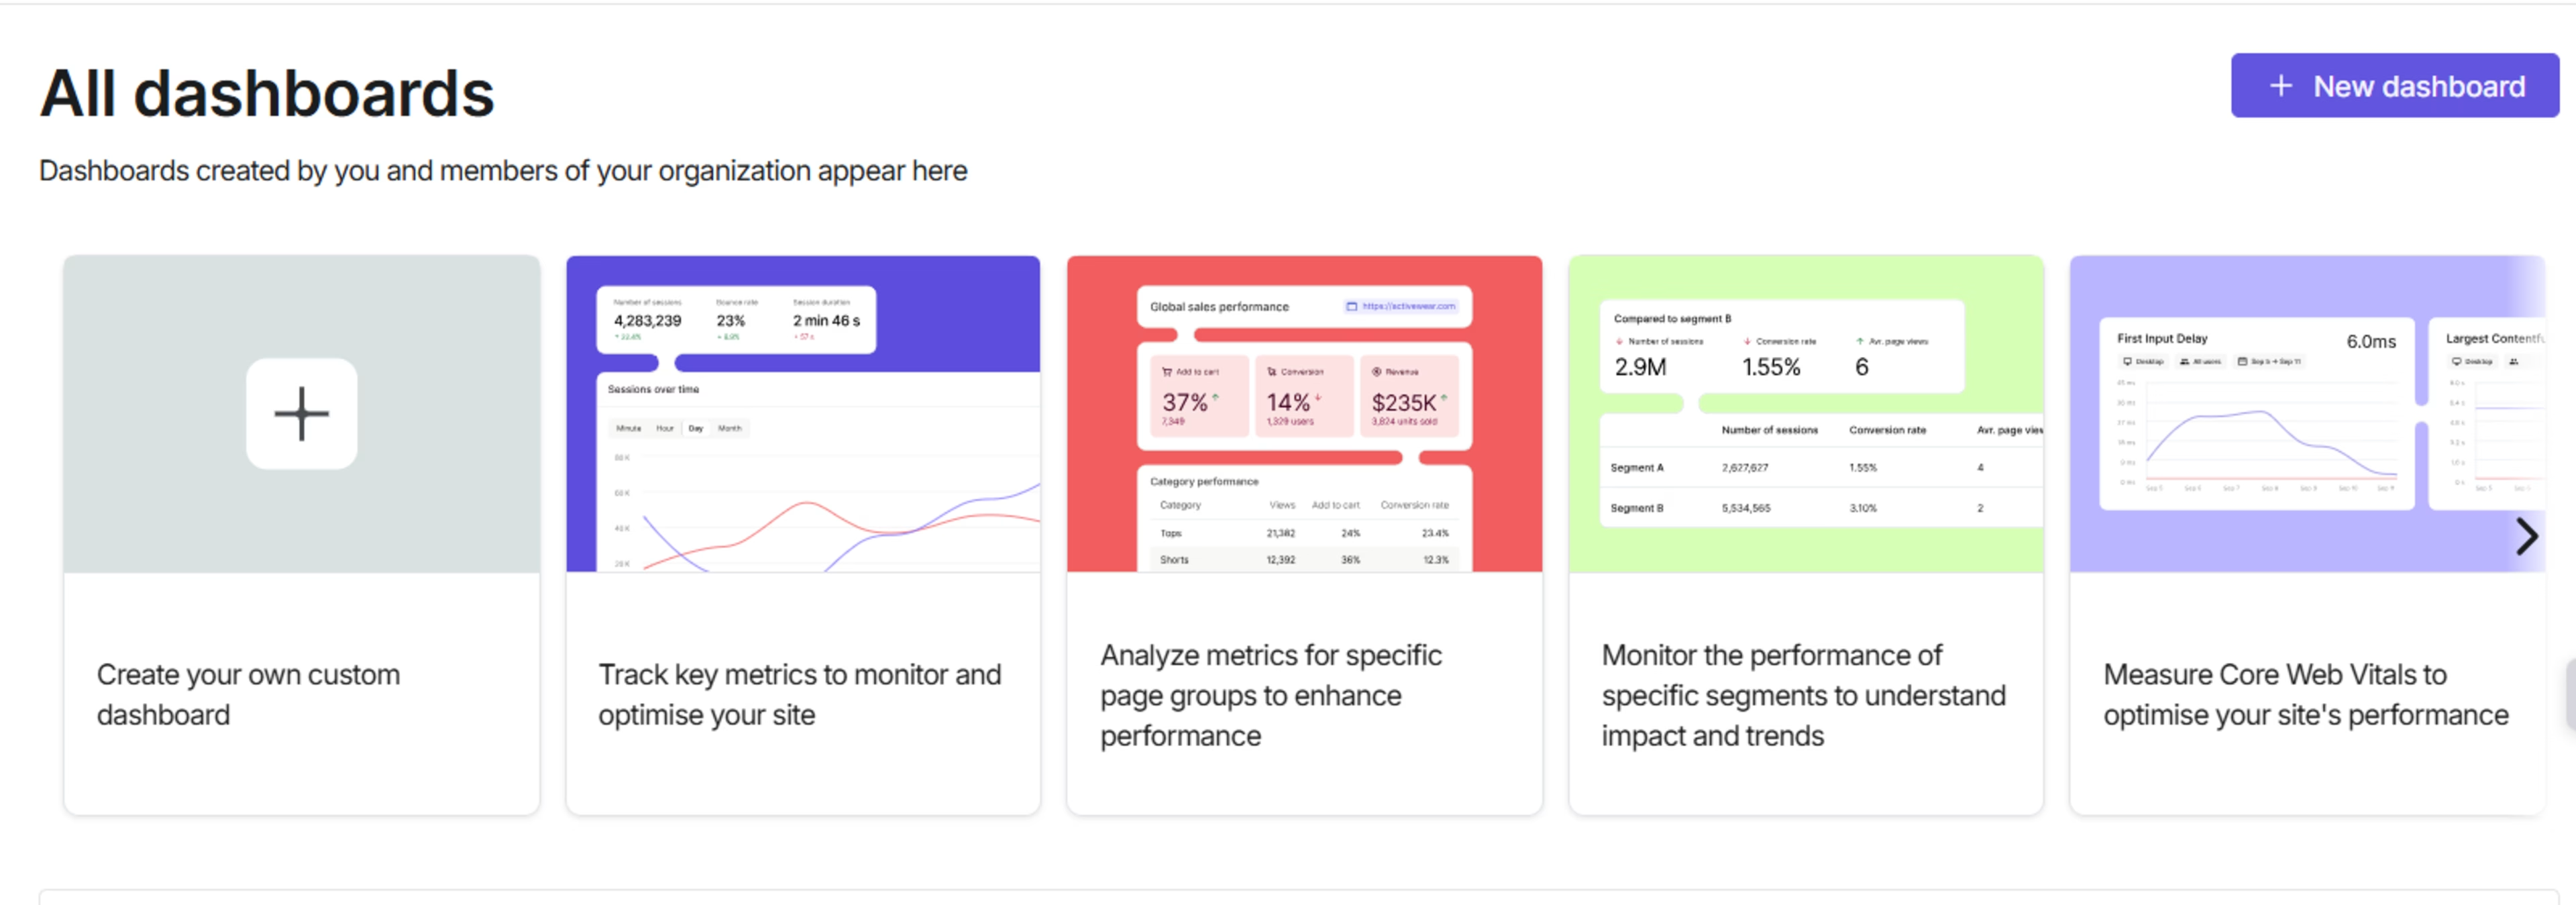
Use Contentsquare to create dashboards your teams actually want to check out
2. Map your customer’s digital journey
Too often, businesses track touchpoints in isolation—think homepage conversions, email open rates, and app engagement. Without a connected view, it's impossible to see how a user goes from a first website visit to a purchase three weeks later.
Mapping a customer’s journey helps you uncover patterns that lead to long-term growth. It connects behavior across sessions, devices, and channels—so you can focus your digital analytics strategy where it counts.
Here’s how to do it:
Outline the full customer journey across every channel. Identify all the places where customers interact with your brand: paid ads, landing pages, mobile app screens, onboarding emails, support chats, and more. For example, use Contentsquare’s Journey Analysis to map how users move between touchpoints and sessions. Then, use Heatmaps to visualize what they do on individual pages—where they click, scroll, and engage—so you can understand which elements drive them forward in their journey.
Spot the moments that truly move the needle. Not all user interactions carry the same weight. Ask Sense AI, Contentsquare’s natural-language assistant, to look for behavioral patterns in successful customer journeys to uncover high-impact moments—such as feature adoption, content viewed before conversion, or drop-off points before churn. Use these insights to inform your product and digital marketing decisions.
Break down silos between acquisition, engagement, and retention. Use analytics platforms that link behavior across sessions and lifecycle stages. For example, Contentsquare’s User Lifecycle Extension in Experience Analytics connects the dots between acquisition sources and long-term retention, helping you optimize customer journeys, marketing campaigns, and digital experiences for lifetime value.
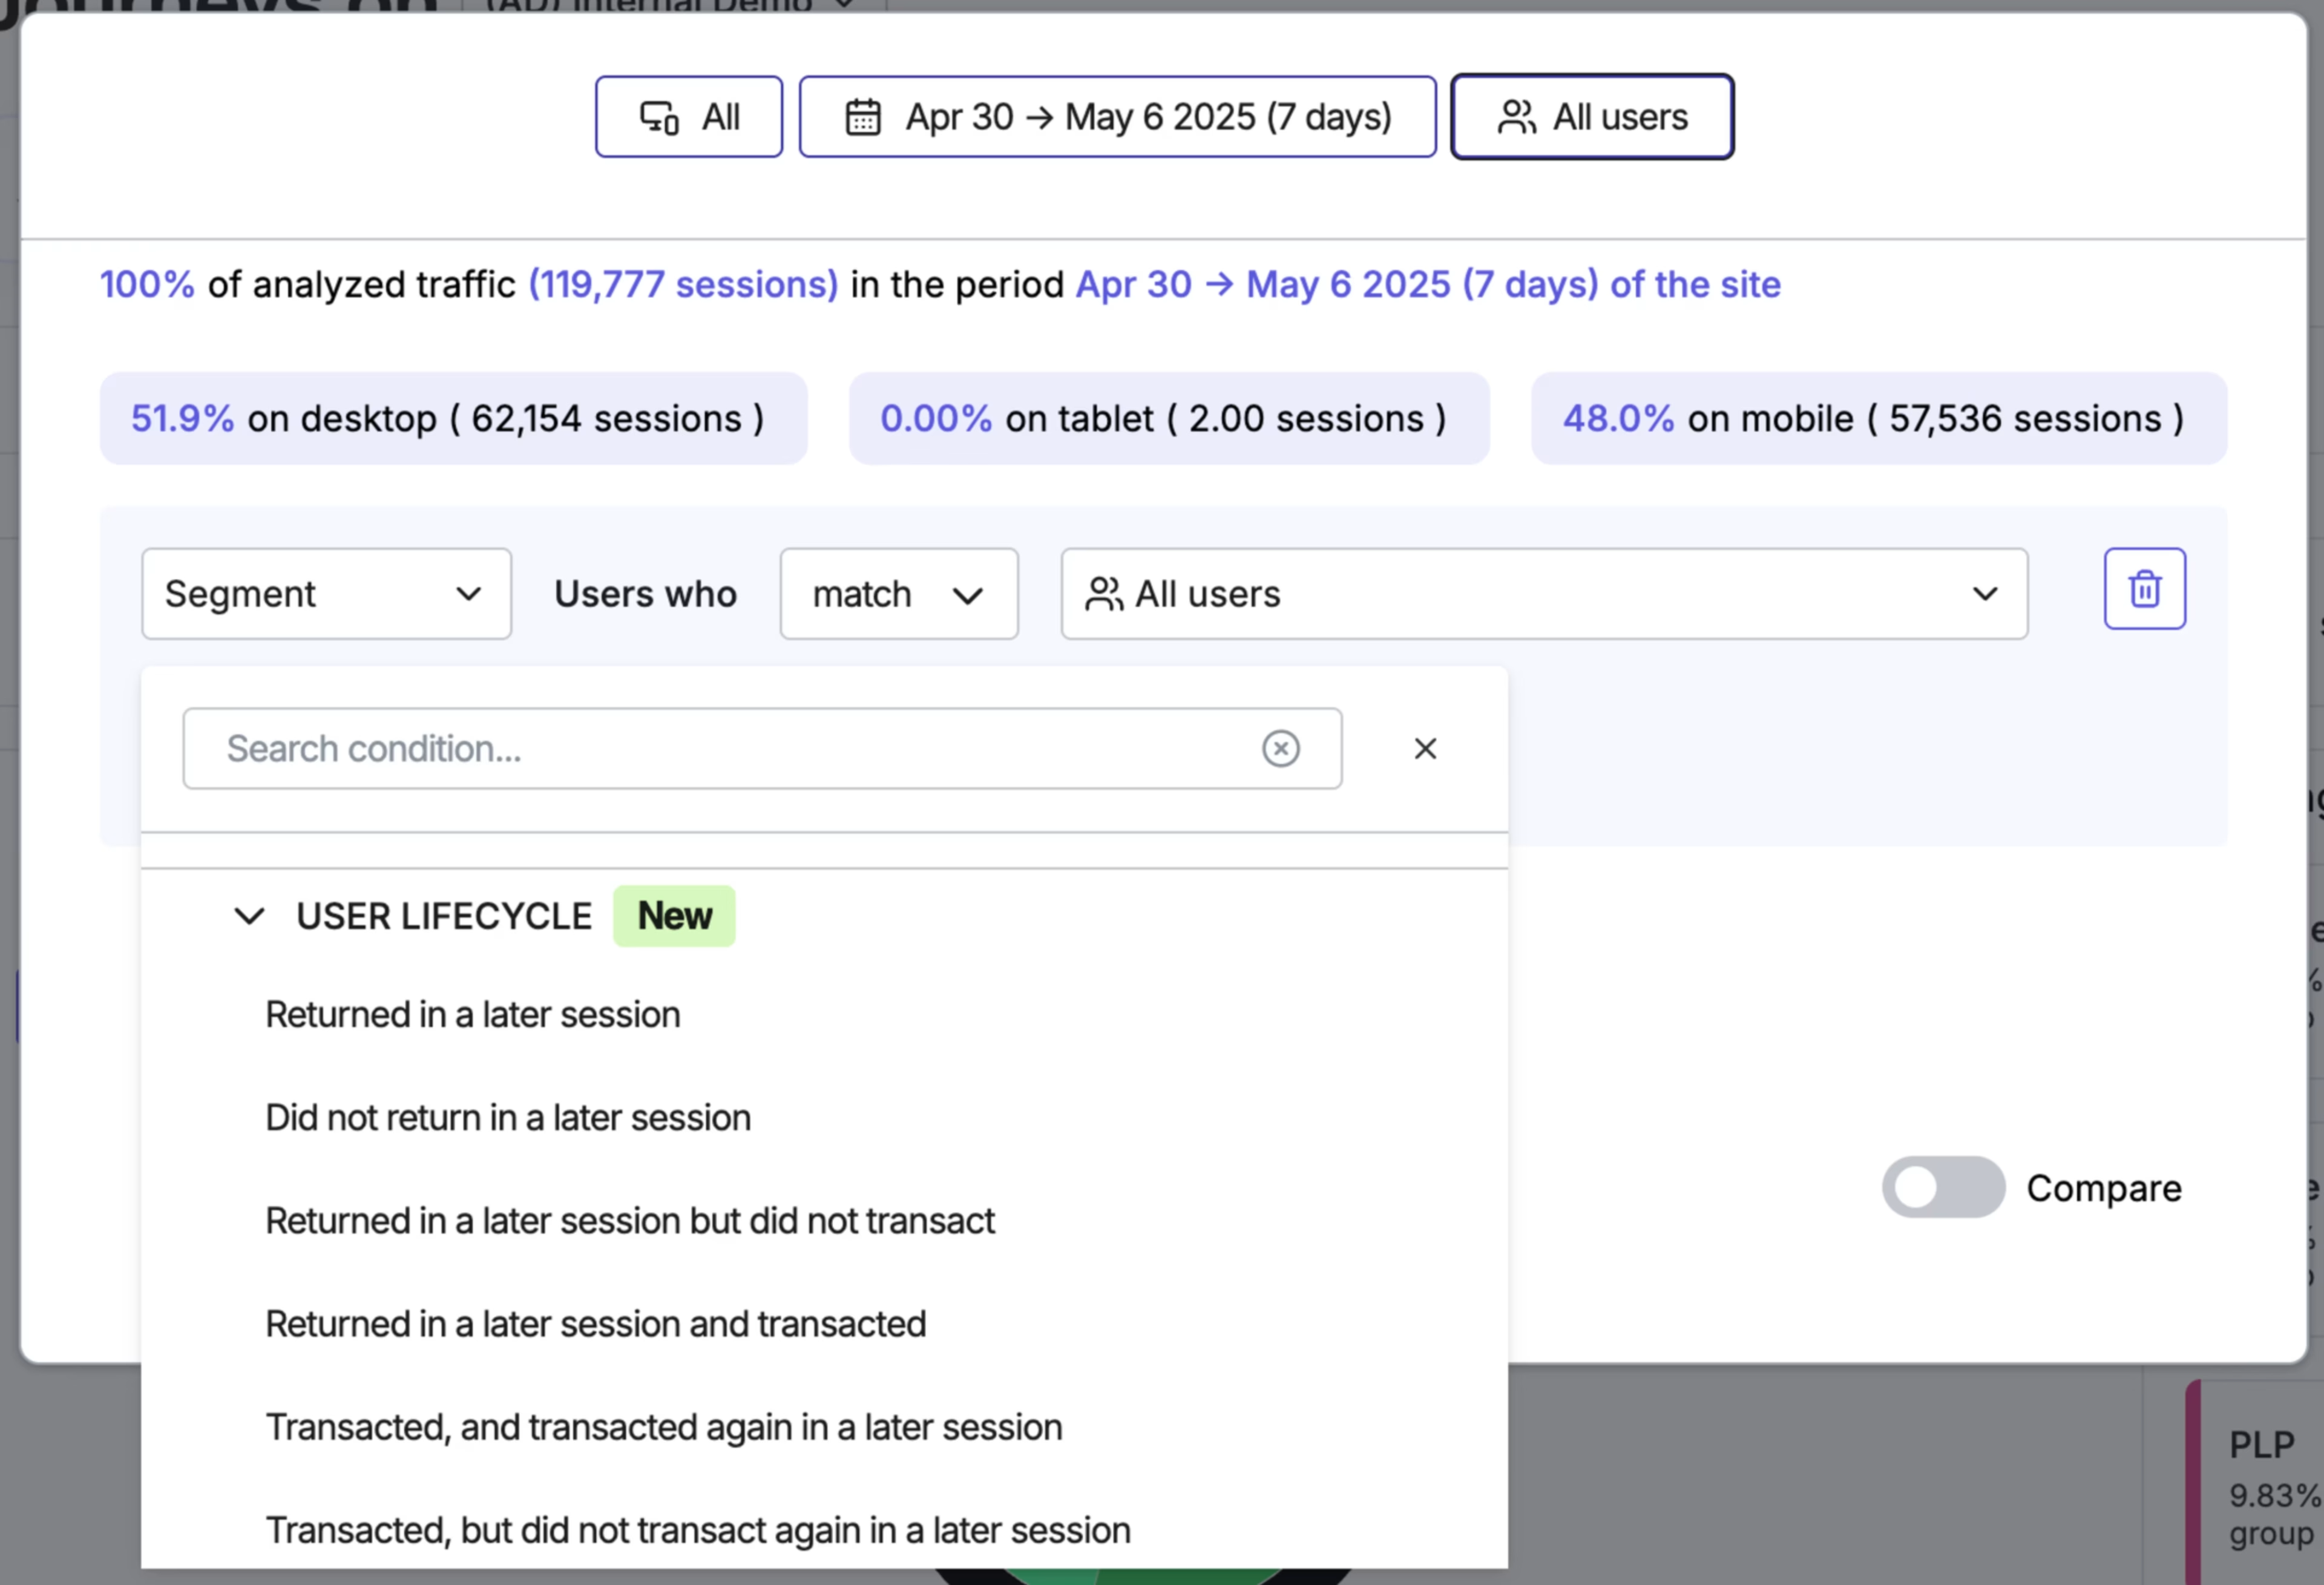
Analyze user sessions by segmenting them based on your customers’ lifetime behavior to personalize content and messaging for them
💡 Pro tip: want to see not just what users are doing, but why they behave the way they do? Layer in qualitative tools like Contentsquare’s Voice of Customer. With AI-powered surveys and instant sentiment analysis, you can validate UX changes fast and uncover hidden friction points. Need deeper insights? Launch follow-up interviews or run user tests to get candid, actionable input straight from your audience.
Adding qualitative data analysis methods to your digital analytics strategy helps you move from reactive reporting to proactive optimization—so you’re not just spotting issues, you’re solving them.
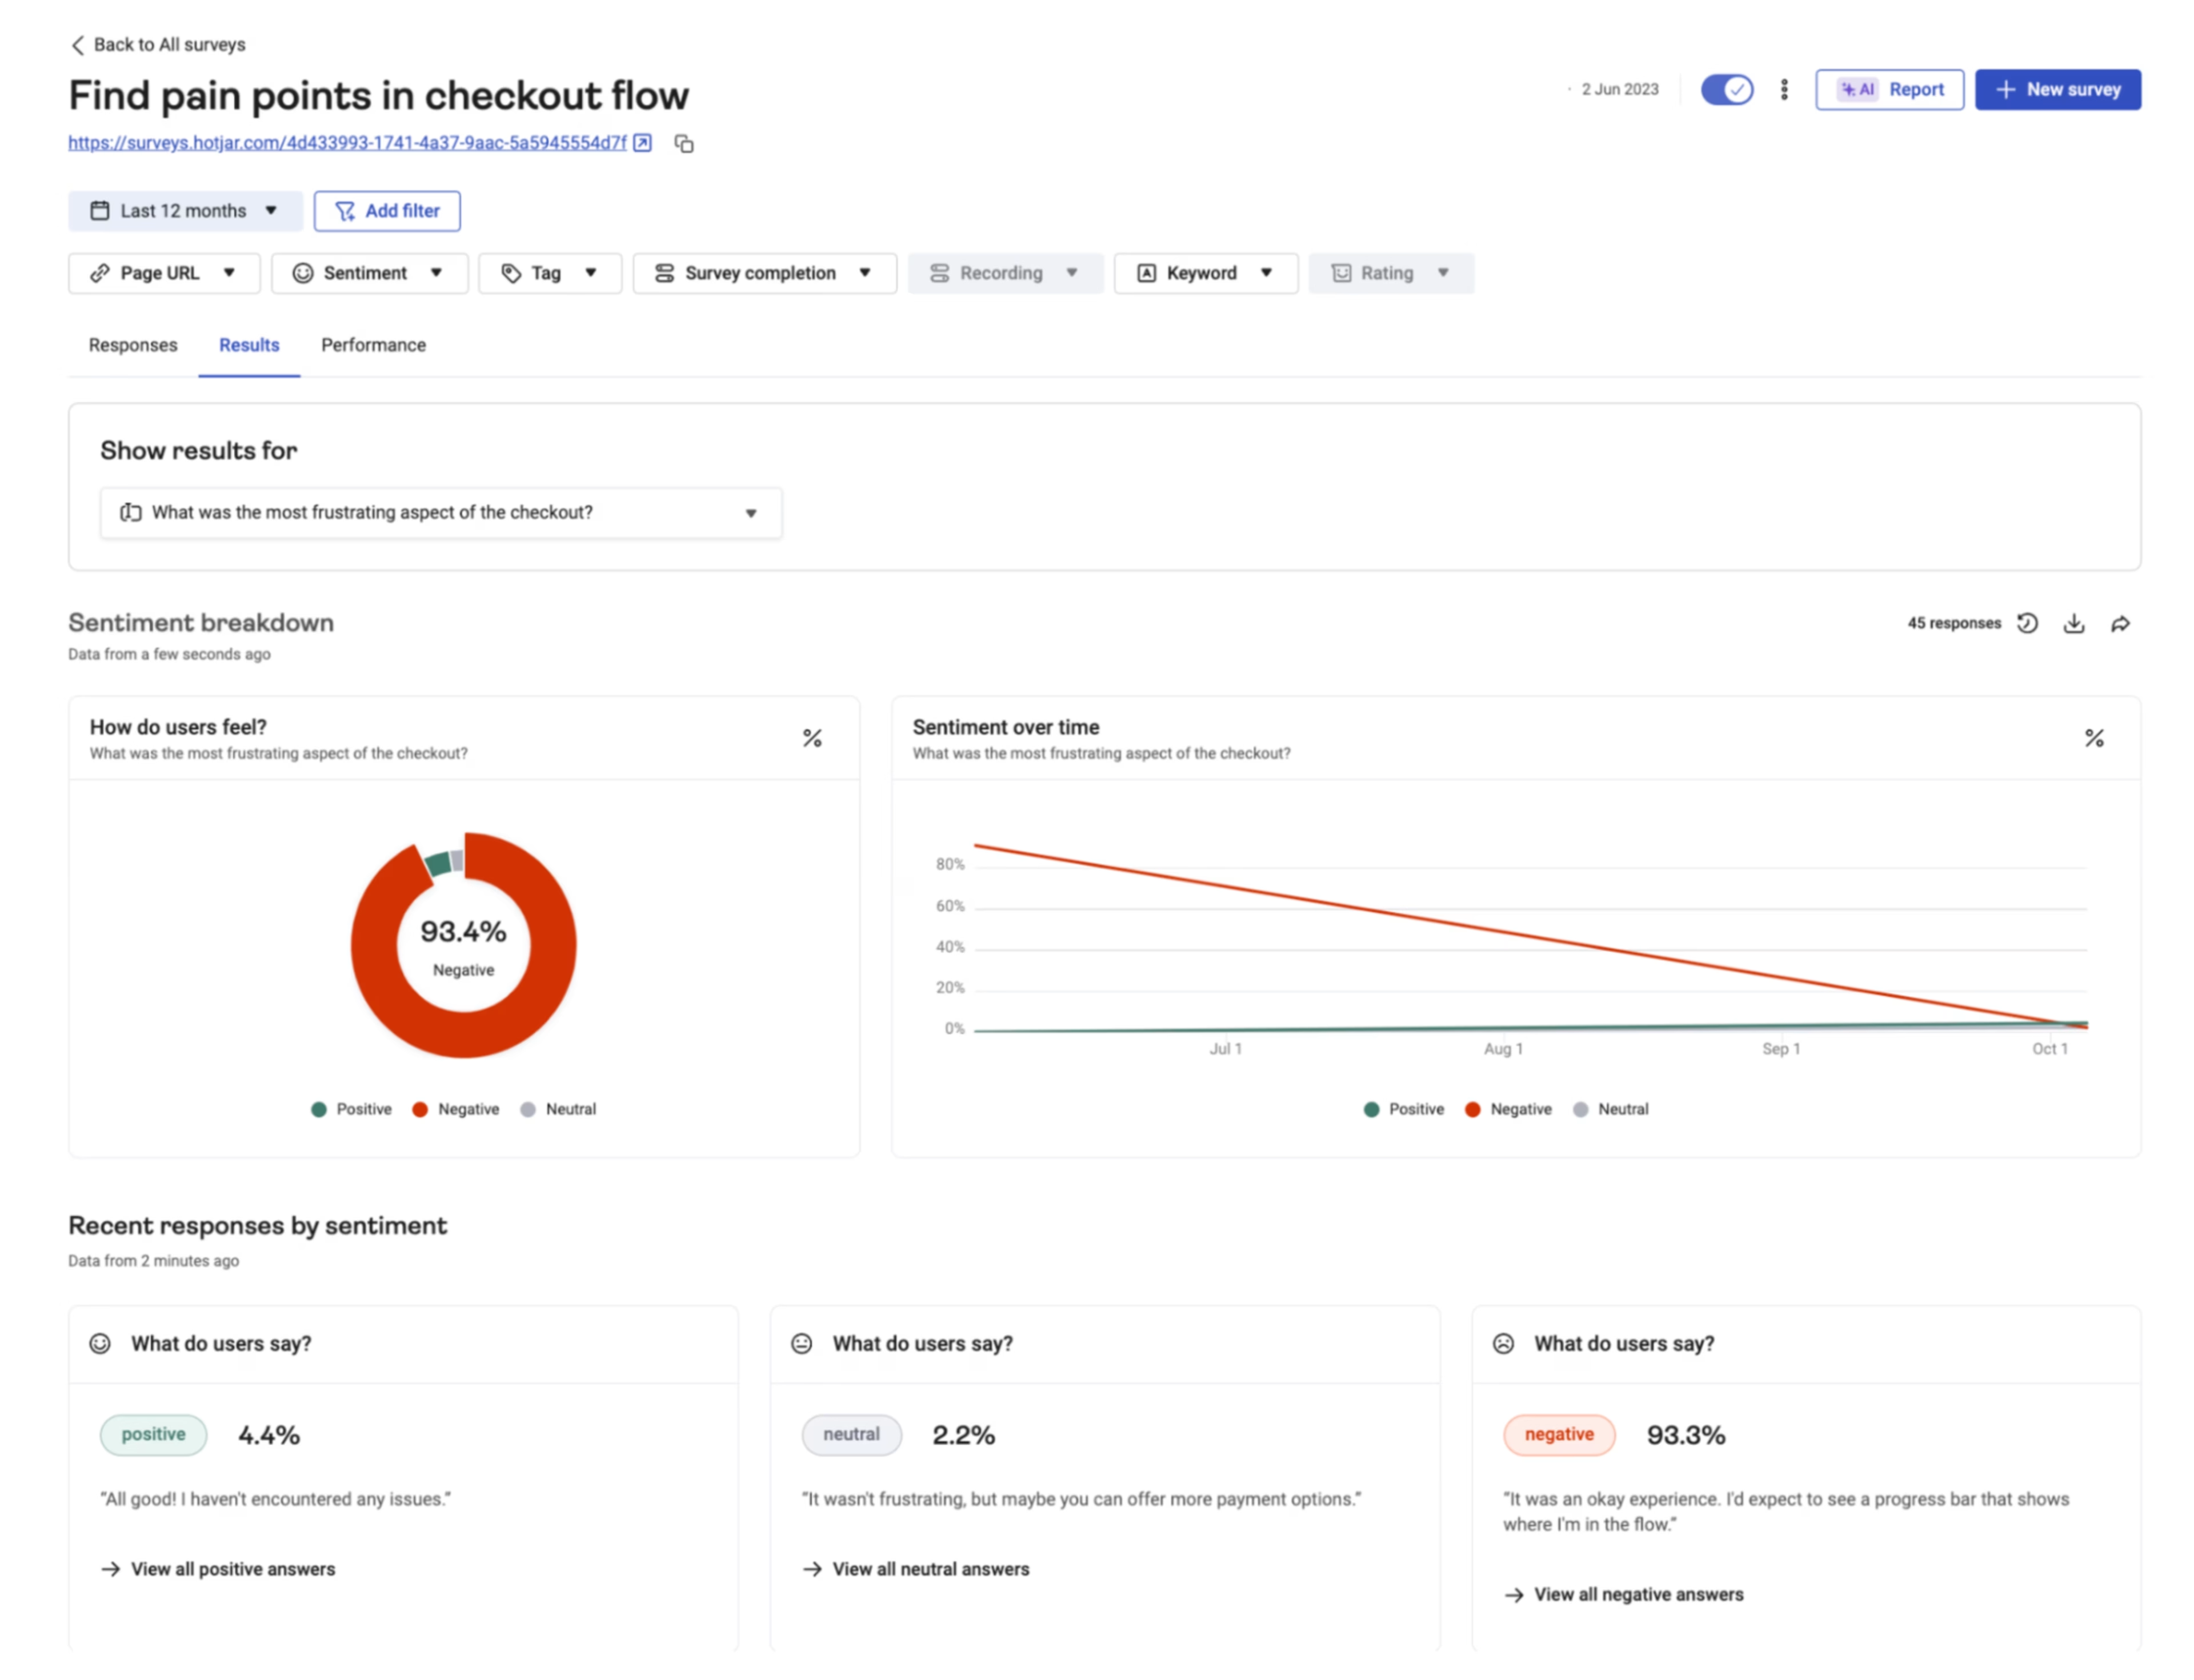
Use Contentsquare’s AI analytics capabilities, like sentiment analysis, to make sense of survey results fast
3. Choose the right analytics tools
Your analytics strategy is only as strong as the tools that support it. The right stack should simplify decision-making—not create more complexity. Look for robust and scalable platforms that allow for integrations.
Start by covering the core digital analytics tools any strategy needs:
Web analytics: track page views, user traffic, traffic sources, and conversion rates to ensure you're attracting the right audiences and guiding them toward key actions
Behavior analytics: understand what users actually do on your site or app by analyzing clicks, scrolls, rage taps, exits, and engagement across journeys
Experience monitoring: ensure your digital experiences are fast, stable, and reliable. Track metrics like page load speed, error rates, and performance bottlenecks.
Voice of customer (VoC): capture direct feedback through surveys and interviews to understand user sentiment and friction points in your customers’ own words
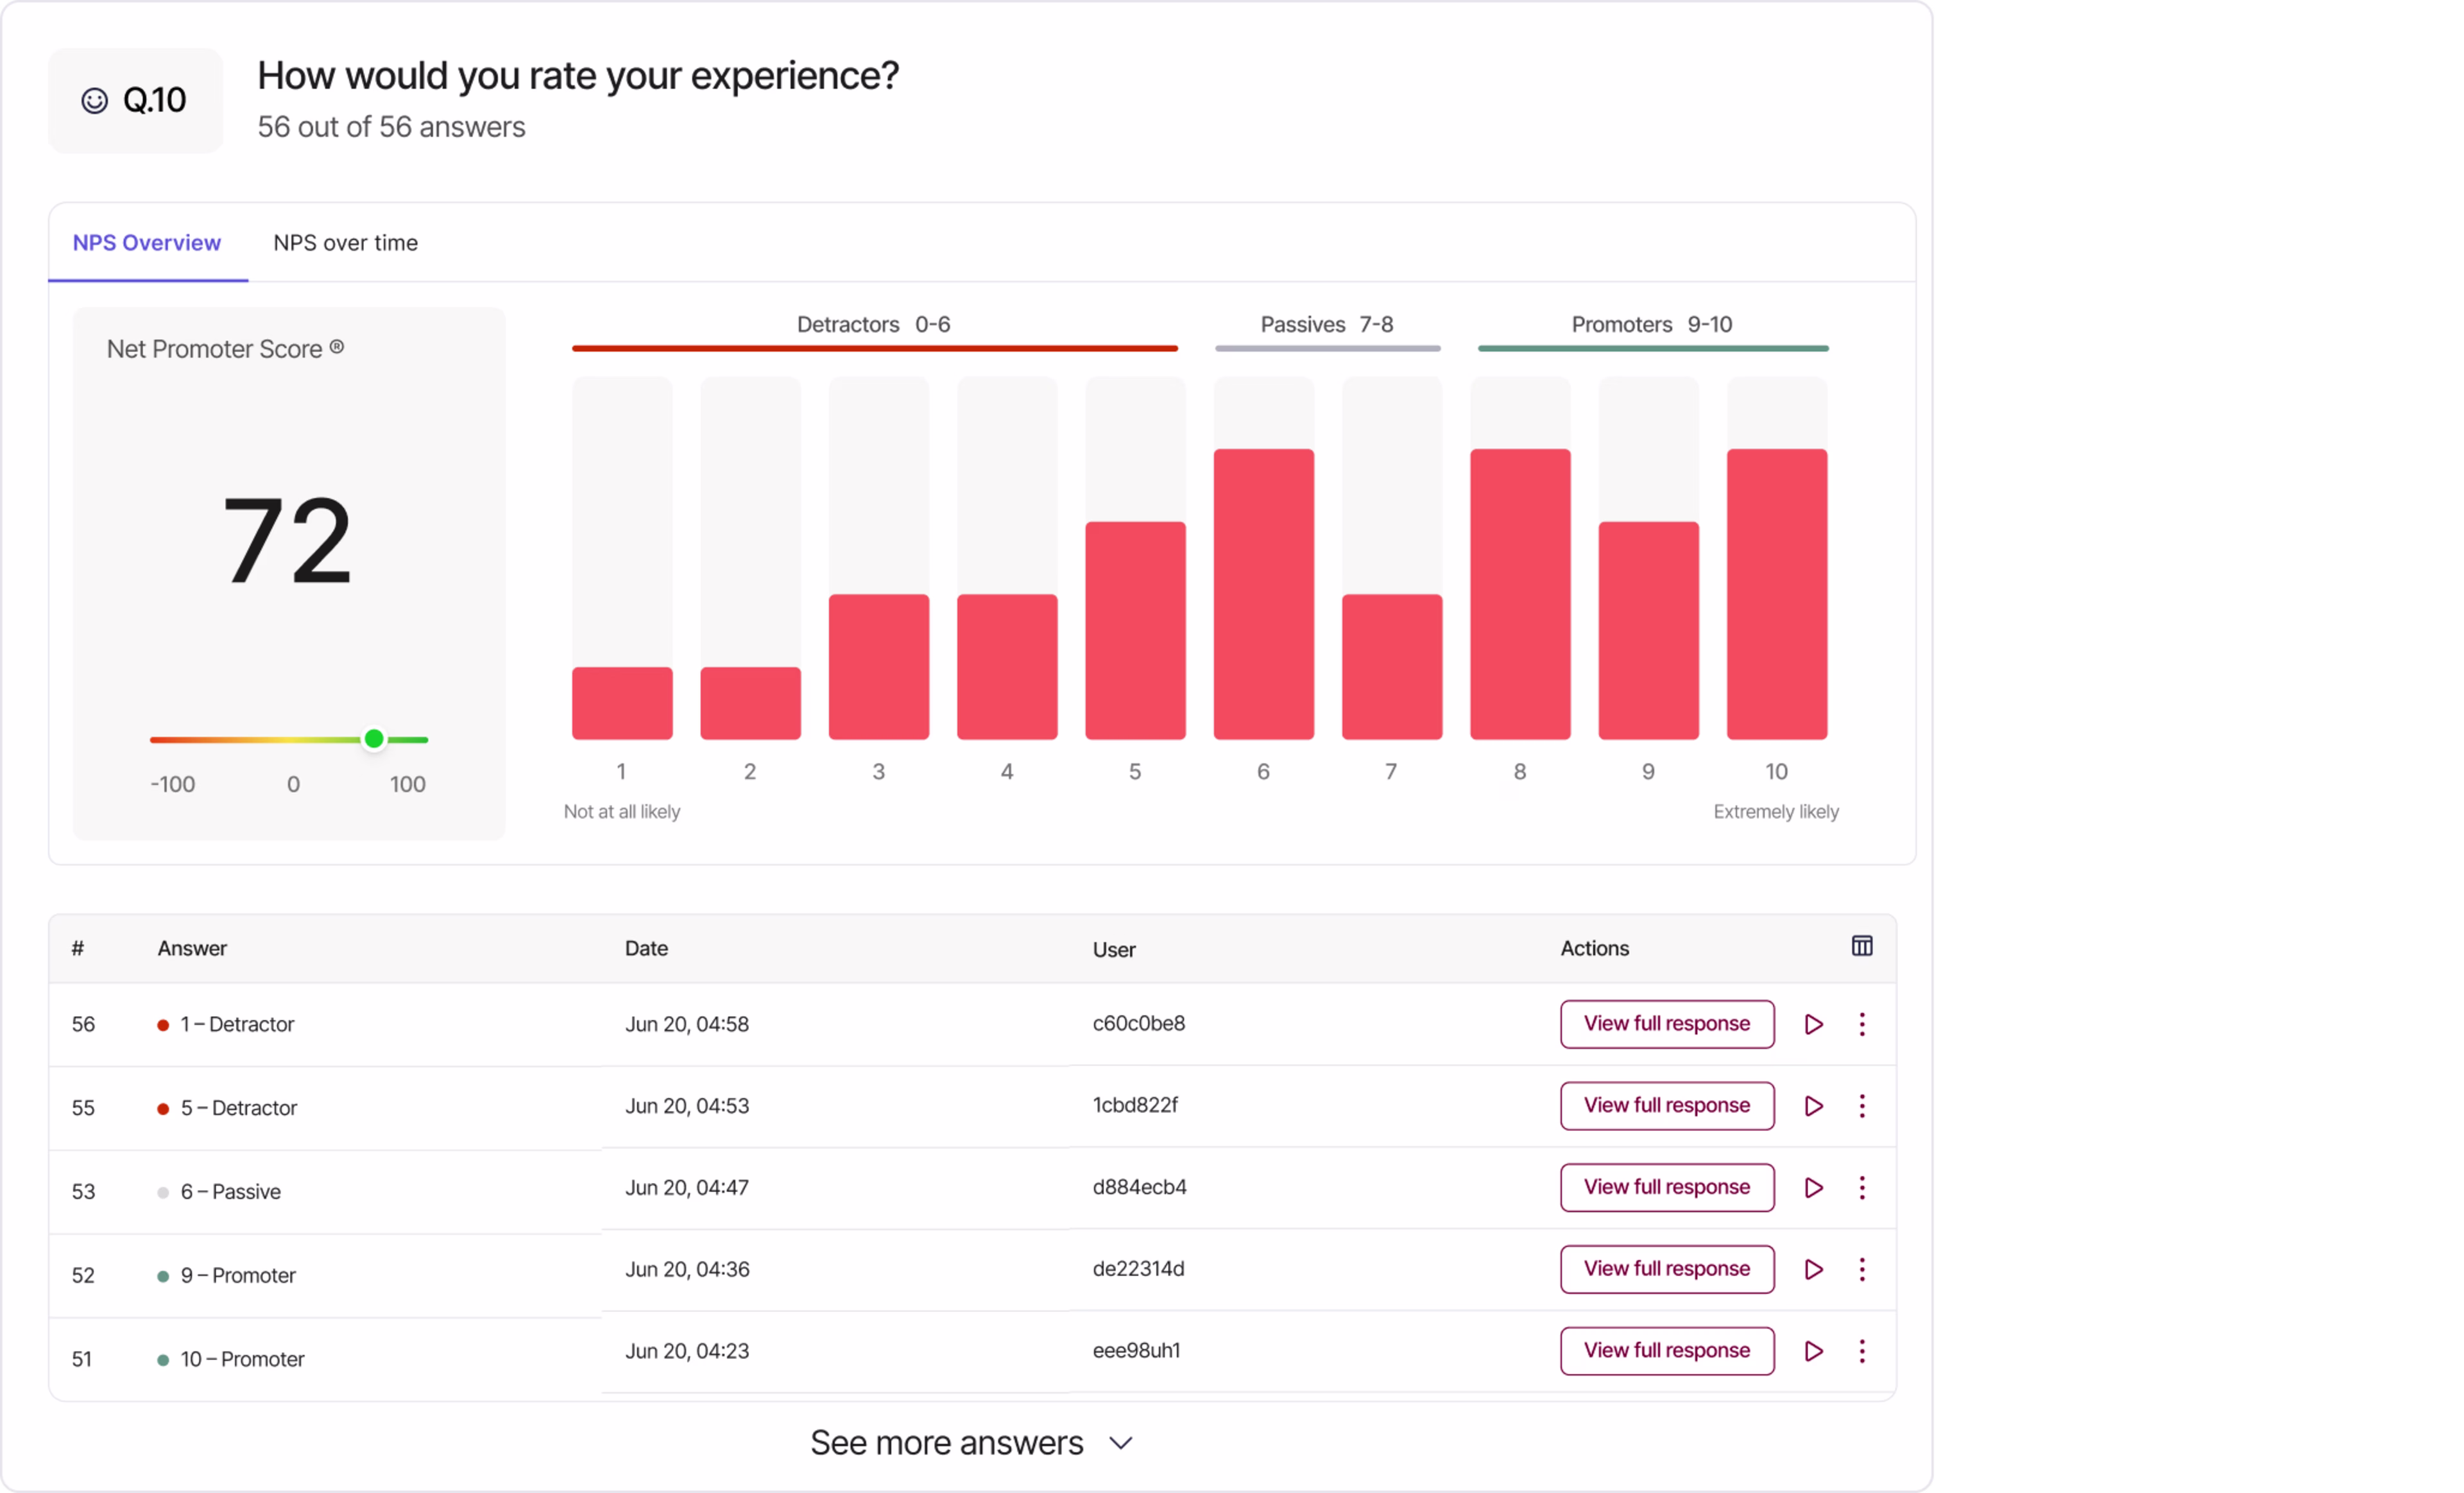
Collect and analyze NPS responses, as well as feedback from exit-intent surveys and on-page feedback widgets, with Contentsquare
While it might seem logical to find the ‘best’ tool for each category, this approach often leads to tool sprawl—a patchwork of single-use platforms that create more silos than insights. (You may find you spend more time switching between dashboards than actually analyzing insights!) A better approach? Use a single platform that integrates multiple capabilities—like behavioral analytics, VoC feedback, and experience monitoring—in one place. This eliminates silos, accelerates decision-making, and gives teams a shared view of the customer journey.
💡Pro tip: go from insight to action—fast—with an all-in-one platform like Contentsquare. Spot a conversion drop in your dashboard, check your Frustration Score to find the places where users struggle, use Session Replay to watch what went wrong, check Error Analysis and Speed Analysis to rule out performance issues, and launch Surveys to get more information directly from users—all without switching tools. It’s faster, more focused, and way easier to take action.
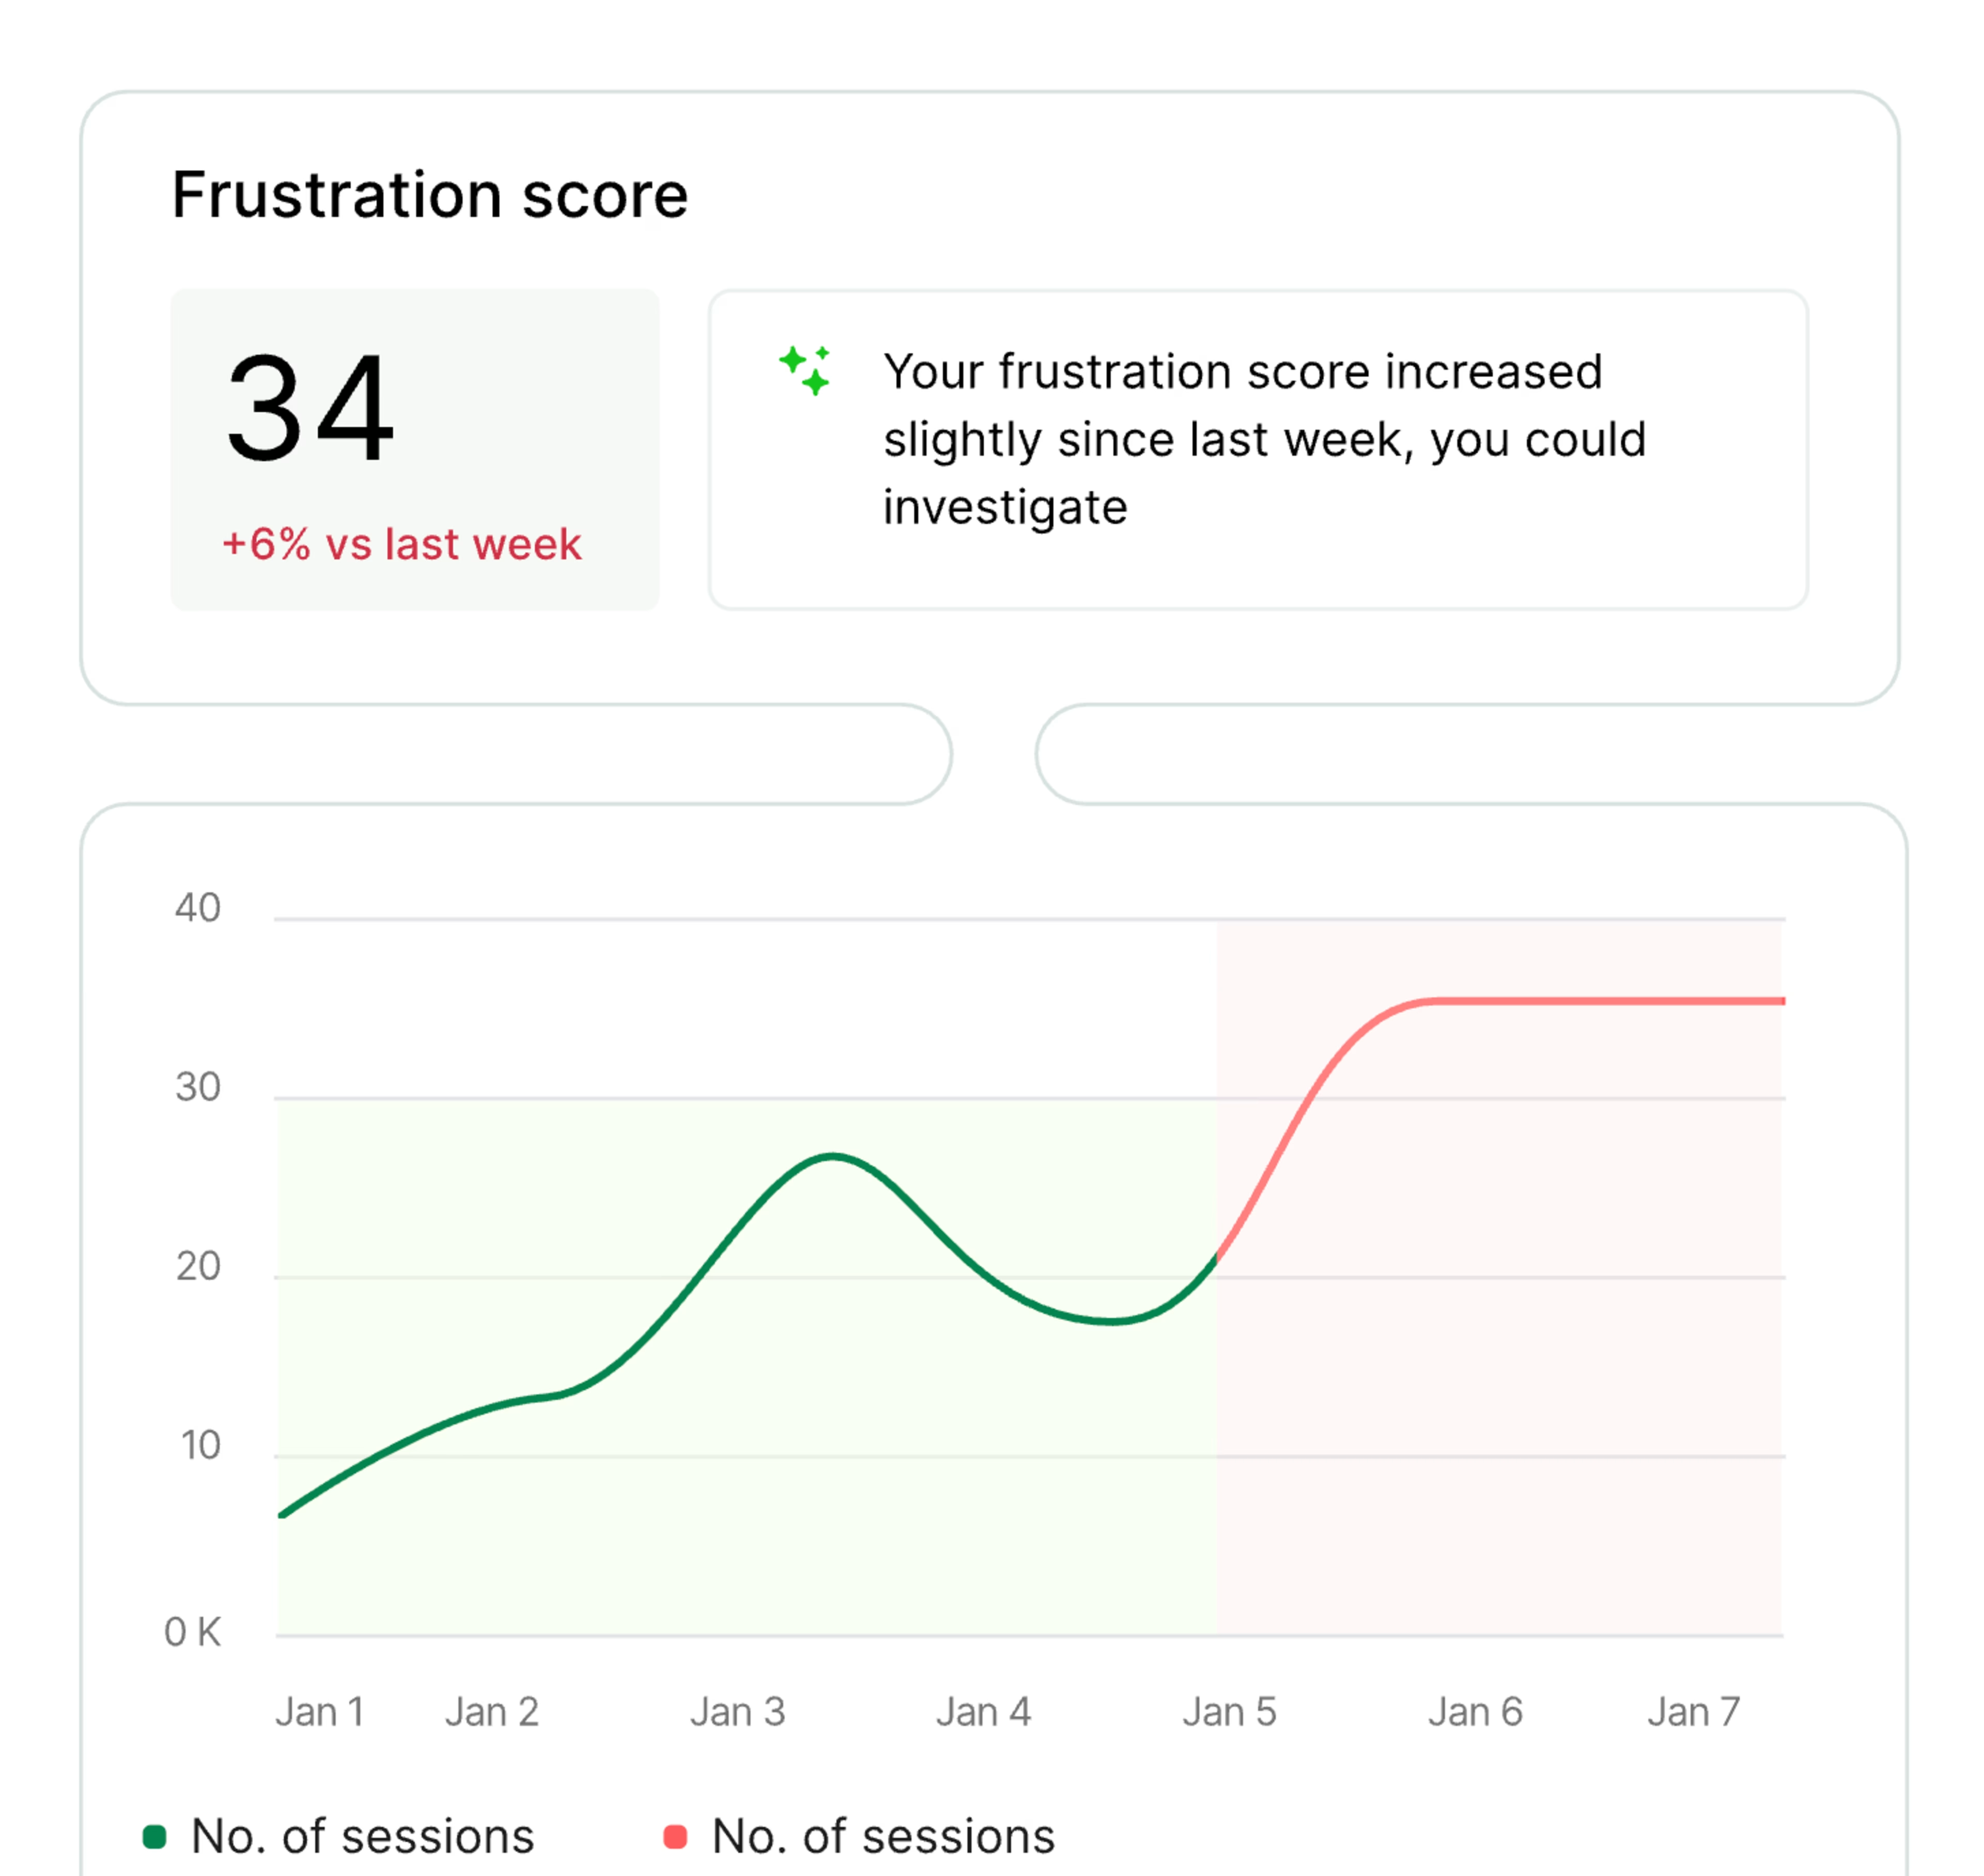
Use AI to compare your frustration score from one week to the next
4. Monitor and optimize
Analytics only make a difference when they lead to action. It’s easy to collect data, but the real value comes from turning insights into improvements, day in and day out.
This means creating systems that automatically help you find ways to optimize the digital experience. Here's how to make that happen:
Create actionable reports: the best digital analytics reports highlight what needs attention and suggest next steps. Contentsquare AI can help by summarizing key patterns, highlighting user frustrations, and even answering questions like “What’s driving drop-off on this journey?”
Build a culture of continuous improvement: Schedule regular analytics reviews to discuss insights, share findings, and plan improvements. Then, use experimentation—like A/B testing new designs or features—to validate ideas before rolling them out broadly.
Set up automated alerts: use a tool like Contentsquare Alerts to get notified about traffic shifts, conversion drops, or performance issues before they affect your bottom line
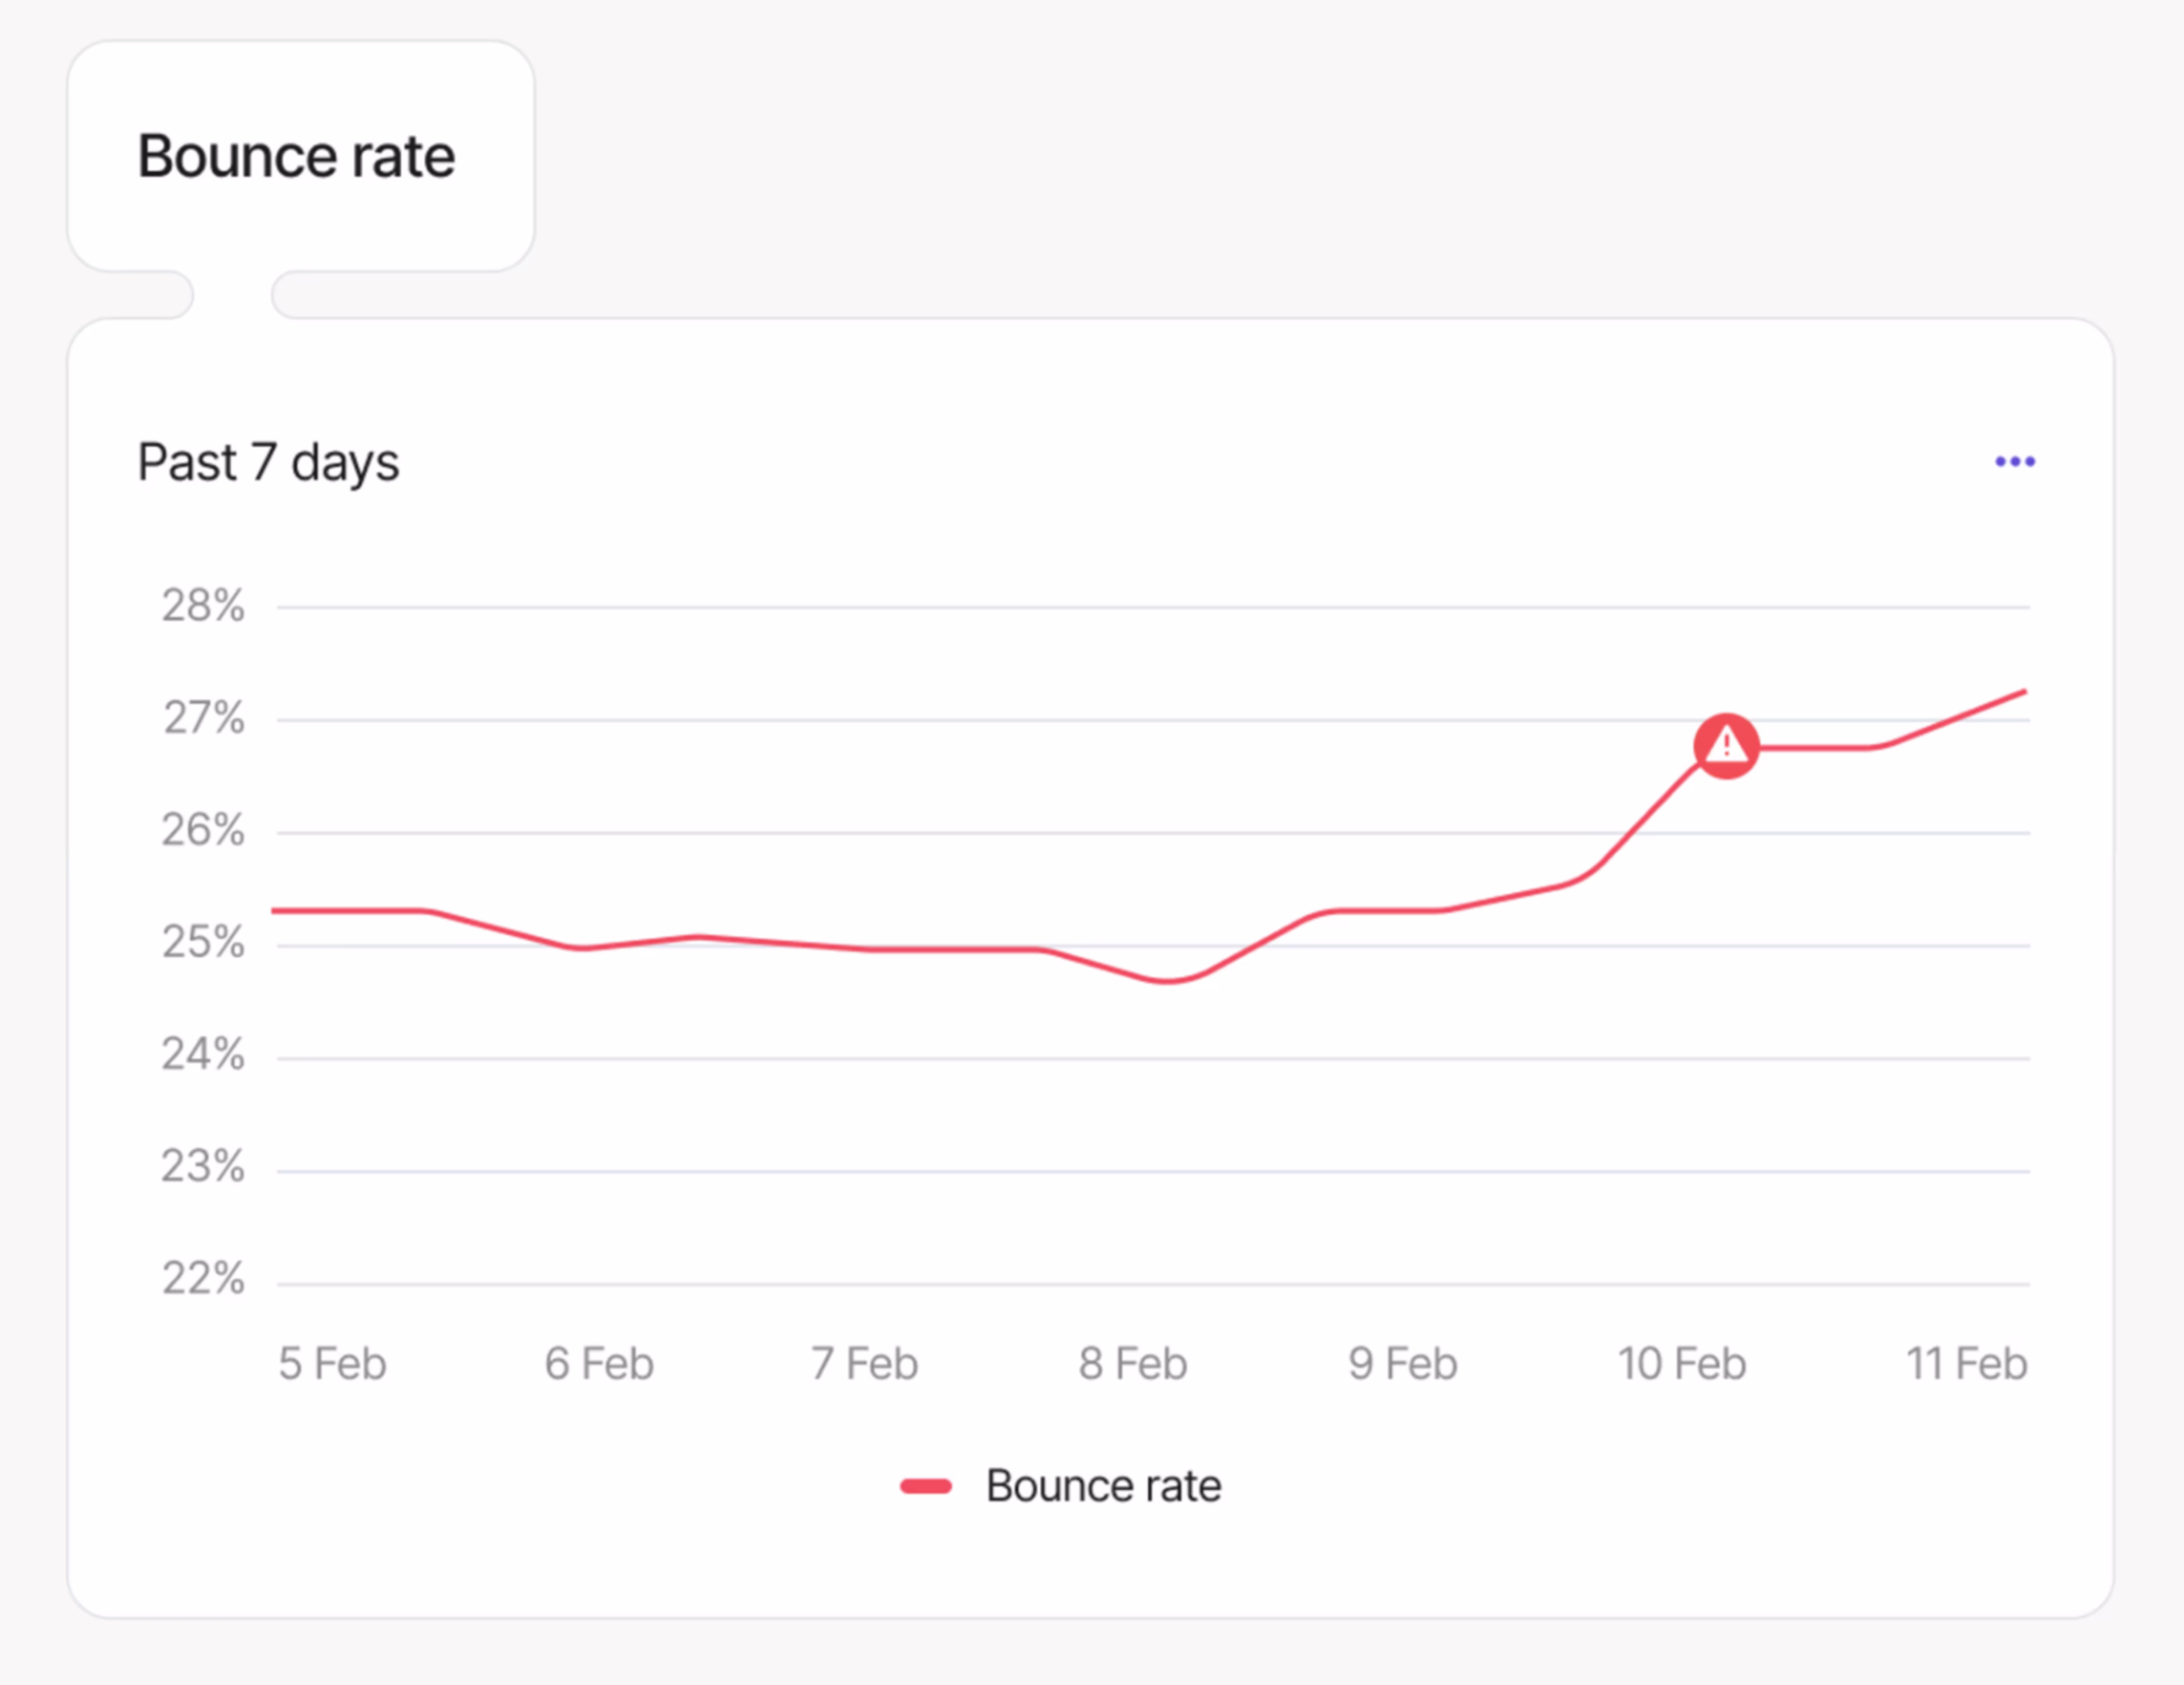
Get notified when session duration or bounce rates drop, then use Contentsquare to identify the cause
🔥 How Diptyque uses Contentsquare turns insights into action
Luxury fragrance brand Diptyque uses Contentsquare to monitor their user experience in real time—and make data-backed improvements that drive results.
When feedback surfaced about friction in the checkout process, Diptyque’s digital team jumped into Contentsquare to investigate. With Journey Analysis, they spotted high drop-off rates for new and mobile users. Heatmaps and session replays revealed that customers were misinterpreting elements on the page.
Equipped with those insights, the team redesigned the login flow and conducted A/B testing on the new variations. The result?
31% drop in exits for new users
9% increase in mobile conversions
50% faster page load time
But the real success? Turning analytics into a cross-team habit. By making Contentsquare accessible across teams—and easy to understand—Diptyque embedded a culture of continuous improvement company-wide.
5. Scale with AI-powered insights
Traditional analytics often creates bottlenecks, where only a few team members can effectively interpret data and turn it into action. AI changes this by automatically surfacing important insights and presenting them clearly.
Here’s how:
Use AI to quickly surface hidden trends. For example, Contentsquare’s Frustration Score helps you instantly identify pages where users struggle most, while Session Replay Summaries highlight key moments across multiple sessions—letting you jump straight to what matters.
Make analytics accessible to everyone, even non-technical stakeholders. You shouldn’t need to know SQL to get answers. Contentsquare’s Sense lets teams ask questions in plain language—like “Why is checkout drop-off up this week?”—so you can get visual, actionable insights on the spot. Plus, features like Headlines automatically flag significant KPI shifts, like a sudden dip in conversions or rise in frustration, and categorize them by urgency—so you can spot issues at a glance, right from your dashboards.
A better analytics strategy = better business outcomes
Great analytics isn’t about collecting more data—it’s about making better decisions, faster. When you align insights with business goals, map real customer journeys, monitor proactively, and scale with AI, you meet your customers’ needs and turn guesswork into growth. 📈
FAQs about digital analytics strategy
A digital analytics strategy is a plan for how your organization collects, interprets, and uses digital data, like mobile analytics metrics, to improve business performance. A good strategy connects analytics to real goals—like growing revenue, improving UX, or increasing retention—and sets up the tools, processes, and teams to make that happen. It’s an umbrella term that includes your behavior analytics strategy and your data integration strategy.
![[Visual] Contentsquare's Content Team](http://images.ctfassets.net/gwbpo1m641r7/3IVEUbRzFIoC9mf5EJ2qHY/f25ccd2131dfd63f5c63b5b92cc4ba20/Copy_of_Copy_of_BLOG-icp-8117438.jpeg?w=1920&q=100&fit=fill&fm=avif)