
With a wide range of data points at your fingertips, how do you ensure you’re tracking what truly matters?
For cross-functional digital teams, it comes down to focusing on data that significantly impacts acquisition, engagement, conversion, and retention. Tracking key digital analytics metrics saves you time, budget, and energy, while empowering you to address performance at every stage of the customer lifecycle. It also means you can report on meaningful insights to create a shared understanding of success with stakeholders and leadership.
This article outlines the 10 essential metrics you should be tracking in digital analytics. When grouped and analyzed together, they help you calibrate your decisions and actions to align with your business goals.
Key insights
Digital analytics has many moving parts, but at its core is a subset of metrics, known as key performance indicators (KPIs), that help teams make data-driven decisions and prioritize resources
Comprehensive, AI-powered digital analytics combines metrics from various data sources to give you a strong grasp of your customers’ digital experiences
Picking only the metrics important to your business goals in a given time period ensures you prioritize initiatives, show cause and effect between project outcomes, and justify resource allocation
1. Website or app traffic
Traffic is the number of unique users and visitor volume on your site or app. Together, these metrics show how visible your brand is and which channels are driving visits—including organic search, paid ads, social media, email, and direct.
By tracking traffic monthly, you’ll understand how your campaigns, content, and user experience (UX) are performing. For example, if you see a steady visitor dip from last month, ask yourself informed questions, such as
Whether the trend is seasonal
Which area of your acquisition strategy needs improvement: is it any of your channels, search engine optimization (SEO), ad targeting, or messaging?
You can also monitor it daily to check for sudden drops or manage time-sensitive assets like product launch landing pages or paid ads.
Tips to track and optimize traffic
Google Analytics (GA) remains a great tool for gathering traffic data. In its latest version, GA4, you’ll find 2 main traffic metrics: ‘Users’ (total unique visitors) and ‘Sessions’ (total visits, including repeat ones).
🤔 Did you know? You can combine digital analytics metrics—not just traffic—using Contentsquare’s dashboards. Without leaving the platform, you can segment traffic by source and switch to Contentsquare’s Acquisition Analysis to identify your most valuable channels.
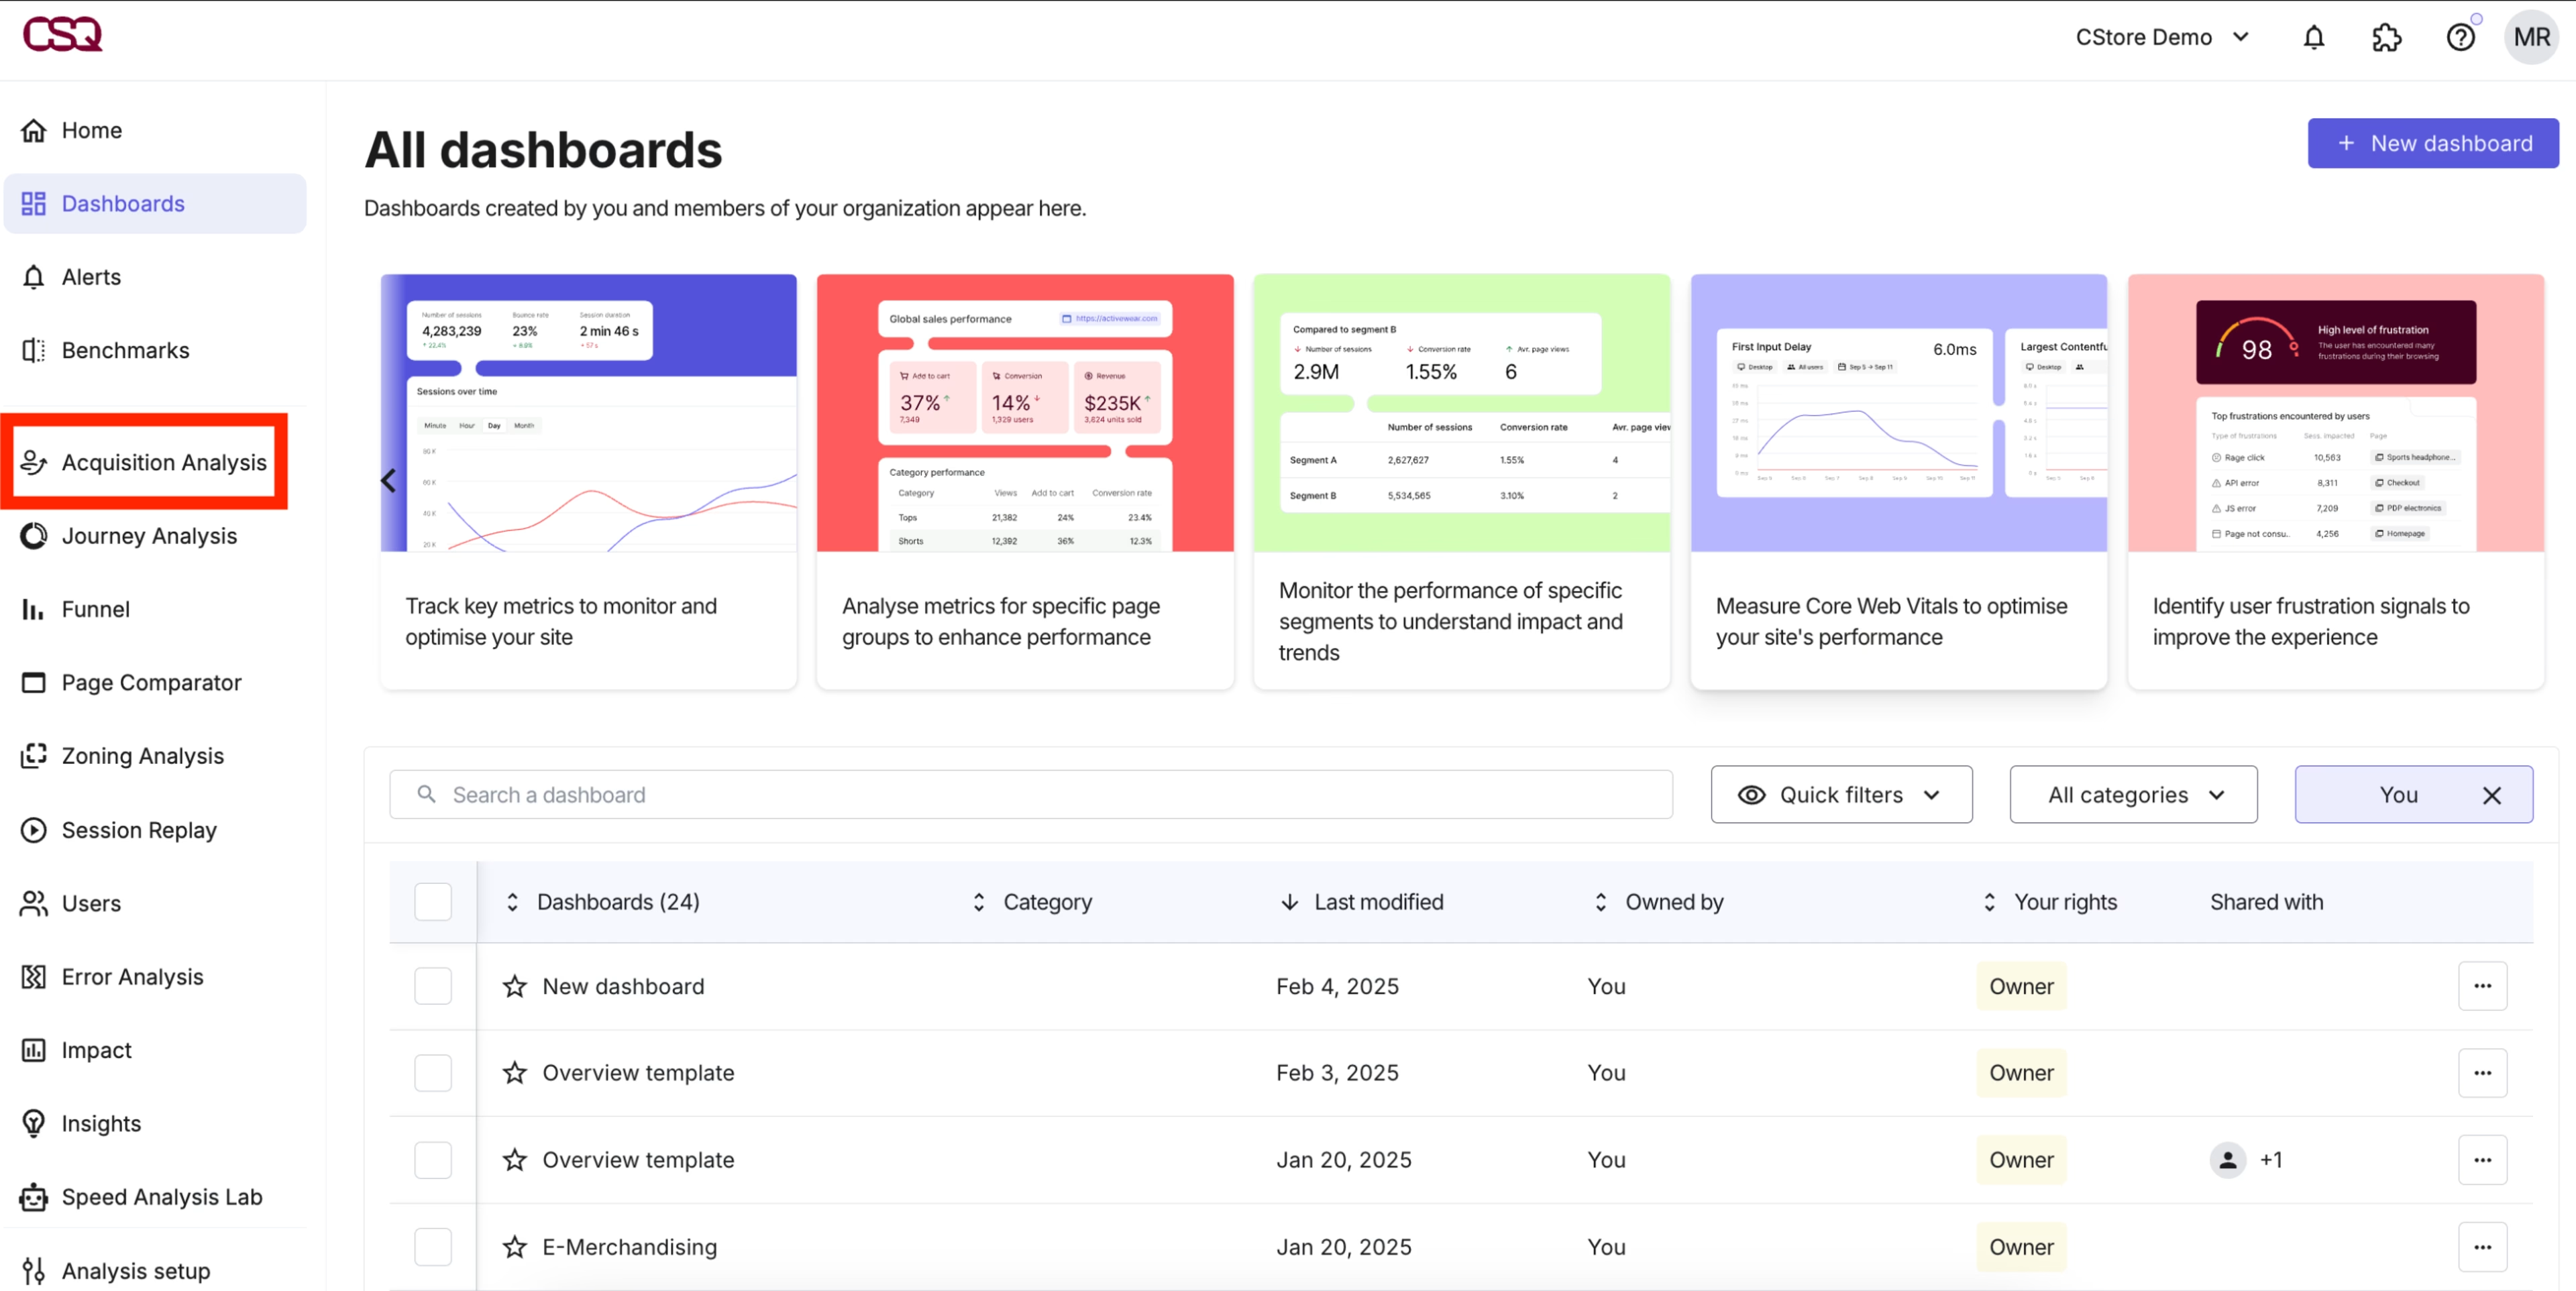
Create dashboards in Contentsquare to monitor important digital analytics metrics and drill down further using tools like Acquisition Analysis
2. Engagement
Engagement measures how actively users interact with your content, such as scrolling and clicking on desktop and tapping on mobile. SEO, content, social media, email marketing, and product teams usually track their own engagement metrics every month.
You can quantify site interactions using
Bounce rate: the percentage of users who leave after visiting one page
Scroll depth: how far down a page users scroll
Average time on page: the average time users spend on a page before navigating to another one or leaving the site
Average session duration: the average time users spend on your site or pages per visit
Pages per session: average number of pages users view per visit
These metrics show whether visitors are actively consuming, exploring, or dropping off. While it’s easier said than done, creating relevant content and enabling a smooth UX boost engagement, setting the stage for conversions and retention.
Tips to track and optimize engagement
Google Analytics and built-in, channel-specific analytics tools—such as Insights in Meta Business Suite and Mailchimp’s analytics and reporting tools—allow you to monitor user engagement.
✋ But wait, there’s more: analyzing engagement metrics alone isn’t enough to decide whether—or how—to optimize content. Take, for example, a high bounce rate. It might mean your content is irrelevant, but it could also mean it’s satisfying user intent in just one visit.
Contentsquare’s Experience Analytics capabilities demystify engagement metrics, helping you with your digital analytics reporting. Use Heatmaps to check if users interacted with key elements before leaving. Did they ignore or never see your call to action (CTA)? Jump to Session Replay to watch related session recordings to see what they saw and clock the hesitation or frustration before the drop-off.
![[Visual]heatmaps for website optimization](http://images.ctfassets.net/gwbpo1m641r7/1CBe7tMqN7DAaWcggfpQpY/bf922ad649a64deebc58c0d97ceccbbf/eyJwYXRoIjoiY29udGVudHNxdWFyZVwvZmlsZVwvNk5jVHZ5NWZOeG8yQ2NiQ0c3R0QucG5nIn0_contentsquare_bPtyc4-qnyK-oonEzdZGw1OMTXCO9SraLr.png?w=3840&q=100&fit=fill&fm=avif)
Jump from Heatmaps to Session Replay to see firsthand how users engage with your content
With Contentsquare’s Experience Analytics product, we know where and how our customers are interacting and engaging with our site at a granular page and segment level, which is something generic data reporting can’t provide context on.
3. Conversion rate
Conversion rate is the percentage of users who take a desired action. This could be completing a purchase, signing up for emails, booking a demo, or downloading an ebook.
Include this metric in your monthly reporting, but keep it flexible during campaign periods and post-UX improvements to assess their impact.
Here’s how you calculate conversion rate:
Conversion rate = (Number of conversions / Total number of visitors) x 100 |
|---|
Your success depends on consistently turning site visitors or leads into paying customers. A higher conversion rate often means a stronger return on investment (ROI)—something leadership loves to hear.
Tips to track and optimize conversion rate
To improve your conversion rate, see if you need to sharpen targeting, optimize user journeys, and refine messaging. These tactics make up an important digital process called conversion rate optimization (CRO).
You can track all your CRO metrics, including macro- and micro-conversions, by creating a dashboard in Contentsquare. To proactively deal with potential conversion blockers, get AI-powered alerts whenever your conversion rate reaches a critical point.
For deeper insights, use Contentsquare’s Journey Analysis and Chat with Sense capabilities to investigate the paths directly linked to the decline. Conversely, you can leverage these tools to pinpoint top-performing paths and surface new conversion opportunities in seconds.
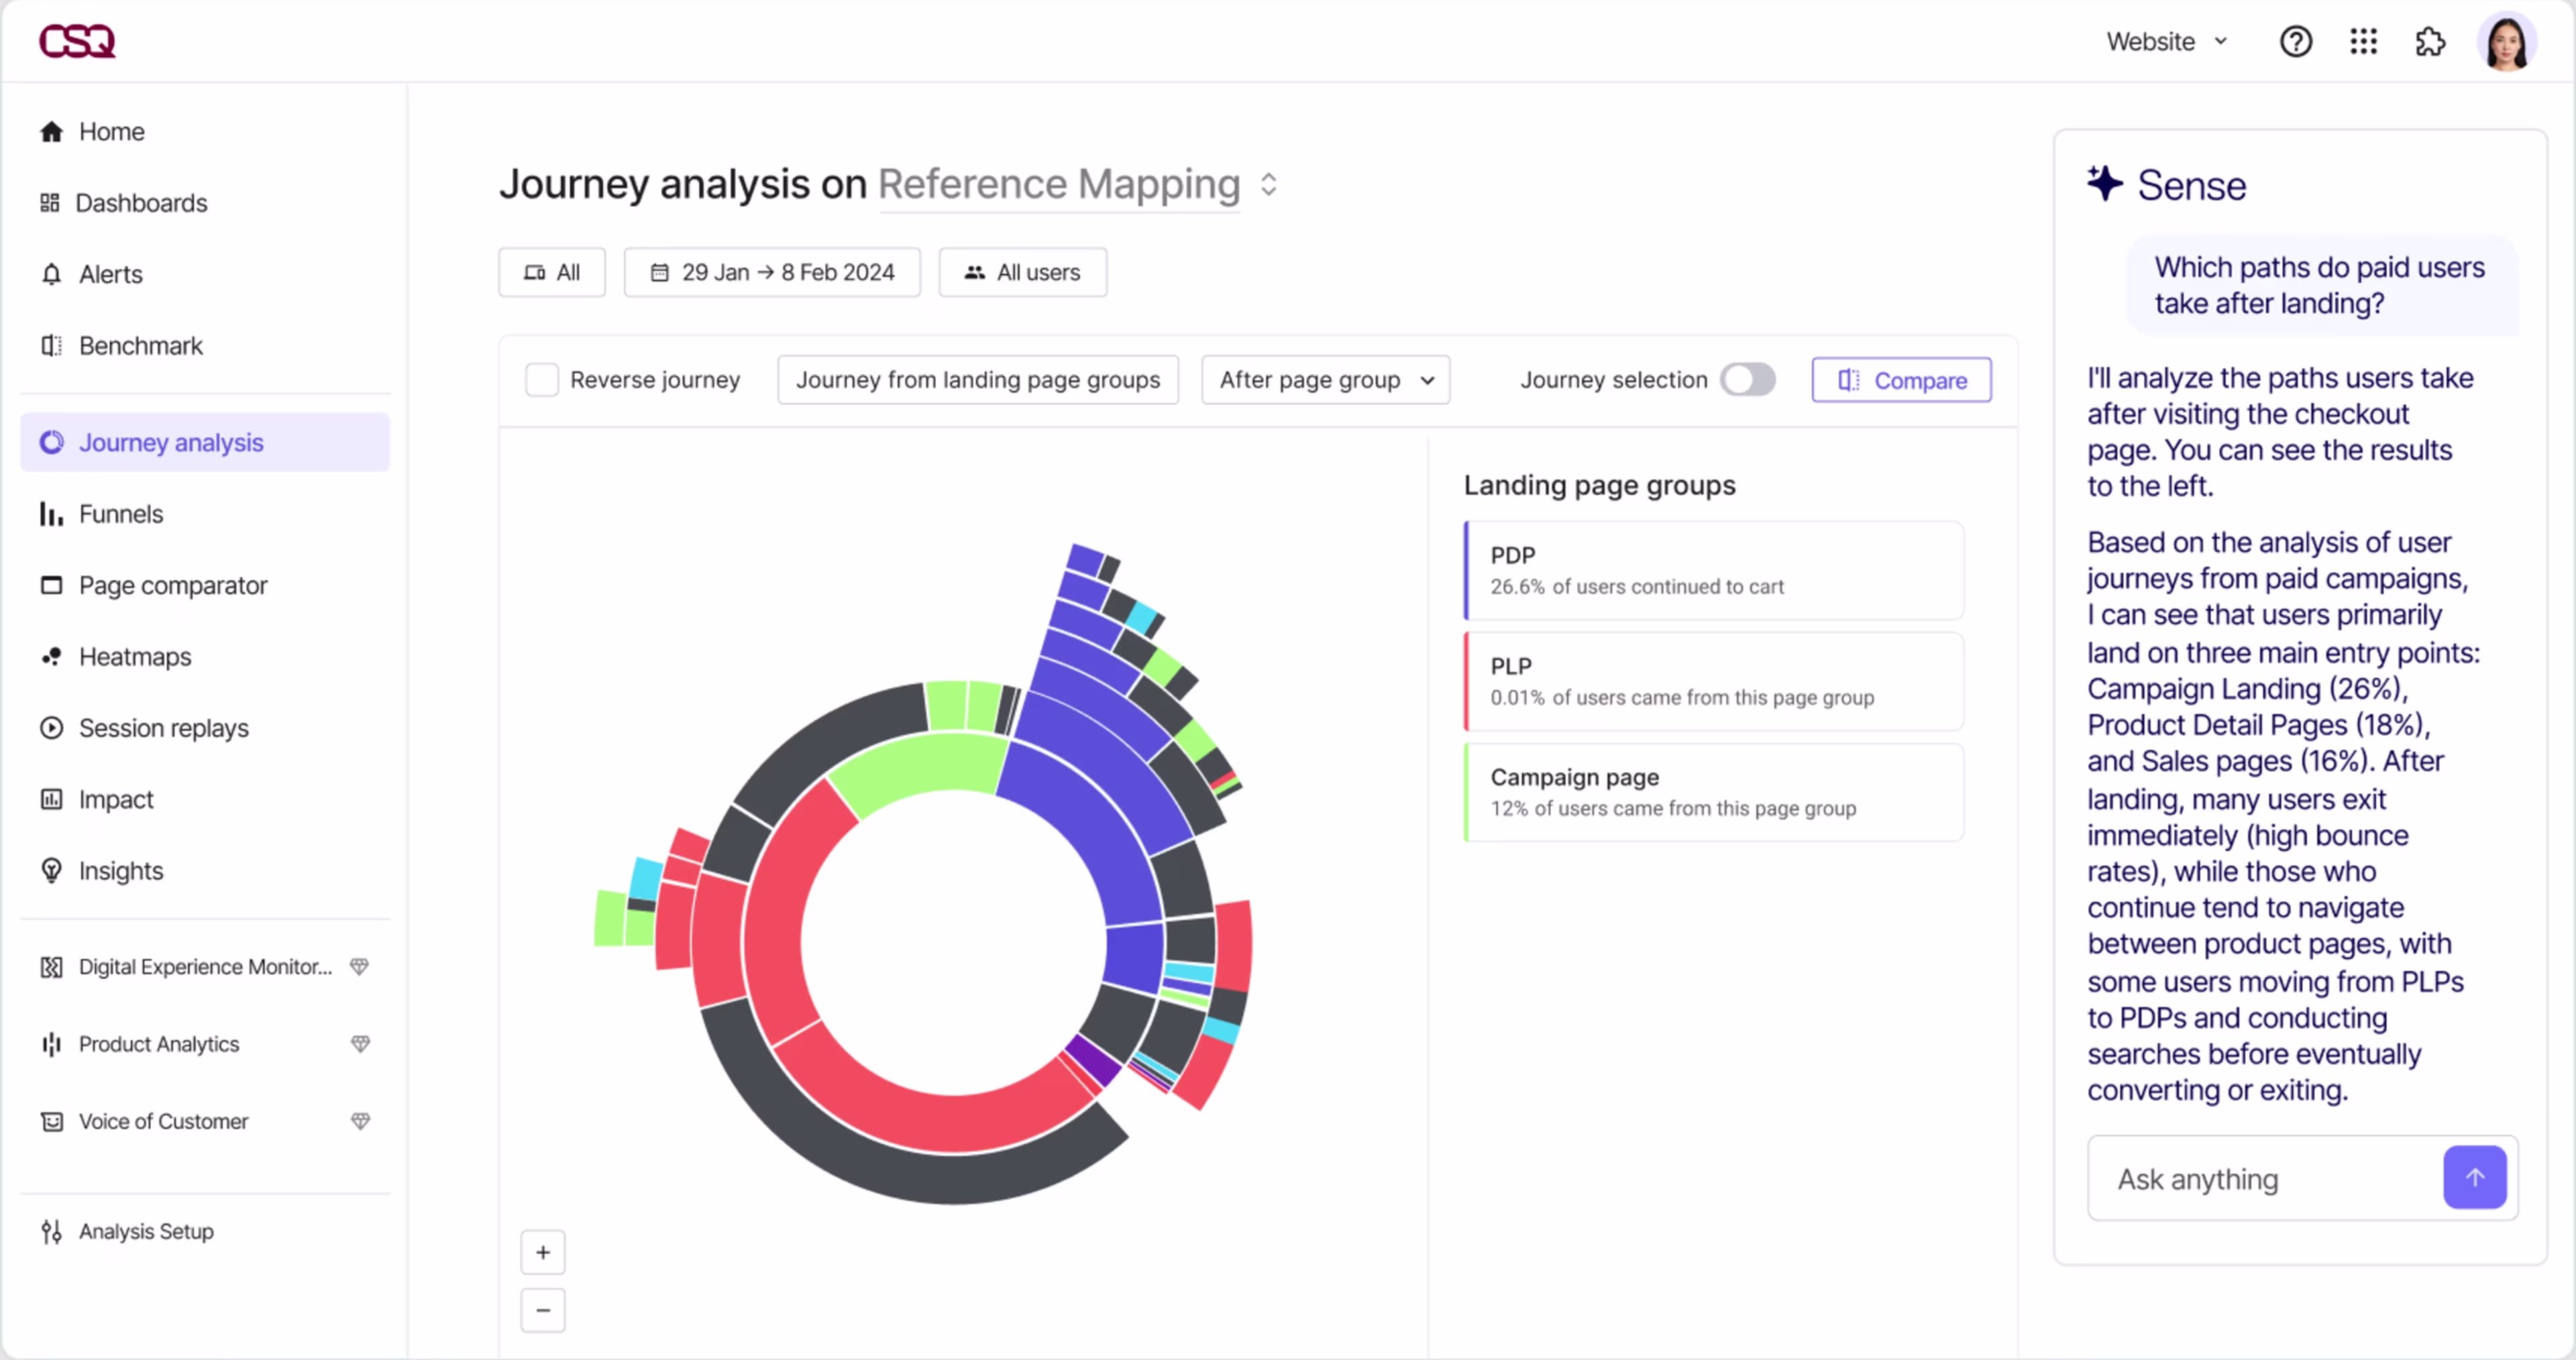
Chat with Sense in Journey Analysis to gather quick insights
4. Customer acquisition cost (CAC)
Customer acquisition cost measures how much you spend to attract and onboard a new customer. This cost relates to the effectiveness of marketing campaigns and assesses their return on investment. It also reveals inefficiencies in the sales funnel.
The basic formula for CAC is:
CAC = (Cost of sales + cost of marketing) / (Number of new customers acquired) |
|---|
CAC directly impacts a company’s profitability, which is why sales and marketing teams must ensure they’re growing their customer base sustainably. Generally, a high CAC can quickly outpace the revenue a customer generates over their lifetime (more on this below).
That said, the urgency of optimizing CAC differs by industry. A high CAC can be risky for software-as-a-service (SaaS) companies, where revenue trickles in monthly. Meanwhile, retail businesses can recover costs quickly through immediate transactions.
That’s why tracking CAC regularly is critical. Monitor it monthly to evaluate campaign ROI and quarterly to spot patterns early and act accordingly—for example, by pausing an underperforming ad campaign after 3 months if you’re seeing a negative ROI.
Tips to track and optimize CAC
Customer relationship management (CRM) platforms offer free online CAC calculators to help you easily track this metric. Complement this with a deep dive into user journeys, breaking them down by acquisition channels. Then, determine which channels deliver ideal journeys and invest more in them.
🤔 Did you know? Businesses are paying +9% more to turn traffic into conversions compared to 2024. However, digitally disciplined teams are combating rising acquisition costs by actively tying user behavior to their site’s or app’s technical performance.
For example, you can set up AI Alerts in Contentsquare to uncover issues affecting high-impact landing pages and then watch recorded sessions of users experiencing technical problems. Knowing exactly where the friction points are enables you to quickly resolve them and consistently deliver a delightful UX—boosting your conversion rates and bringing your CAC back under control.
Stay ahead of issues with Contentsquare’s AI Alerts
5. Customer lifetime value (CLV)
Customer lifetime value (CLV) estimates how much revenue you can earn from a customer from their first to last purchase. Basically, it’s the monetary value you place on entire customer relationships, not just individual transactions.
To get your CLV, you’ll first need to calculate a few building blocks:
Average purchase value = Total revenue [in a year] / Number of purchases
Average purchase frequency = Number of purchases / Number of unique customers
Customer value = Average purchase value X Average purchase frequency
Average customer lifespan = how long a customer continues buying from you (in years)
Now, we can calculate your simple CLV:
CLV = Customer value X Average customer lifespan |
|---|
⚡ Quick note: use simple CLV for quick benchmarking. When you need deeper, more accurate forecasts to make long-term investment decisions, explore advanced CLV models such as gross margin CLV and predictive CLV.
CLV provides more valuable insights when compared against CAC. A CLV that’s consistently higher than CAC validates your digital analytics strategies. The sweet spot for most businesses is a CLV:CAC ratio of 3:1. That means for every $1 you spend acquiring a customer, you get $3 in revenue.
Conversely, a consistently lower CLV indicates red flags that need fixing, such as misaligned audience targeting, poor customer retention, or low product stickiness.
Tips to track and optimize CLV
You can use an online CLV calculator (usually offered by your CRM) dashboard to calculate this metric and start analyzing it with your CLV. You can also include other metrics directly or indirectly influencing your CLV, such as customer retention rate, churn rate, and Net Promoter Score® (NPS®).
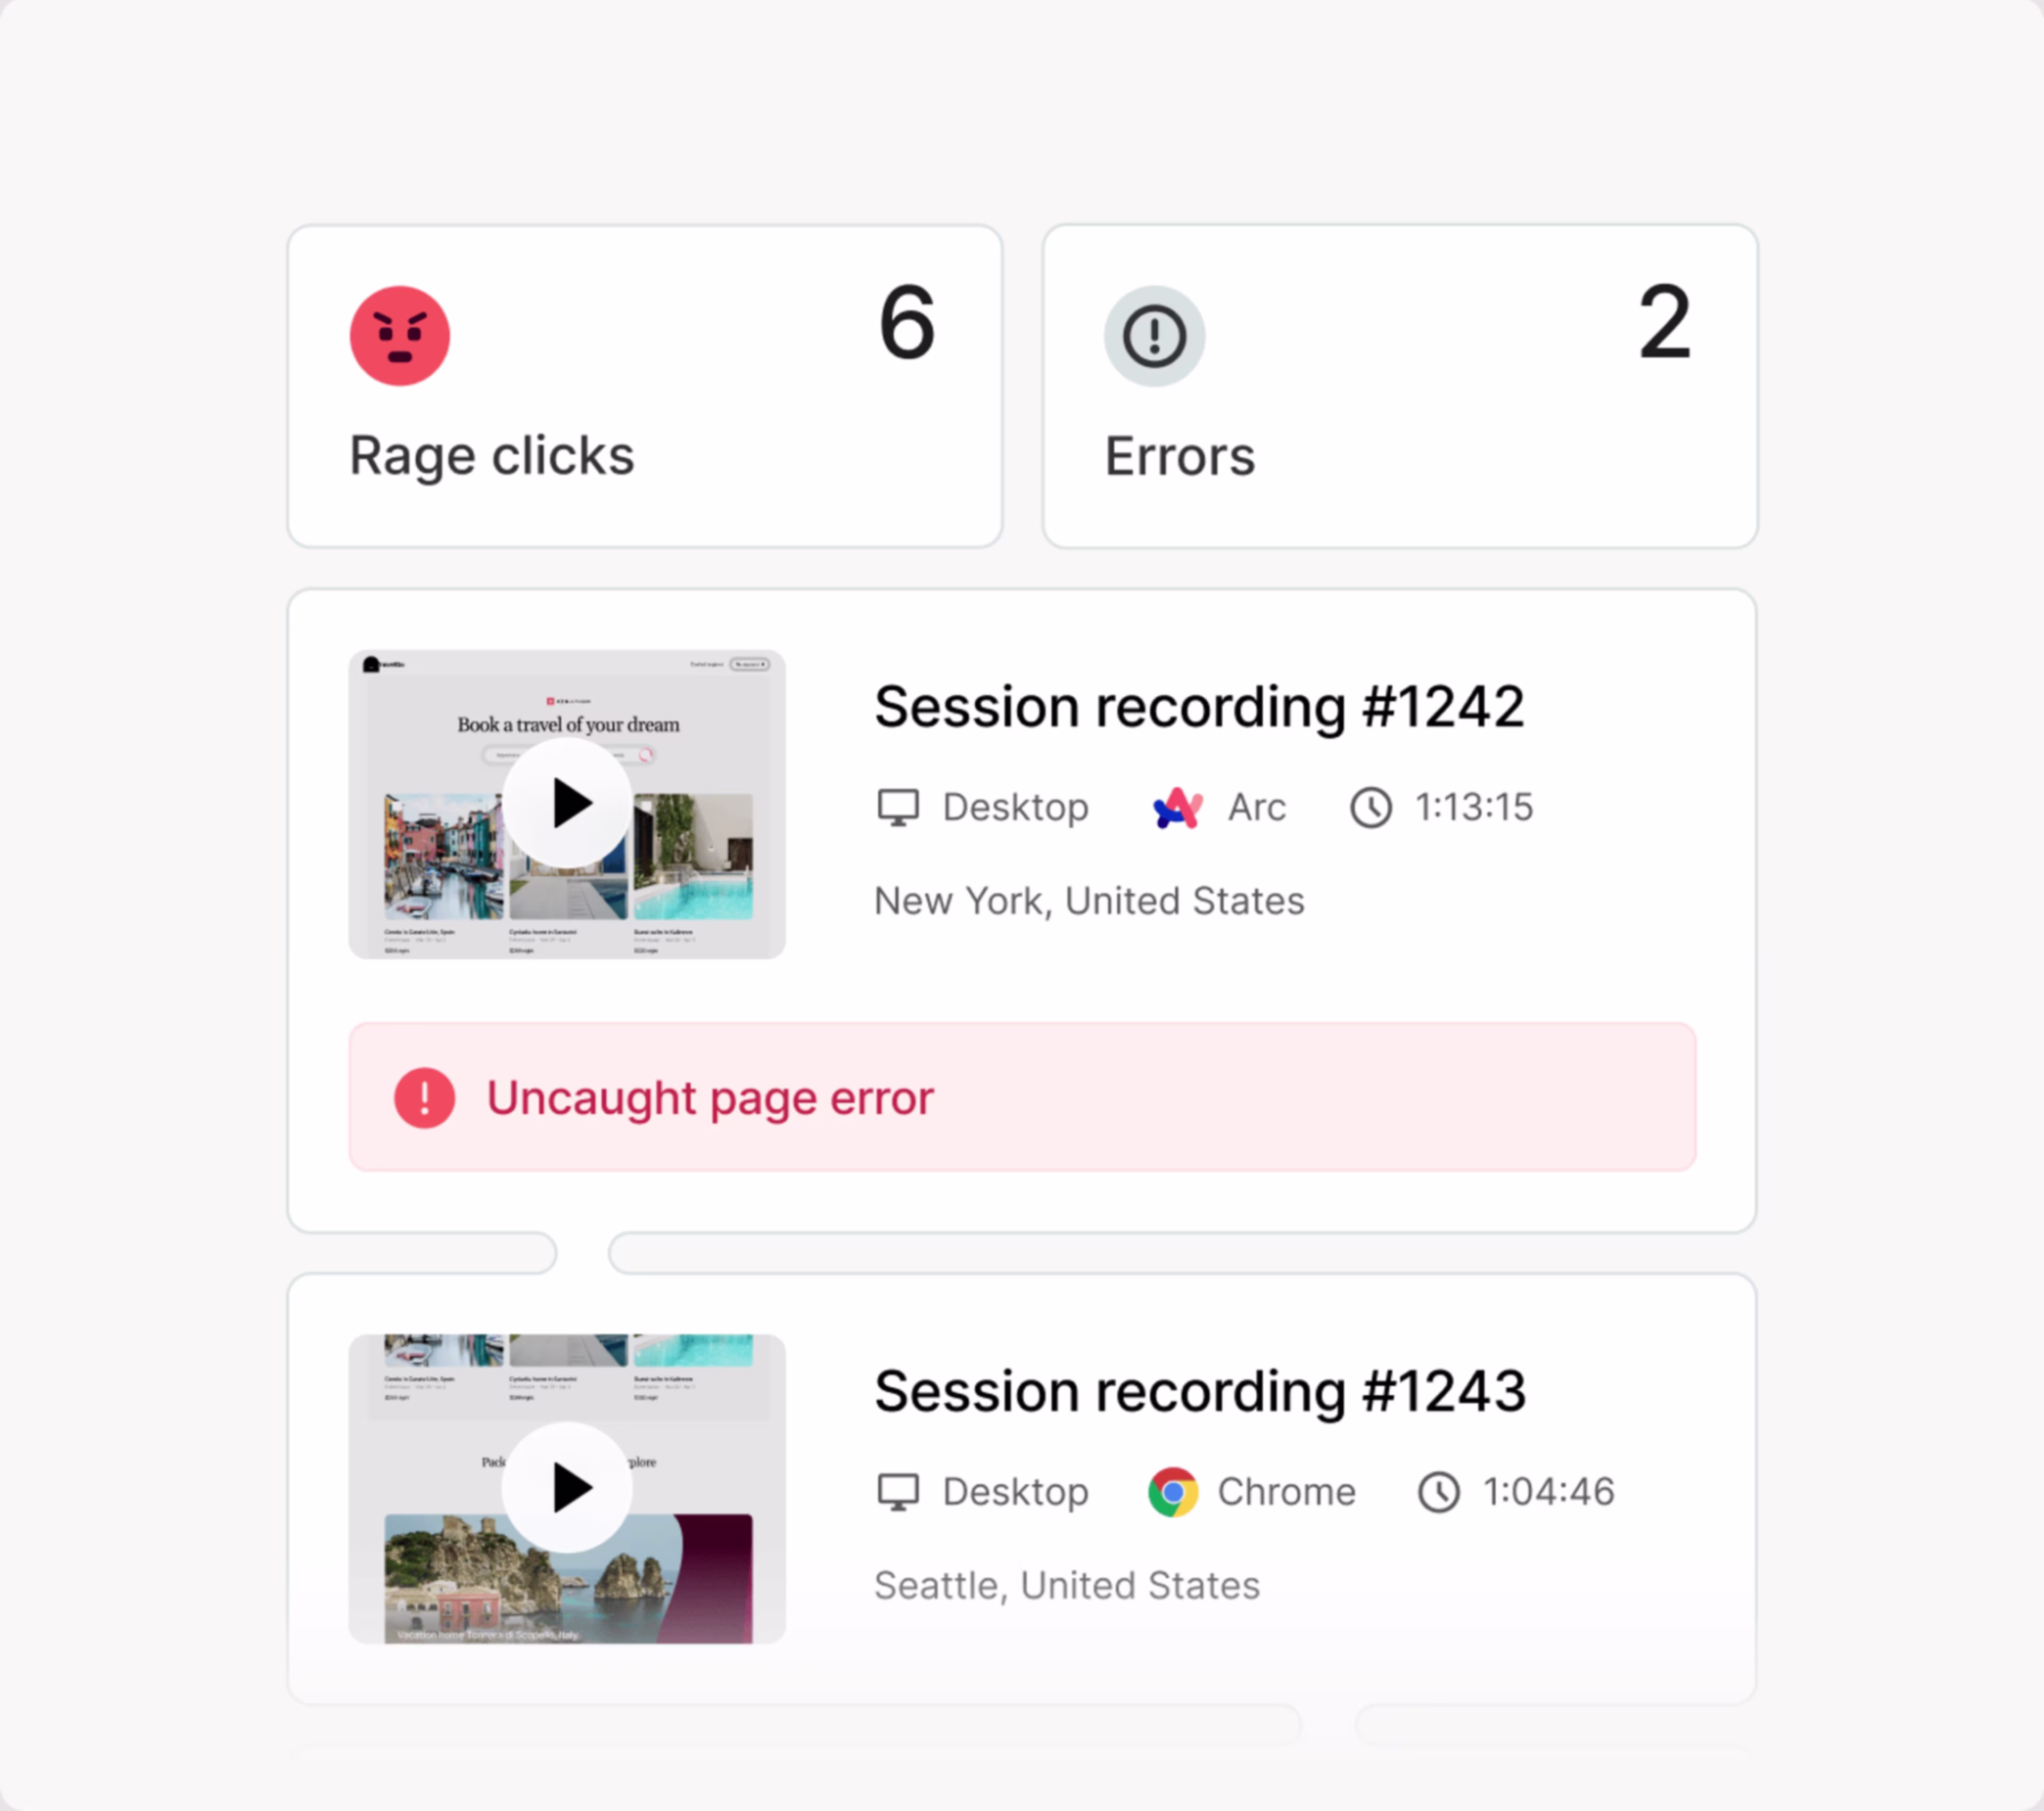
📉 Deepen your analysis to increase CLV: improve the core driver of retention, churn, and satisfaction by optimizing digital CX. Start by reviewing your digital analytics dashboard for key metrics, such as click-through rate, exit rate, and conversion rate. Then, layer in session replays to get a fuller picture of how people move through your site, including interactions that lead to bounces and conversions.
Watch session recordings in Contentsquare to understand how users move through your site
6. Customer retention rate
Customer retention rate is the percentage of customers you retain over time. It reflects your ability to keep customers engaged, satisfied, and loyal, rather than losing them to competitors.
The formula for customer retention rate is:
Customer retention rate = (Number of customers at the end of a period - Number of new customers acquired during the period) / Number of customers at the start of the period) x 100 |
|---|
Retention plays a critical role in the overall user journey, signaling that your product or service goes beyond attracting users and delivers lasting value.
Encourage your customers to renew their subscriptions, upgrade to higher-tier plans, or use key features to strengthen their connection to your product or service.
Tips to track and optimize customer retention rate
Use your CRM and VoC platforms (like Contentsquare) to collect customer journey metrics that contribute to calculating customer retention rate, such as conversion rate, CLV, CSAT, and NPS®.
If you want to track returning visitors and conversions without manual calculations, use Contentsquare’s Retention Analysis, powered by Heap. The dashboard capability lets you attribute conversions to specific touchpoints so you can see which experiences drive loyalty—and which ones may be hindering retention.
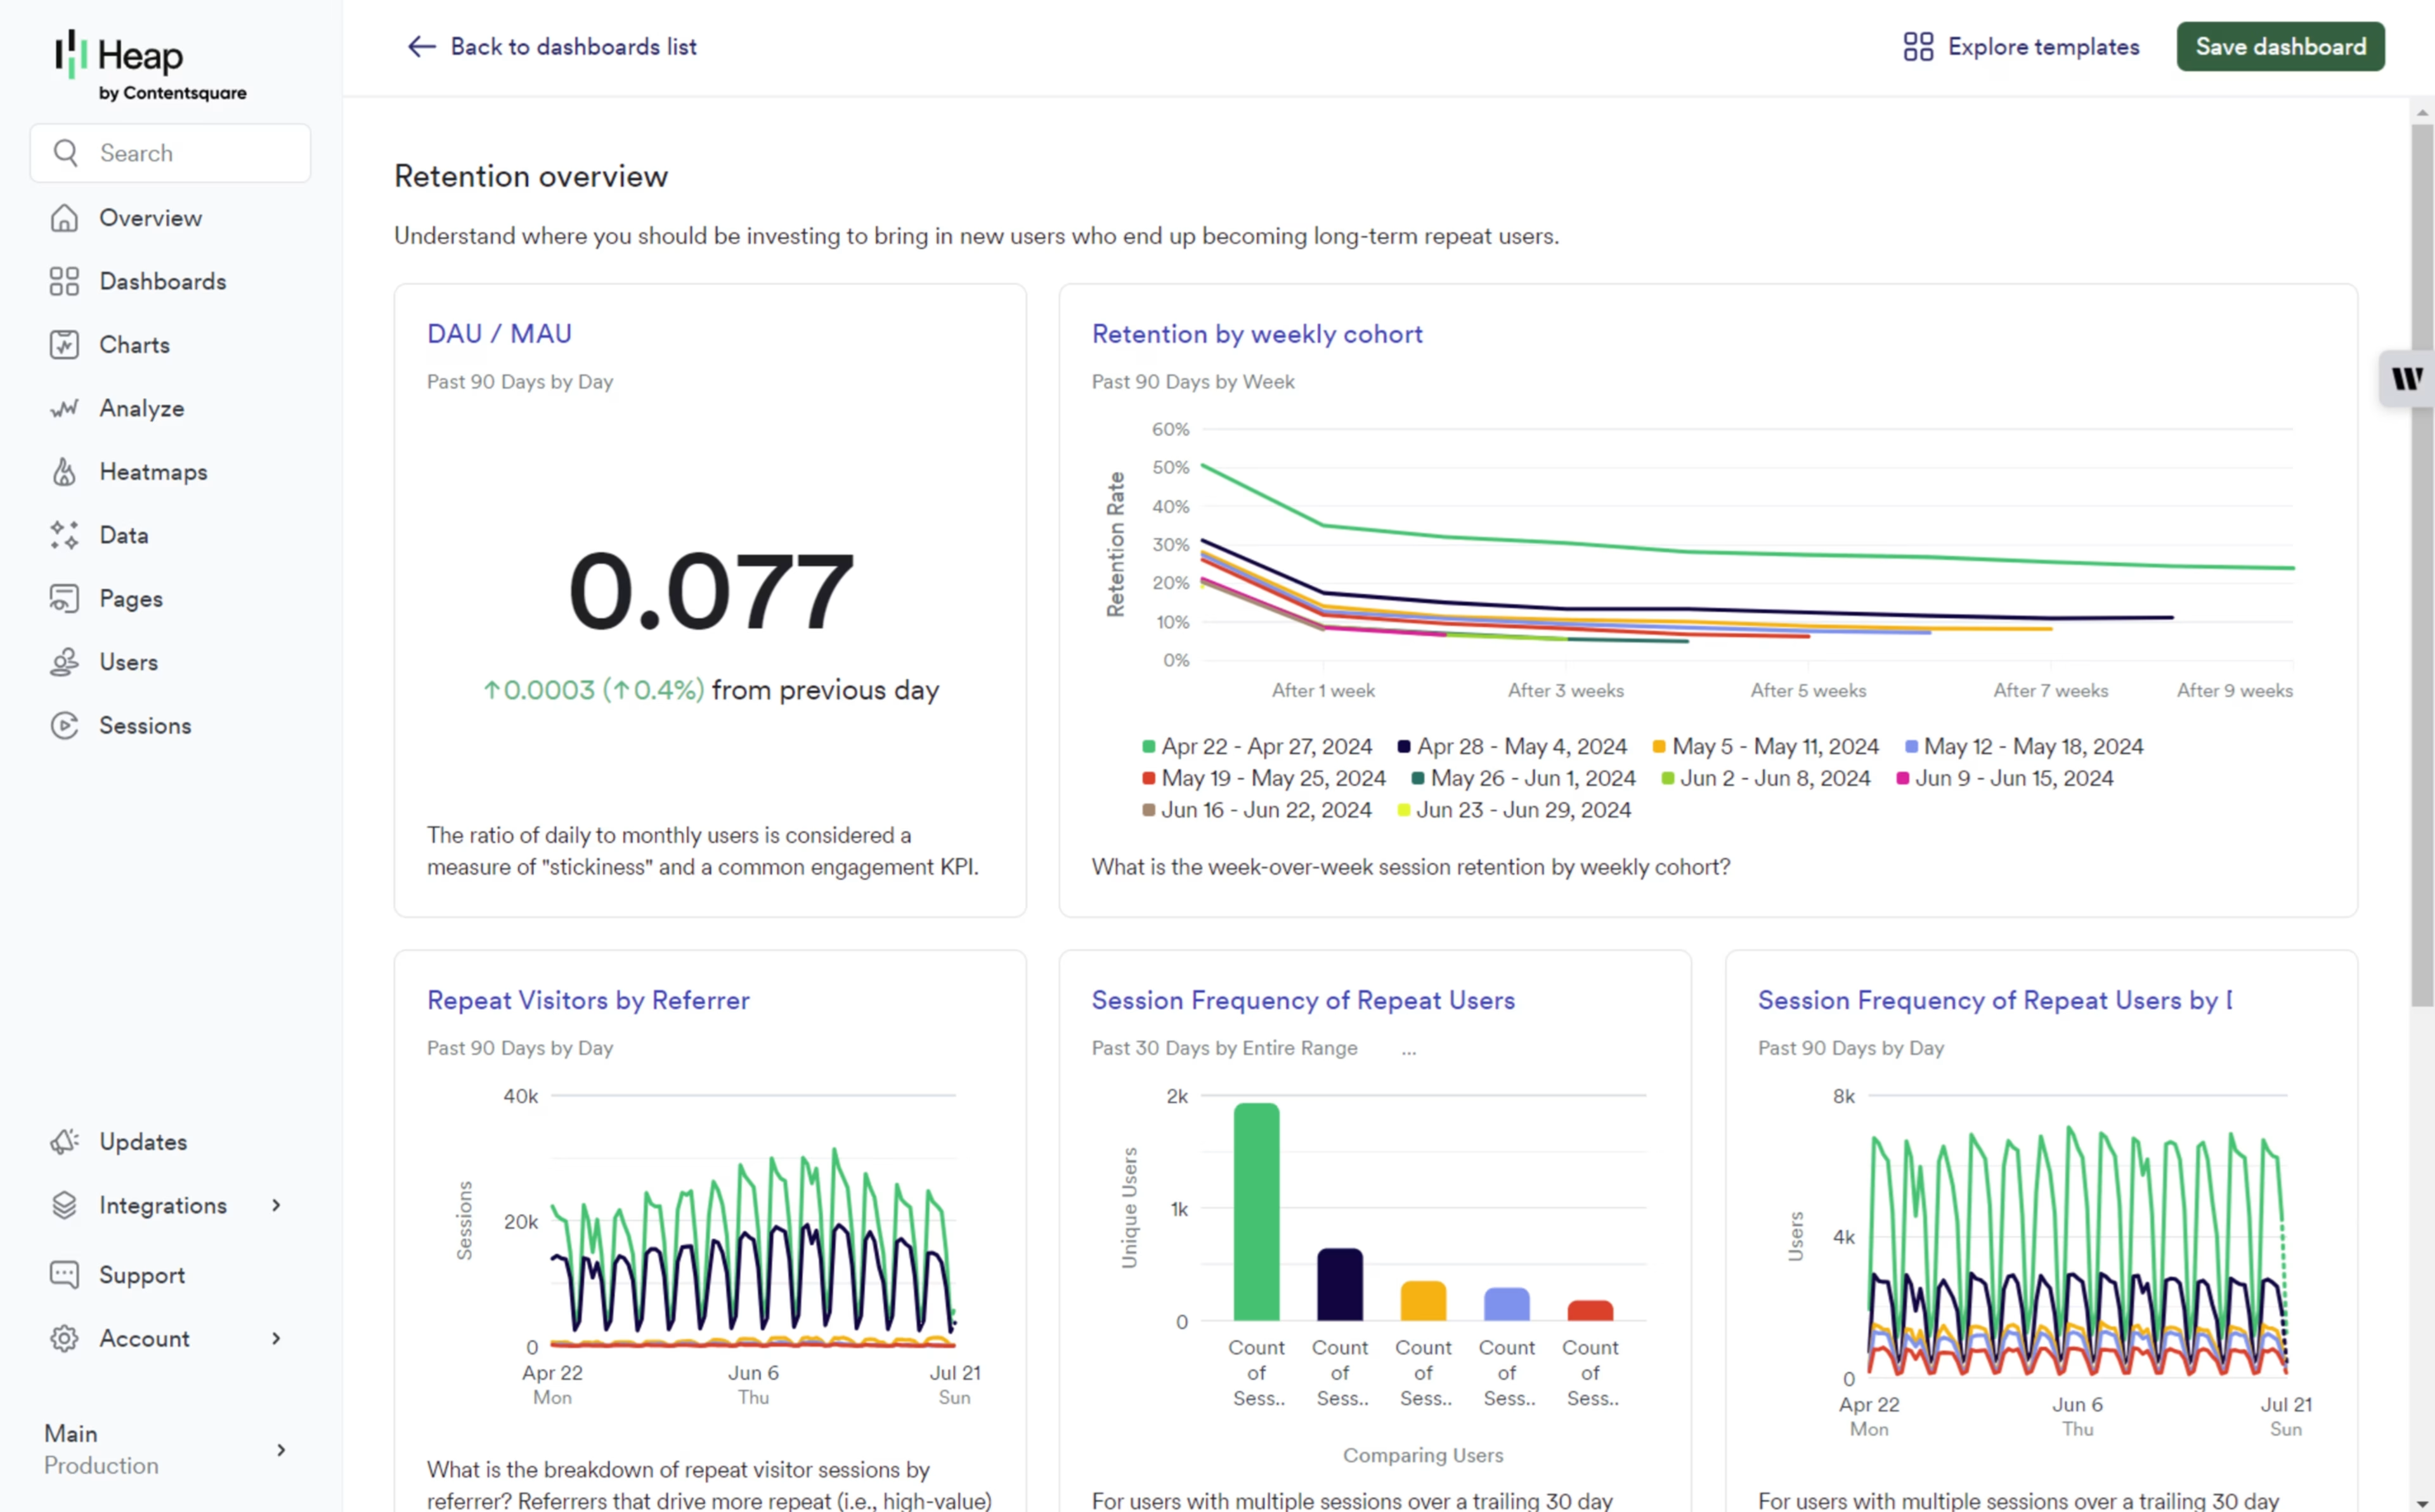
Use Retention Analysis to understand your high-value customers better
7. Churn rate
Churn rate is the percentage of existing customers you lose over time—the opposite of retention rate. Customers leave for many reasons, from pricing concerns to competitor switching.
Besides tracking retention efforts, this metric shows how vulnerable your business is to customer turnover.
Here’s how to calculate your churn rate:
Churn rate = (Customers lost during a period / Customers at start of a period) x 100 |
|---|
Revenue, product, and customer success teams should monitor churn rate regularly to identify risks early. For example, in SaaS, even a small decline in subscription renewals can immediately impact monthly recurring revenue (MRR) and overall growth.
Tips to track and optimize churn rate
Ensure you’re capturing lifecycle stages, cancellations, or deal outcomes to track churn rate effectively. Most CRMs will let you create a churn dashboard once these data points are in place.
🤔 Did you know? Tracking your churn rate is just the starting point. To understand why your customers churn, use Contentsquare’s Journey Analysis capability to track end-to-end customer interactions. Then, turn to Session Replay and Heatmaps to pinpoint behaviors preceding churn, such as drop-offs during onboarding or repeated navigation issues.
Then, pair these insights with Contentsquare’s Voice of Customer (VoC) capabilities, such as Surveys and Interviews, to validate those patterns with real customer insights.
![[Product illustration] Interviews - 4 people meeting](http://images.ctfassets.net/gwbpo1m641r7/1pnTF7gILq6ceAdMPr4Mkt/9bfe5c31882dc81eee98b3eee10a8cc3/User_interview.png?w=1920&q=100&fit=fill&fm=avif)
Contentsquare lets you schedule, host, and record customer interviews so you can find out why certain users churned
So we collect customer feedback with surveys, or sometimes we also do qualitative interviews with customers or internally within the company. We have Contensquare,(...) and we collect them precisely with the various surveys we use on each touch point, on each page, what is clear, what is not clear, whether they understood a certain type of product or not and so we collect the feedback. For me, the right insights are a mixture of qualitative and quantitative and so we always need to understand ‘why’ as well as ‘how’ to do things correctly.
8. Customer satisfaction (CSAT) and Net Promoter Score® (NPS®)
Customer satisfaction captures how happy your customers are with your product, service, or experience. Net Promoter Score® measures how likely they are to recommend your product or service to others, using a 0–10 scale.
With these VoC feedback scores, marketing, product, and support teams add qualitative depth to product and customer experience metrics.
CSAT surveys work best when sent right after key interactions, while NPS® surveys are more suitable for measuring long-term customer loyalty and brand perception.
For example, you can launch
A CSAT survey after checkout to evaluate the purchase experience
An NPS® survey to track shifts in customer sentiment after a pricing change
Tips to track and optimize CSAT and NPS®
Contentsquare’s VoC product lets you create AI-powered surveys in seconds. Simply type your goals and the platform will generate relevant questions. You can also start from a template or build a custom survey from scratch.
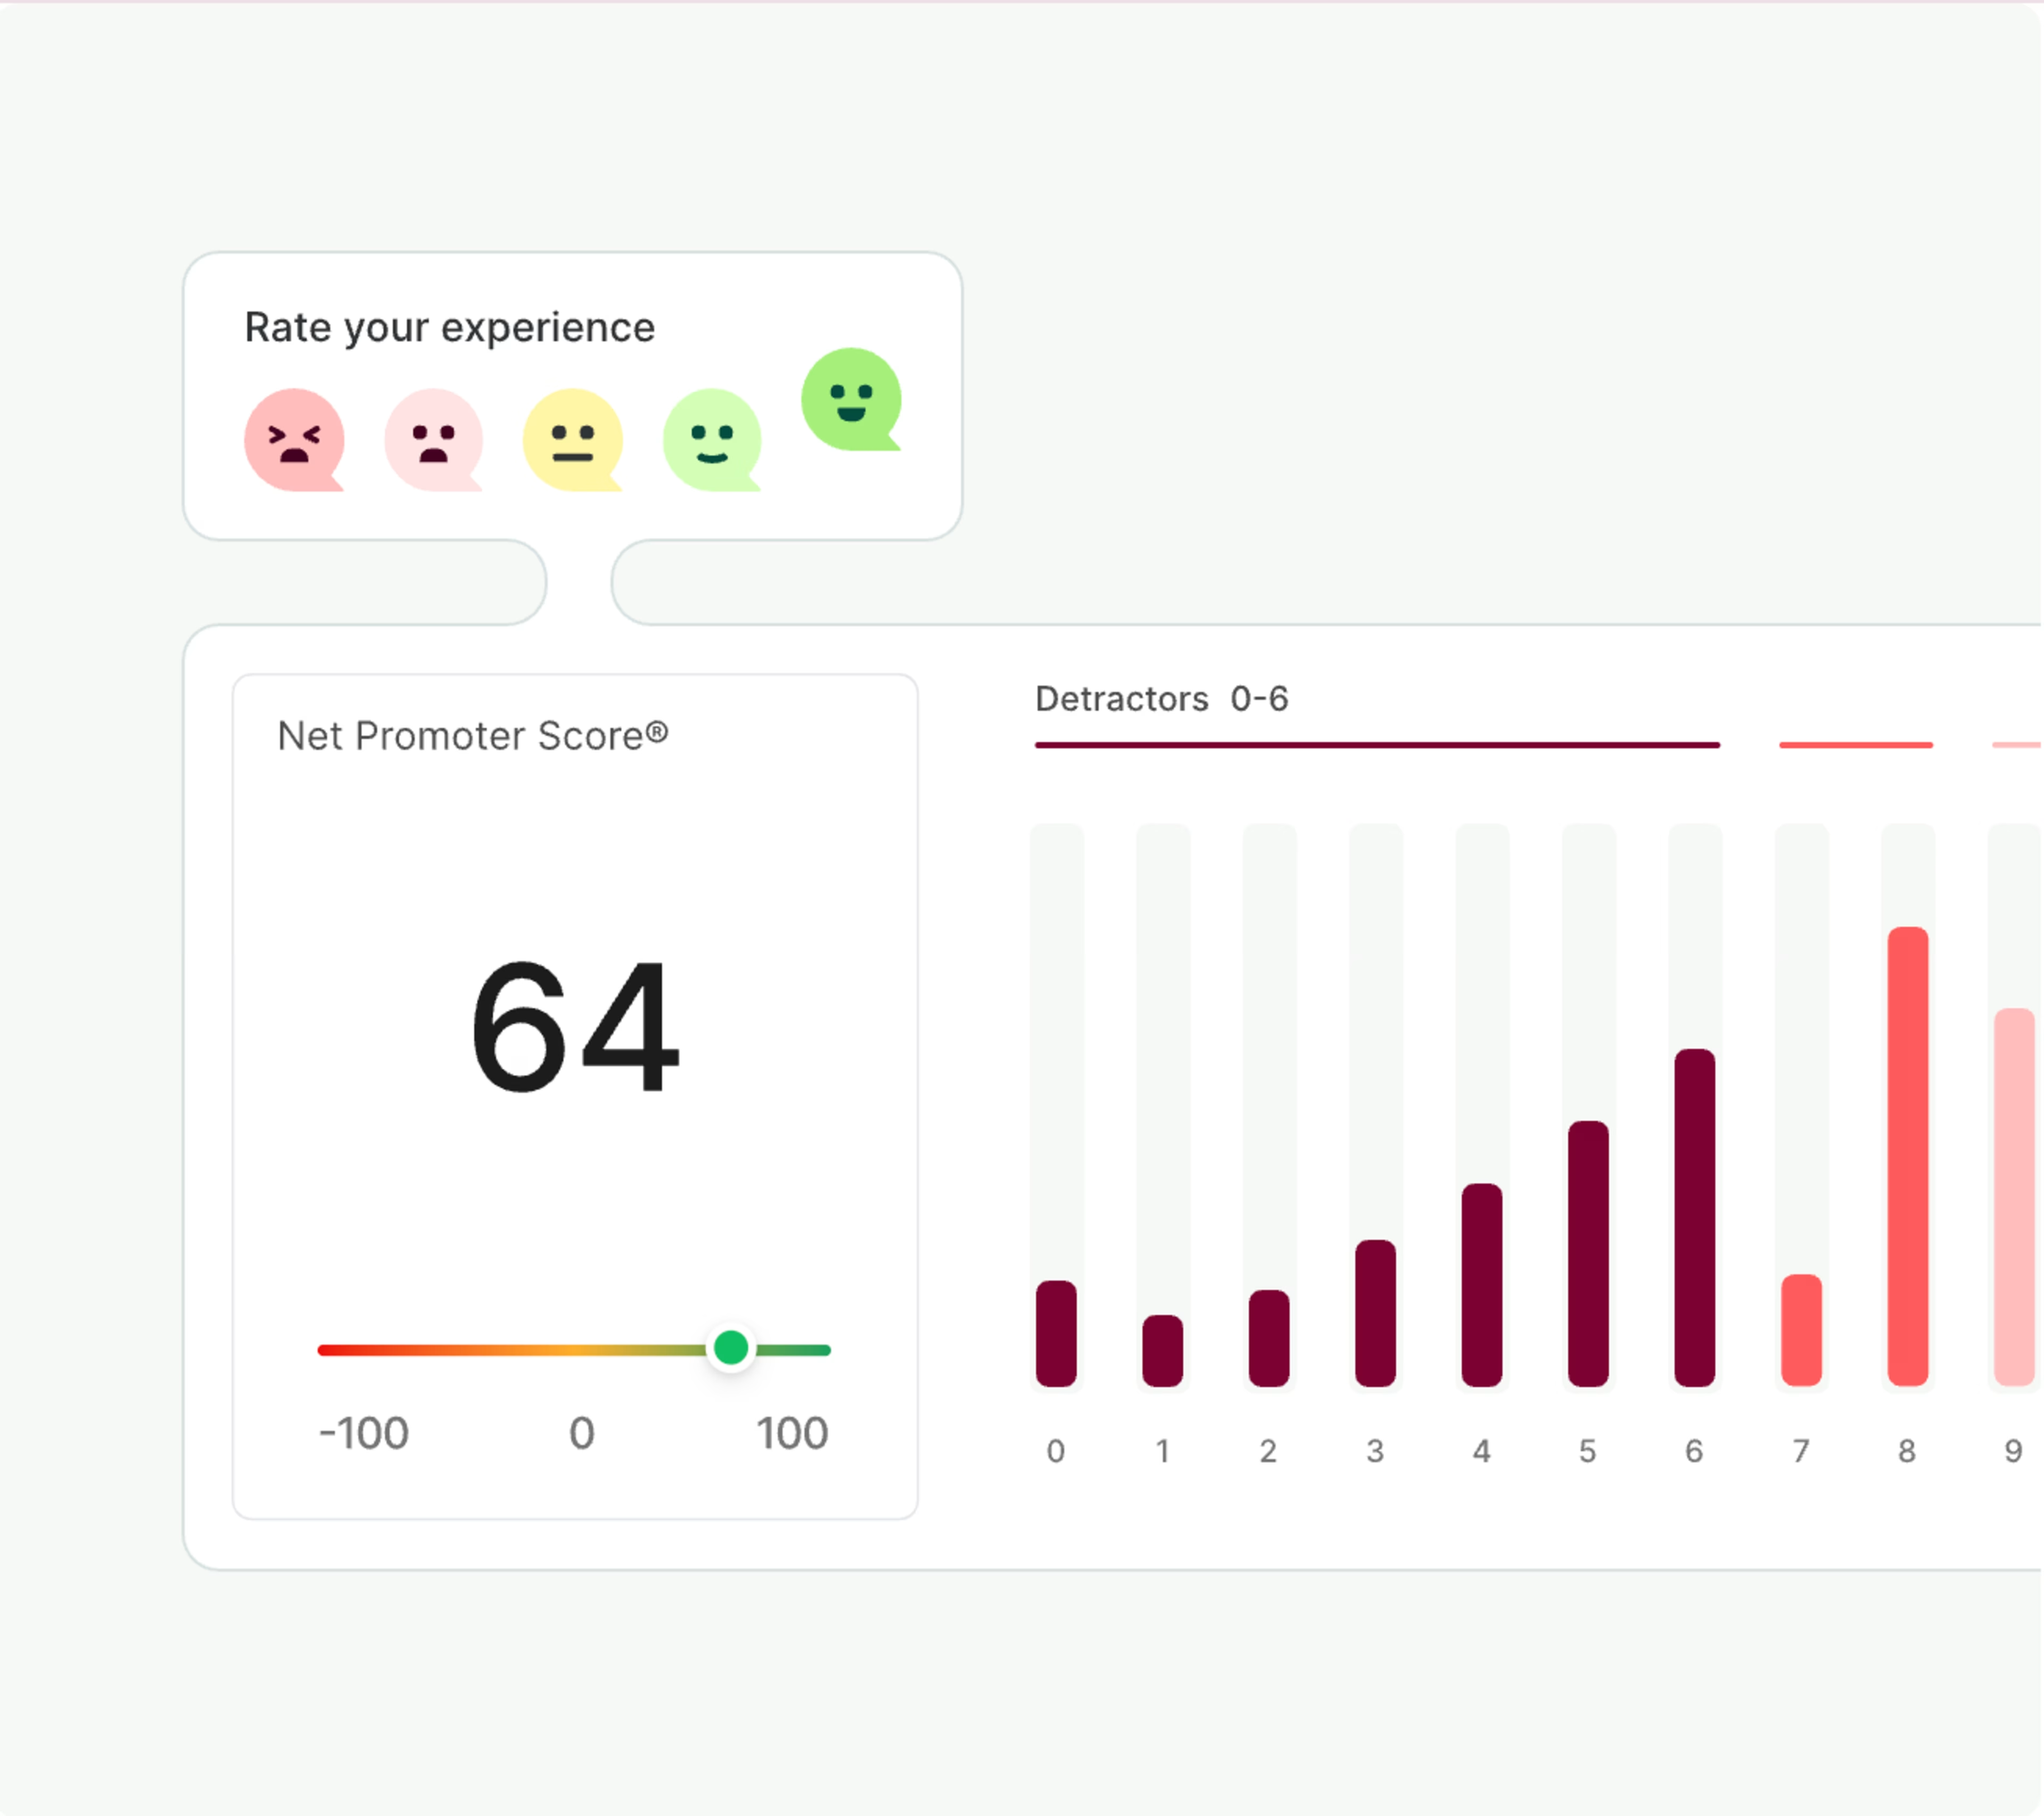
Quickly launch an NPS® survey with Contentsquare to know how your customers truly feel about your brand
9. Rage clicks and u-turns
Behavior analytics metrics such as rage clicks and u-turns are powerful diagnostic tools that offer visual clues about where frustration is building up on your site or app.
Rage clicks happen when a user rapidly clicks or taps 5 times or more in a row on an unresponsive element, such as a broken button or an image they expect to be interactive
U-turns occur when a user visits a new page but quickly returns to the previous one, often because of irrelevant content or a poorly labeled menu
Tips to track and reduce rage clicks and u-turns
Contentsquare’s frustration score feature automatically pinpoints your biggest UX blockers by detecting behaviors like rage clicks, repeated taps on mobile, and u-turns.
When tied to Contentsquare’s Impact Quantification capability, you can see which frustrations are costing you the most in lost conversions and prioritize resolutions based on the greatest business impact.
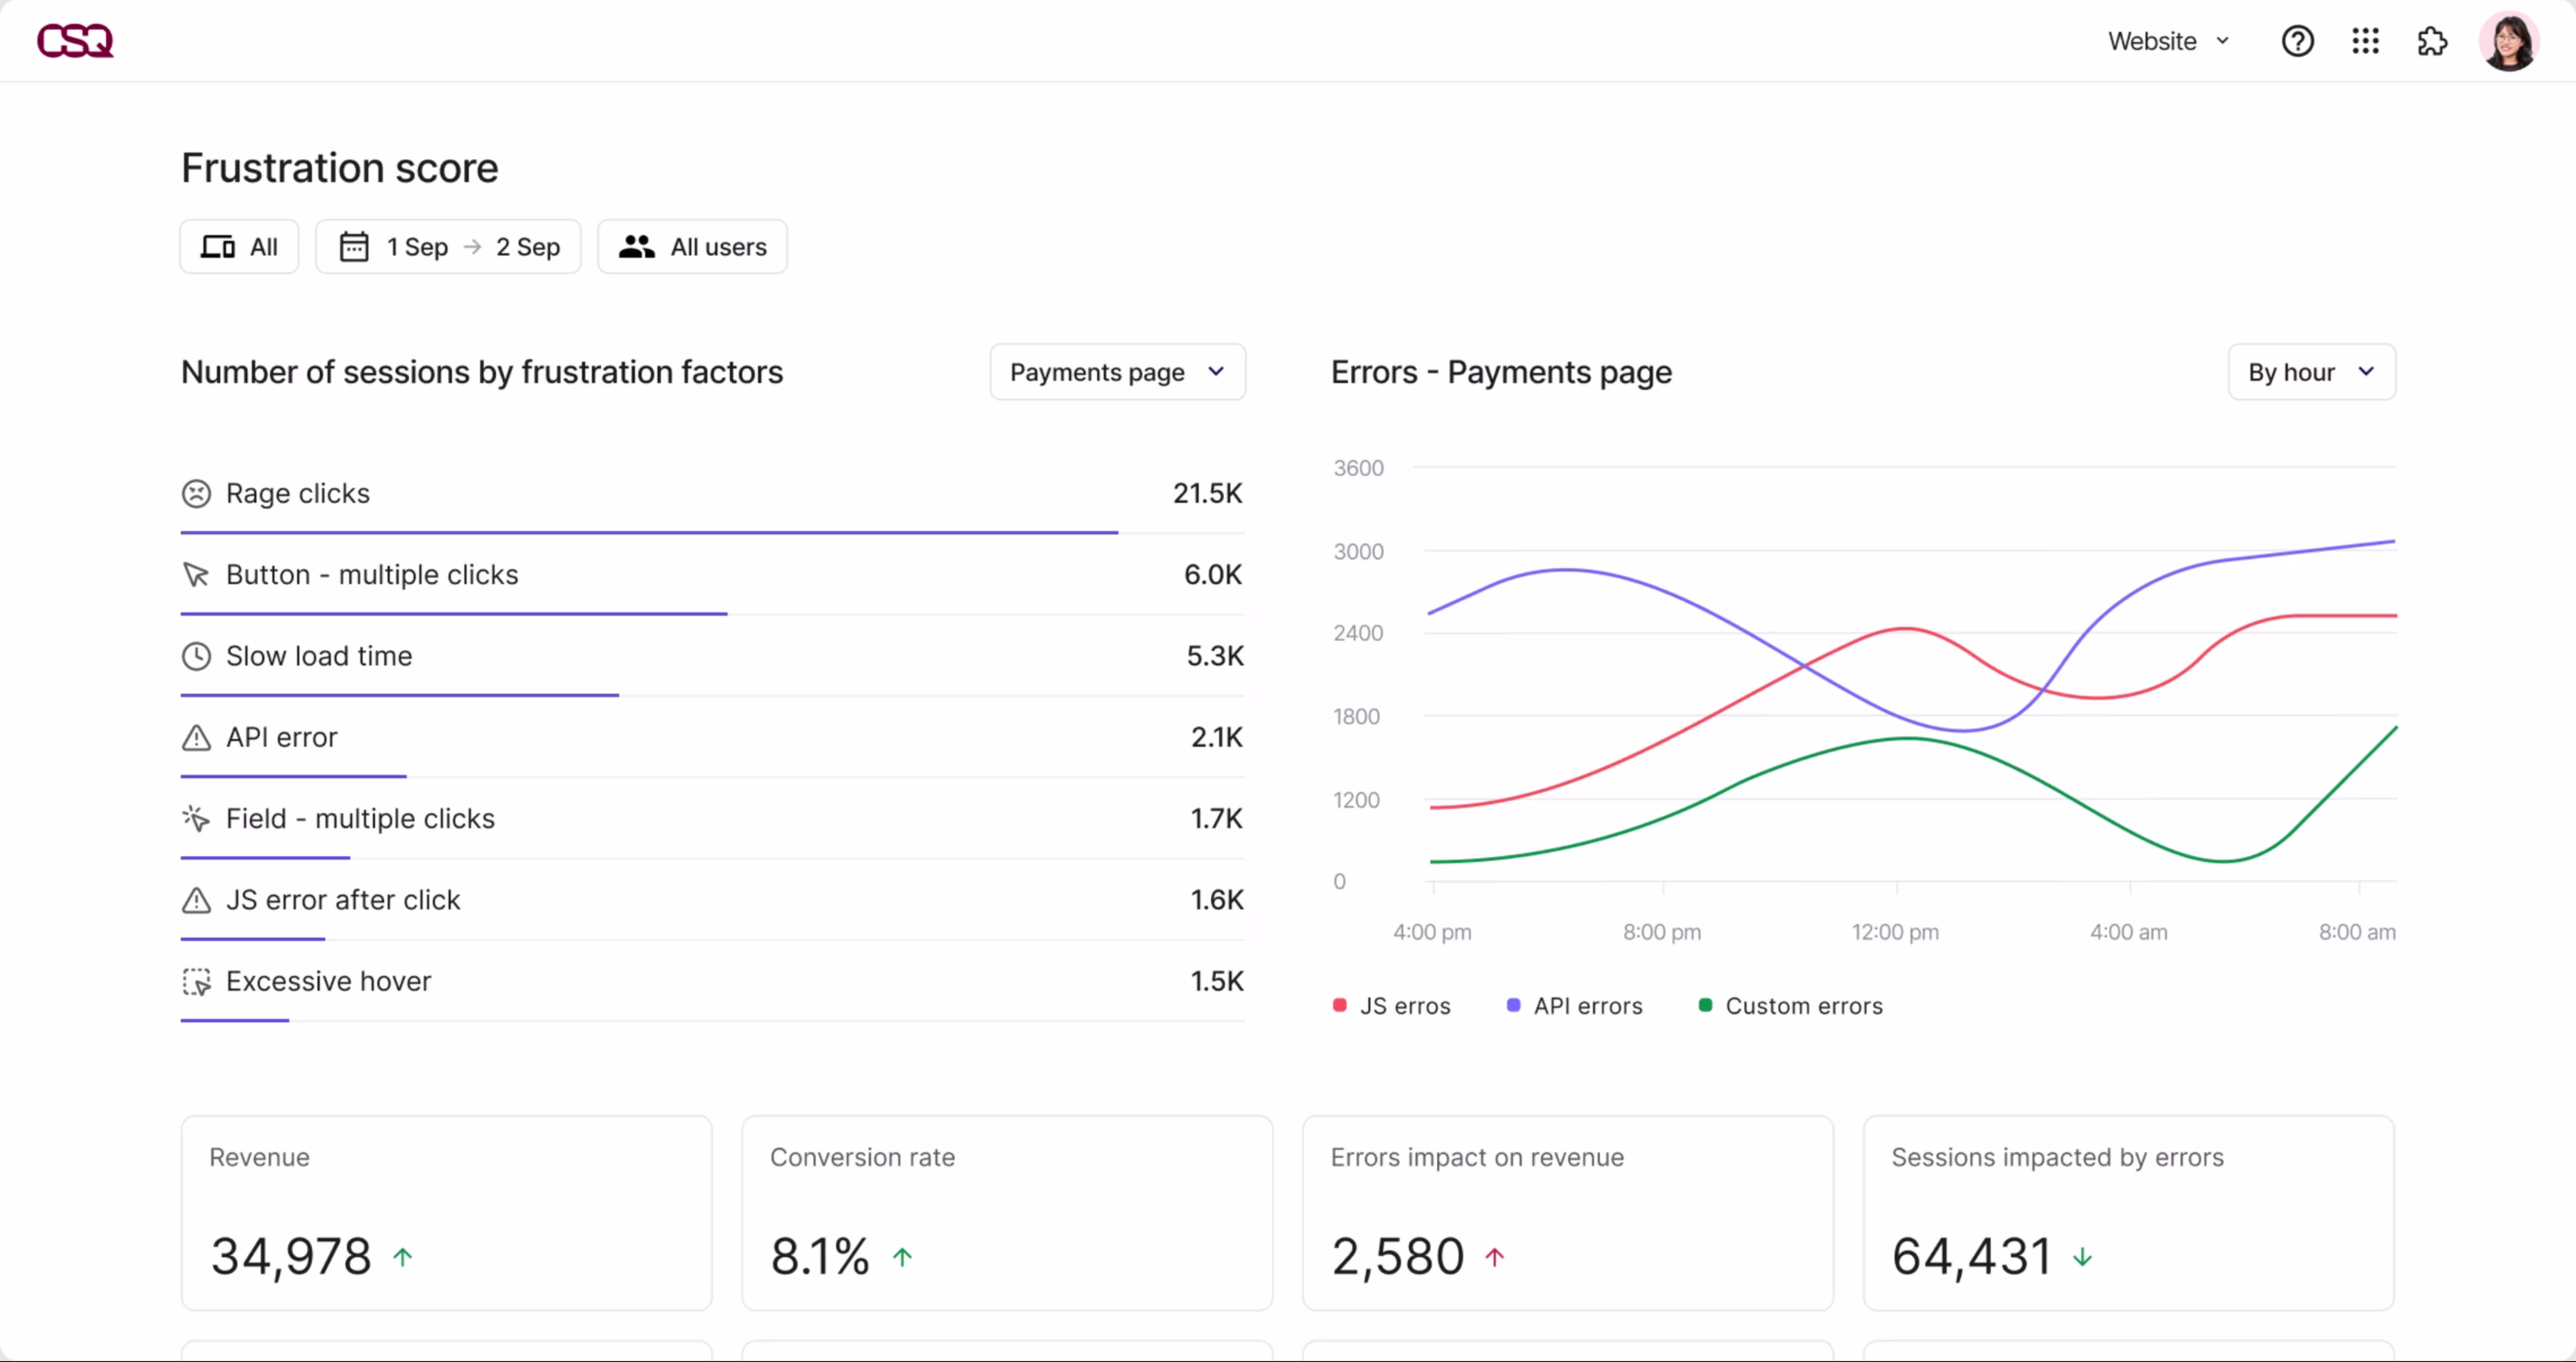
Use Contentsquare’s frustration score to uncover, quantify, and prioritize your biggest UX issues
10. JavaScript and other technical errors
Errors, especially JavaScript ones, are more common than most teams realize. Tracking them as part of your digital analytics setup helps you catch problems before they quietly erode your UX and impact business outcomes.
However, surfacing errors isn’t enough. You need to quantify their impact, prioritize fixes, and resolve them efficiently.
Tips to track JavaScript and other technical errors
Contentsquare’s Error Analysis capability detects both technical and usability errors harming your conversions and revenue. It flags issues like broken buttons, failed form submissions, page load failures, and JavaScript errors, even if users don’t report them.
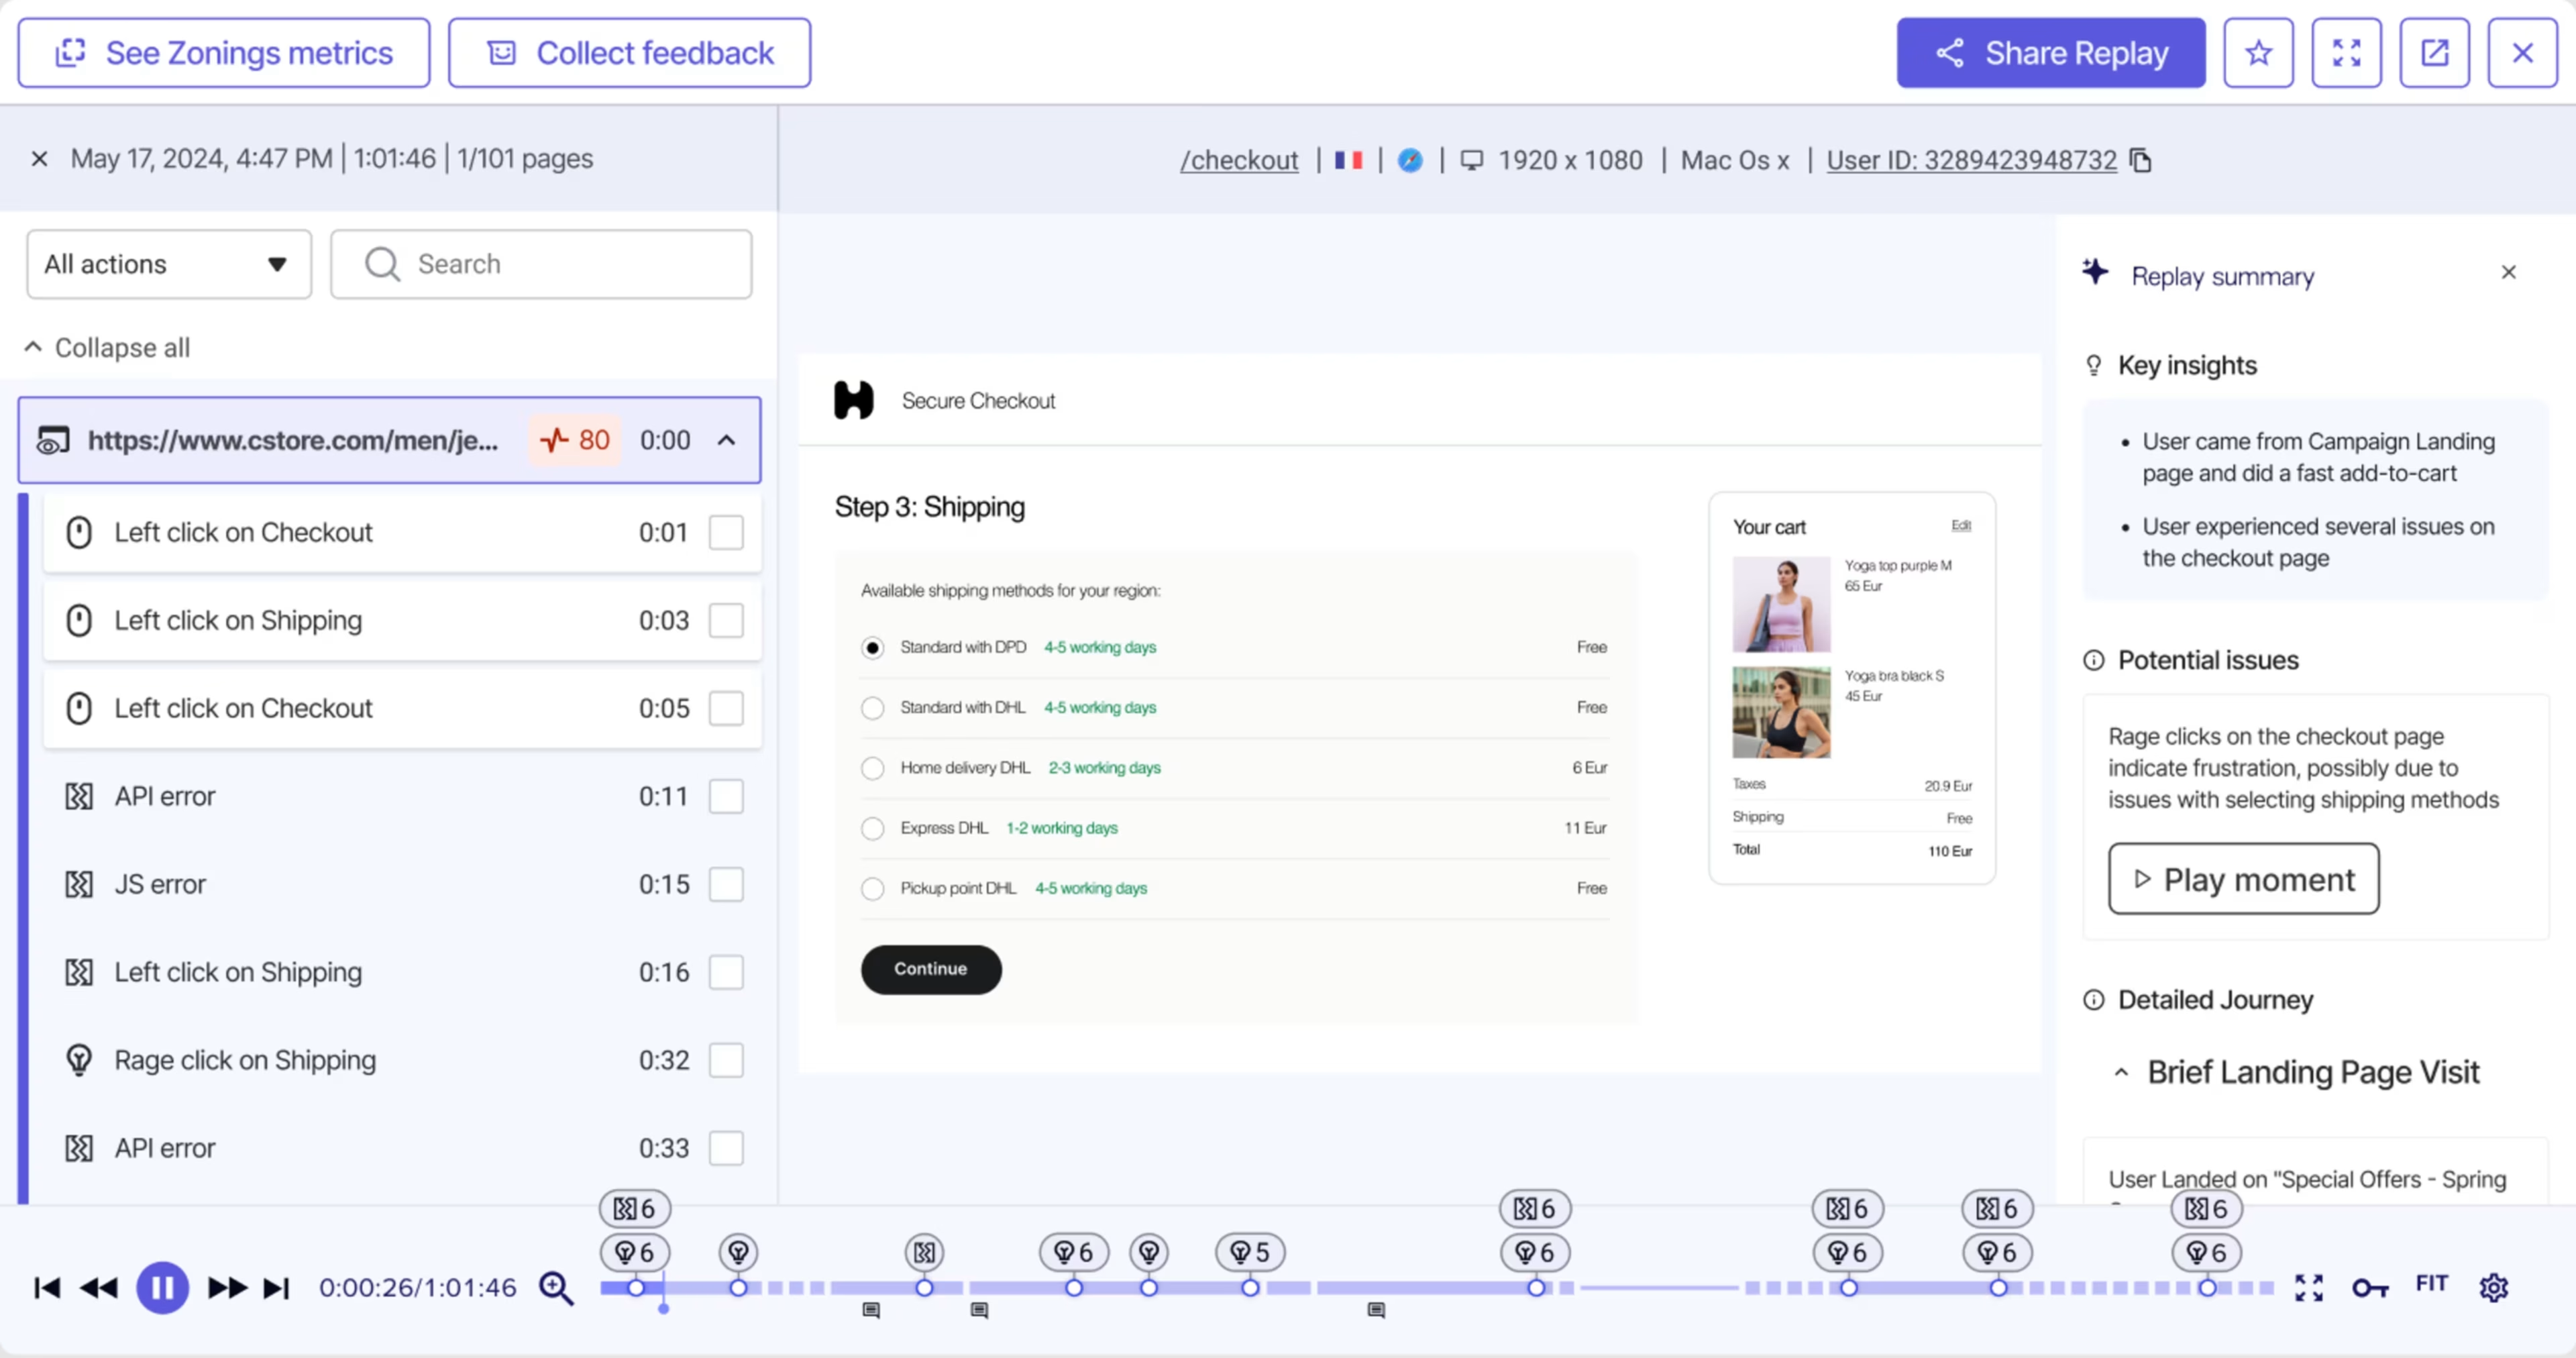
You’ll see exactly where errors occur and how frequently, along with which segments are affected. You can then investigate how these are affecting user journeys in session replays.

Jump from Error Analysis to Session Replay to see which issues are impacting user journeys and need urgent attention
Measure what truly matters
It’s easy to get buried under a mountain of digital data. But growth doesn’t come from tracking everything—it comes from tracking the right metrics.
By focusing on high-impact digital analytics metrics—and performing a regular digital analytics audit—you can prioritize strategies and improvements that address your customers’ needs across different lifecycle stages. This helps you keep your eyes on the prize: the delight of your customers and the growth of your bottom line.
Digital analytics is the process of collecting, analyzing, and interpreting data from your various digital properties—including your website, app, and social media channels.
A good data analytics setup combines behavioral, product, and customer experience metrics to capture and enhance your users’ digital experiences.
![[Visual] Contentsquare's Content Team](http://images.ctfassets.net/gwbpo1m641r7/3IVEUbRzFIoC9mf5EJ2qHY/f25ccd2131dfd63f5c63b5b92cc4ba20/Copy_of_Copy_of_BLOG-icp-8117438.jpeg?w=1920&q=100&fit=fill&fm=avif)

![[Behavior analytics] Metrics - Cover Image](http://images.ctfassets.net/gwbpo1m641r7/438jQ5yR89yz9q5d4NjmmY/d1778700fbd831f141c6dd4dc498a82d/BLOG-SMB-survey-tools-5838317.jpeg?w=1920&q=100&fit=fill&fm=avif)