![[Visual] Man at computer - stock](http://images.ctfassets.net/gwbpo1m641r7/7GloM7xPXUs1M75nfaIWtr/6566092d4d853e43c29d9df2bf791fd1/AdobeStock_540624504__1_.png?w=1280&q=85&fit=scale&fm=avif)
With so many digital analytics tools to choose from, how do you know which one is best for your business?
Because let's face it: it's never about having more data, but having the right data delivered in a way that helps your team make decisions and build products users love.
And the best digital analytics tools don't just track metrics. They go beyond numbers and help you connect the dots and uncover the why behind every data point.
This article breaks down 12 of the top digital analytics tools across product analytics, social media, SEO, and privacy-first categories, so you can confidently recommend the right solution to your stakeholders.
Key takeaways
The best digital analytics tools help you understand not just what users do, but why they do it, combining quantitative metrics with qualitative insights
Choose tools based on your primary use case: product analytics for user behavior on your site or app, social media tracking for customer engagement metrics, and SEO or conversion optimization for search visibility
Look for features like funnel analysis, event tracking, and segmentation to uncover friction points, improve conversion rates, and identify blockers
Digital analytics tools comparison
Here's a side-by-side comparison of the 12 tools covered in this guide:
Tool | Best for | Pricing | Key features |
|---|---|---|---|
Contentsquare | Experience intelligence and behavior analysis | Free plan available; paid plans vary | Session replay, heatmaps, journey analysis, AI insights, frustration scoring |
Google Analytics 4 | Website traffic and conversion tracking | Free | Traffic analysis, conversion events, audience segmentation |
Adobe Analytics | Enterprise cross-channel analytics | Enterprise pricing (custom) | Cross-channel tracking, AI insights, advanced segmentation |
Mixpanel | Product analytics and user flows | Free tier; paid from $20/month | User flows, retention analysis, multi-touch attribution |
Amplitude | Behavioral analytics and experimentation | Free tier; paid plans vary | Behavioral cohorts, experimentation, retention analysis |
FullStory | Session replay and digital experience | Custom pricing | Session replay, frustration signals, product analytics |
Hootsuite | Social media management and analytics | From $99/month | Multi-platform tracking, scheduling, custom reports |
Sprout Social | Social listening and reporting | From $199/month | Social listening, competitive analysis, reporting |
Semrush | SEO and competitive analysis | From $139/month | Keyword research, site audits, competitor tracking |
Ahrefs | Backlink analysis and SEO | From $129/month | Backlink analysis, keyword tracking, content research |
Matomo | Privacy-first, self-hosted analytics | Free (self-hosted); cloud from €19/month | GDPR compliant, full data ownership, no sampling |
Plausible | Lightweight, privacy-focused analytics | From $9/month | No cookies, simple dashboard, GDPR compliant |
How to choose the right digital analytics tool
Before diving into specific tools, it helps to know what you're looking for. When choosing data analysis tools, teams should consider:
Speed: does this tool give you insights fast, or are you waiting for someone to interpret it?
Clarity: can a CEO understand the dashboard without a PhD in data?
Chemistry: will this tool integrate with your existing stack, or is it going to turn your Monday meetings into tech therapy?
You should also consider whether the tool collects data that supports your goals and if it follows data governance, privacy, and compliance best practices.
Key features to look for
A great digital analytics tool should have features that support data collection, analysis, and data visualization, all while being flexible enough to serve different use cases and teams across your organization.
Some notable features you'll likely want to consider include:
Dashboards and reporting that let different teams build dashboards to highlight the data that means the most to them each time they log in
Event tracking to monitor clicks, scrolls, and other actions. Modern tools can auto-capture events without manual tagging, so you can view any event retroactively. Contentsquare's Smart Capture does this automatically.
Conversion analysis to see where users drop off, identify blockers, and see what moves people forward
Alerts that notify you of unusual behavior or performance changes in your primary KPIs
Segmentation to slice and dice data by users by behavior, demographics, or traffic sources to uncover patterns
Integrations to ensure your tools talk so you get the most use out of your tech stack
Qualitative insights that go beyond numbers, typically with session recordings and voice-of-customer (VoC) tools like surveys.
![[Visual] template gallery feedback](http://images.ctfassets.net/gwbpo1m641r7/JhmoXjNgxcg9Z1E8gIHLQ/f77bbd54033babb0a0a52fca48d4b8ad/Screenshot_2024-12-04_at_16.20.43.png?w=1280&q=85&fit=scale&fm=avif)
Contentsquare offers 40+ survey templates, or you can ask the platform's AI to build a custom survey based your goals.
When evaluating return on investment (ROI) of analytics investments, look for tools that can tie user behavior directly to revenue impact, helping you quantify the business value of experience improvements.
Product and experience analytics tools
Product and experience analytics tools help you understand how users interact with your website or app. They track user behavior like clicks, scrolls, and navigation paths, and help you identify where people get stuck or drop off.
1. Contentsquare
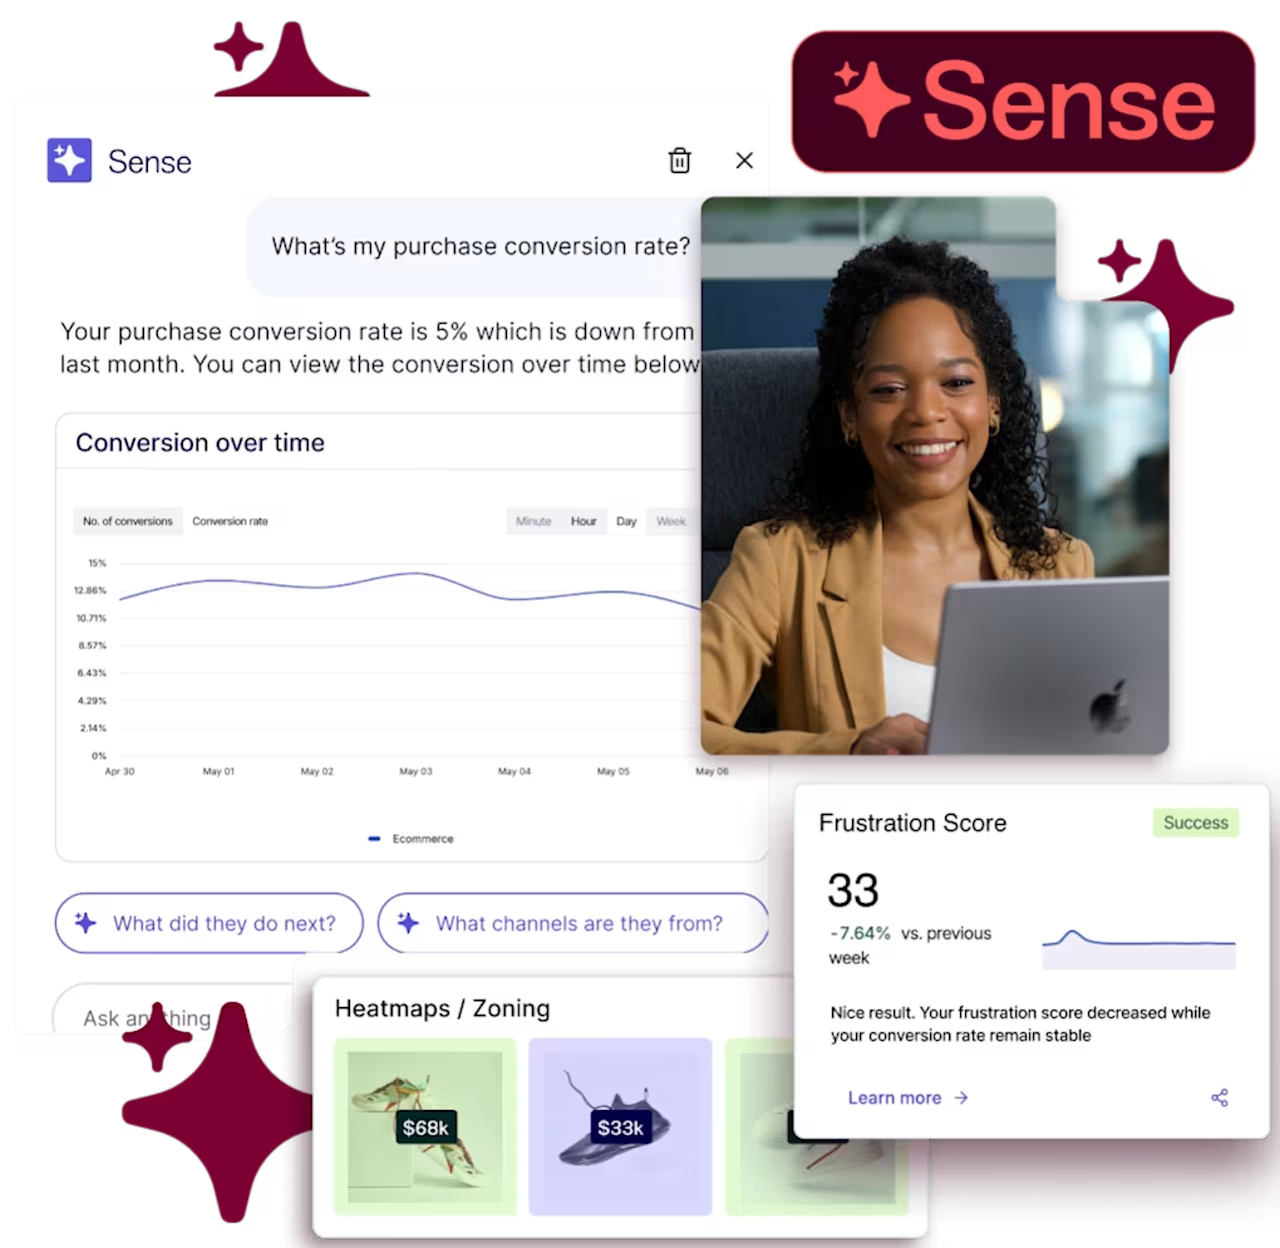
Contentsquare—that's us—is an AI-powered customer experience intelligence that collects qualitative and quantitative digital analytics data so you get the why behind the what.
Key capabilities include:
Surveys to quickly launch surveys and analyze results
Contentsquare's AI, Sense, which analyzes your data and answers any questions you have quickly to help you make confident decisions
Product Analytics to see how people move through your product, including Impact Quantification to tie user actions directly to your revenue
Alerts that automatically notify you when chosen metrics dip below their forecasts
Data Connect to easily pull your data into your data warehouse
Session Replay to watch real recordings of how people use your product
Journey Analysis for a visual of how users move through your product, including major drop-off points
Heatmaps to see where users click, scroll, move, and focus their attention
Error Analysis to help you surface site errors before they become major problems
Frustration score so you can quickly spot areas of your site that give users the biggest headache (and fix them)
Pros:
Combines quantitative metrics with qualitative insights in one platform
AI-powered analysis surfaces insights without manual digging
Auto-captures events without manual tagging
Strong integration ecosystem
Cons:
Full feature set requires paid plans for larger sites
Learning curve for advanced features
Pricing: free plan available with session replays, heatmaps, and AI analysis. Paid plans for additional features and higher traffic volumes.
2. Google Analytics 4
GA4 tracks user behavior across websites and mobile apps and helps teams dig into user journeys.
You can use GA4 to:
Analyze traffic sources to see where visitors come from
See basic metrics for user behavior like session duration and bounce rate
Set up conversion events to monitor goals
Build audience segments and see how different users interact with your site
Pros:
Free and robust for basic analytics needs
Strong integration with Google Ads and other Google products
Event-based model offers flexibility
Cons:
Steep learning curve, especially for users familiar with Universal Analytics
Limited qualitative data (no session replay or heatmaps)
Data sampling on free tier for high-traffic sites
Pricing: free.
Pro tip: already using GA4? You can import your GA4 audiences directly into Contentsquare to dig deeper into how each segment actually behaves on your site. Here's how to set it up.
![[Visual] Add a filter - Identity](http://images.ctfassets.net/gwbpo1m641r7/y91NKGU6TNXFja4nqiUq2/324a881a3427abf0593c79e223ac2636/Identity.svg?w=655&q=85&fit=scale)
Segment users by GA4 audiences in Contentsquare.
3. Adobe Analytics
Adobe Analytics is an advanced digital analytics platform to help you understand customer behavior through data unification across multiple channels, including your website, app, and physical locations.
You can use Adobe Analytics to:
View the full customer journey, including non-digital channels, like your physical store
Surface insights with AI to help with data analysis
Segment audiences to analyze and compare different cohorts of customers
Combine insights from paid media and email to understand engagement beyond your site
Pros:
Enterprise-grade capabilities for complex organizations
Cross-channel tracking including offline touchpoints
Advanced segmentation and attribution modeling
Cons:
Complex implementation and steep learning curve
Expensive, typically requiring enterprise budgets
Requires dedicated resources to manage effectively
Pricing: Enterprise pricing (custom quotes, typically $100,000+ annually).
Pro tip: running Adobe Analytics? Connect it with Contentsquare to bring your analytics data and behavioral insights together in one place. See how the integration works.
4. Mixpanel
Mixpanel is a digital analytics platform that helps you understand how users engage with your site through qualitative and quantitative data.
Use Mixpanel to:
Visualize user flows and see where people drop off
Watch session replays and understand what frustrates users
Zoom in on user segments to find the root cause behind trends
Use multi-touch attribution to see how different channels contribute to your bottom line
Bring in data from your data warehouse to analyze alongside Mixpanel's data
Pros:
Strong product analytics with intuitive user flow visualization
Flexible event tracking and segmentation
Good free tier for smaller teams
Cons:
Can get expensive as data volume grows
Session replay is a newer addition with fewer features than dedicated tools
Learning curve for advanced analysis
Pricing: Free tier available; paid plans from $20/month based on tracked users.
Pro tip: Mixpanel tells you what users do. Pair it with Contentsquare and you'll also see exactly how they do it. Set up the integration here.
5. Amplitude
Amplitude is a product analytics platform focused on helping teams understand user behavior and run experiments to improve retention and conversion.
Use Amplitude to:
Build behavioral cohorts to analyze specific user groups
Run A/B tests and measure their impact on key metrics
Track retention curves to understand long-term engagement
Analyze user paths and identify drop-off points
Connect product usage to business outcomes
Pros:
Strong behavioral analytics and cohort analysis
Built-in experimentation capabilities
Good visualization of retention and engagement trends
Cons:
Can be complex for teams new to product analytics
Pricing scales with tracked users, which can add up
Less focus on qualitative insights like session replay
Pricing: Free tier available; paid plans vary based on usage.
6. FullStory
FullStory is a digital experience analytics platform, similar to Hotjar, that combines session replay with product analytics to help teams understand user frustration and behavior.
Use FullStory to:
Watch session replays to see exactly how users interact with your site
Identify frustration signals like rage clicks and dead clicks
Analyze user journeys and conversion funnels
Search for specific user behaviors across sessions
Quantify the impact of issues on business metrics
Pros:
Strong session replay with searchable interactions
Frustration detection helps prioritize fixes
Good for debugging and UX research
Cons:
Pricing can be high for large traffic volumes
Less robust on traditional web analytics metrics
Requires careful privacy configuration
Pricing: Custom pricing based on session volume.
Social media analytics tools
Social media analytics tools help you track performance, engagement, and audience growth across your social channels. They're essential for understanding which content resonates and where to focus your efforts.
7. Hootsuite
Hootsuite helps social media teams track performance and optimize strategies across their social channels.
You can use Hootsuite to:
Measure engagement metrics (like views and comments) of all social media accounts in one place
Identify your best-performing content and optimal posting times
Create custom reports to share with stakeholders
Compare performance across channels to prioritize resources
Pros:
Manages multiple social accounts from one dashboard
Scheduling and analytics in one tool
Good for teams managing high-volume posting
Cons:
Analytics depth is limited compared to native platform insights
Can get expensive for larger teams
Interface can feel cluttered
Pricing: pricing starts from $99/month for professional plans.
8. Sprout Social
Sprout Social is a social media management platform with strong analytics and social listening capabilities.
Use Sprout Social to:
Track engagement and audience growth across platforms
Monitor brand mentions and industry conversations with social listening
Generate detailed reports for stakeholders
Analyze competitor performance
Manage customer interactions from a unified inbox
Pros:
Excellent reporting and visualization
Strong social listening features
Clean, intuitive interface
Cons:
Higher price point than some competitors
Some features require higher-tier plans
Can be overkill for smaller teams
Pricing: pricing starts from $199/month per seat.
SEO analytics tools
SEO analytics tools help you understand how your site performs in search, identify keyword opportunities, and track your competitive position. They're essential for driving organic traffic.
9. Semrush
Semrush is a comprehensive SEO and competitive analysis platform used by marketers to improve search visibility.
Use Semrush to:
Research keywords and identify ranking opportunities
Run technical site audits to find SEO issues
Track your rankings over time
Analyze competitor strategies and backlink profiles
Monitor brand mentions and online visibility
Pros:
All-in-one SEO toolkit with extensive features
Strong competitive analysis capabilities
Regular database updates for accurate data
Cons:
Can be overwhelming for beginners
Full feature access requires higher-tier plans
Some data limits on lower plans
Pricing: pricing from $139/month.
10. Ahrefs
Ahrefs is an SEO toolset known for its backlink analysis and keyword research capabilities.
Use Ahrefs to:
Analyze your backlink profile and find link-building opportunities
Research keywords and estimate traffic potential
Track ranking changes over time
Audit your site for technical SEO issues
Research competitor content and strategies
Pros:
Industry-leading backlink database
Intuitive interface for keyword research
Strong content research tools
Cons:
No free tier (only limited free tools)
Can be expensive for smaller teams
Some features overlap with Semrush
Pricing: pricing from $129/month.
Privacy-first and open-source analytics tools
As privacy regulations tighten and users become more conscious of data collection, privacy-first analytics tools offer an alternative to traditional platforms. These tools prioritize GDPR compliance and data ownership.
11. Matomo
Matomo is an open-source analytics platform that gives you full control over your data.
Use Matomo to:
Track website analytics with full data ownership
Self-host for complete privacy control, or use Matomo's cloud option
Access detailed reports without data sampling
Stay compliant with GDPR and other privacy regulations
Import historical data from Google Analytics
Pros:
Full data ownership with self-hosting option
No data sampling, even on high-traffic sites
GDPR compliant out of the box
Open-source with active community
Cons:
Self-hosting requires technical resources
Interface less polished than commercial alternatives
Some advanced features require plugins
Pricing: free (self-hosted); cloud plans from €19/month.
12. Plausible
Plausible is a lightweight, privacy-focused analytics tool designed as a simple alternative to Google Analytics.
Use Plausible to:
Track essential metrics without cookies
Stay compliant with GDPR, CCPA, and other privacy laws
View a simple, clean dashboard without complexity
Reduce page load impact with a tiny script
Share public dashboards with stakeholders
Pros:
No cookies required, simplifying compliance
Extremely lightweight (under 1KB script)
Simple, focused dashboard
Transparent, open-source
Cons:
Limited features compared to full analytics platforms
No session replay or heatmaps
Less suitable for complex analysis needs
Pricing: pricing from $9/month based on pageviews.
How to get started with digital analytics tools
You can get started with digital analytics tools by:
Defining your goals
Defining the data you need to reach your goals
Finding a tool that collects the data you need
Setting up a demo with the tool to ensure it fits your needs
Integrating the tool into your tech stack through APIs and plug-and-play integrations
Implementation timeline and challenges
Getting the basics up usually takes one to two days. But building something that gives you reliable insights takes a bit more.
If you want to migrate your current analytics solution to a new one, you should keep an eye on:
Potential loss of historical data
Complex implementation
Team retraining
Downtime in tracking apps during transition
If you want to ensure your team uses your digital analytics tool effectively from day 1, Noelle London, CEO and founder of Illoominus, recommends 'starting with clear use cases and ensuring everyone understands what questions the tool should answer'.
Integrations and data management
Digital analytics tools typically use plug-and-play integrations and APIs to help teams integrate with their existing CRM and tech stack for maximum results.
For example, Contentsquare has a variety of out-of-the-box integrations you can use to connect to tools like Adobe and Amazon Web Services.
Or you can use the platform's API to build custom integrations if you need an integration it don't have.
Many digital analytics tools let you define custom events and goals to track behavior specific to your needs, so you always collect relevant data.
Leading digital analytics tools are built with privacy in mind and offer features like cookie consent management, identity resolution controls, data deletion, and anonymization to remain compliant with GDPR, CCPA, and other privacy laws.
Contentsquare is committed to building a product that meets global privacy standards, so you can trust that your data (and your user's data) is safe. Read more about Contentsquare's privacy commitment.
For teams that need to centralize their data, many tools offer APIs or data integrations so you can push your digital analytics data into your data warehouse or BI tools like Looker. Contentsquare's Data Connect sends your behavioral data straight into your warehouse without requiring APIs or engineering work.

Contentsquare's Data Connect capability can connect with multiple warehouses.
Data retention periods vary by platform and plan. For example, GA4 stores user data for up to 14 months, and Contentsquare stores personal data—like IP addresses or unique IDs—for up to 13 months.
Get a digital analytics tool that shows you more than numbers
The best digital analytics tools don't just tell you how many people clicked or commented, they help you understand why people behaved the way they did and what you can do to improve those results next time.
Whether you're optimizing a landing page, figuring out which traffic sources lead to loyal customers, or identifying what's stopping users from converting, Contentsquare gives you the insights to take action with confidence.
FAQs
A digital analytics tool is software that collects, measures, and analyzes user behavior data across digital touchpoints like websites, apps, social media, and email. This data helps you understand how real people move through your product, what they like and dislike, and how your campaigns are performing.
![[Headshot] Amy Mitchell-Whittington](http://images.ctfassets.net/gwbpo1m641r7/3M13wpbaQxP5xFsDyJtNM4/3d4f9ea1c77e9fb72e11dd3ed6c1506e/amy_headshot.jpg?w=1280&q=85&fit=scale&fm=avif)
![[visual] laptop on table with glass of water and books](http://images.ctfassets.net/gwbpo1m641r7/4kNCDkZuHxWka96yJb0Jmp/e20ae24e493e7473cdda1fc5c92a069b/BLOG-website-feedback-tools-3987020.jpeg?w=624&q=85&fit=scale&fm=avif)
![[Guide] [Behavior analytics] Tools > cover image](http://images.ctfassets.net/gwbpo1m641r7/4qSFHdTBRIg5QpJYMRC1Ls/fe5620b050f9b75c1e15fd3b98d6a5f8/3467644.jpg?w=624&q=85&fit=scale&fm=avif)