
Speech analytics is powerful—it reveals which issues frustrate your customers and how often they experience them.
But when used alone, speech analytics has its limitations. It can tell you that customers are frustrated—but not what they saw on the screen before they gave up, the JavaScript error that broke the form, or the dead clicks that went nowhere.
When you connect speech analytics with digital experience data, everything changes. A contact driver now points you not just to a specific page, but to a root cause.
In this article, you’ll learn how to:
Watch what the customer experienced before they reached out
Find every customer who encountered the same issue and never said a word
Quantify the true cost of a friction point—in support volume, conversions, and churn
Confirm whether your fix worked
Key insights
Call volume only tells part of the story: for every customer who reached out, many more hit the same friction and left without a word—and that’s where the real cost is hiding
When you can put a number on a friction point—say, contacts per month or users affected—you give product and digital teams the business case they need to prioritize fast
Connecting conversation data to digital behavior shows you not just that something is broken, but why—whether that’s a user experience (UX) issue or a backend error
What happens when you combine speech analytics and digital experience data?
Together, speech analytics and digital experience data give you a complete view of where an experience is failing, how many customers it’s affecting, and exactly what to fix.
On its own, each data source only tells half the story:
Speech analytics captures the outcome of a broken experience—why customers reached out, how they felt, and how agents handled the interaction
Digital experience analytics captures the experience itself—where users clicked, hesitated, dropped off, or hit errors on your site or app
The problem is that these two data sets almost always live in separate tools, owned by separate teams. So even when both tell you that something is wrong, nobody has the full picture.
Once you connect your call center analytics, chatbot data, and digital experience insights, that changes. A contact driver will point you not just to a complaint category, but to a specific page—and to the root cause behind it, such as an API error or a content gap. A drop-off stops being just an abstract metric and becomes a group of real customers—most of whom you’d never have known were struggling.
Contentsquare (CSQ) Conversation Intelligence is where this connection happens, bringing together call center analytics, 360 experience intelligence data, and sentiment analysis (how customers feel about their experience) in one place.
5 ways to put speech analytics and digital experience insights to work
So, what does this look like in practice? Here’s how to combine speech analytics and digital experience data in a 5-step workflow that takes you from first signal to confirmed fix.
1. Trace contact drivers back to the exact moment the experience broke down
Say the number of contacts about ‘account access’ suddenly spikes. You know customers are struggling—but not where or why.
Here’s exactly what to do:
Identify which contact drivers (or reasons for reaching out) are most common and track how those numbers shift over time. Contentsquare’s Conversation Intelligence does this automatically across every call, chat, and email—without manual tagging.
Trace those contact drivers back to the specific pages and paths users took before (and after) calling or messaging you. Our Journey Analysis tool connects each conversation topic to a precise moment in the customer’s digital journey.
Together, these tools connect the conversation topic (‘can’t reset my password’) to a specific journey step (the password reset page, right after the email confirmation step).
The result: your product, marketing, and digital customer experience (CX) teams don’t have to wait for a complaint to trickle through from support—they can see exactly where in the journey customers struggle and act on it directly.
💡Pro tip: instead of manually cross-referencing contact driver data with journey data, ask Contentsquare’s AI assistant Sense Chat to help. By typing ‘Show me where users go right before contacting us about password assistance,’ you get an answer in seconds—no manual digging required.
![[Visual] Journey-analysis-sense](http://images.ctfassets.net/gwbpo1m641r7/3YF1vgtNFaqqWjjaxSZbgl/b37170520a1dc52508425883c909ace1/Journey-analysis-sense.png?w=1280&q=85&fit=scale&fm=avif)
Use Contentsquare’s Sense Chat to ask natural language questions about customer journeys
2. Watch what the customer experienced before they contacted you
When a specific issue keeps popping up in your conversation data—like ‘I couldn’t complete checkout’ or ‘The form wouldn’t load’—you know something in the digital experience has been broken.
Conversational intelligence tells you how often the problem occurs and how customers feel about it—but to actually fix it, you need to dig deeper into what’s happening. Otherwise, your team is stuck guessing—or worse, asking the customer to recreate a frustrating experience all over again.
Here’s how to go from conversation signal to visual evidence in Contentsquare:
Start by pulling up sessions from users who hit the problematic flow—filtering by the specific contact driver or journey segment you’ve identified. Tools like Contentsquare’s Session Replay let you do this instantly.
Get an overview of those sessions before diving in. Use CSQ’s AI-powered Session Replay Summaries to surface key behavioral patterns and flag potential issues across up to 100 sessions at once.
Dig into individual sessions to see exactly what the customer saw, clicked, and ran into—before they ever contacted you
This is how you turn a customer complaint into real evidence your team can act on.
![[Visual] Session-replay-summaries-button](http://images.ctfassets.net/gwbpo1m641r7/41x44SkeFGsj0DFp2SAraw/bdc1efbc803976fb3598b186008ade9f/Session-replay-summaries-button.png?w=1280&q=85&fit=scale&fm=avif)
Use Session Replay Summaries to summarize up to 100 sessions with the click of a button
The result: faster triage and quicker fixes—and a whole lot less back-and-forth between support and engineering.
Analyzing screen recordings used to take an enormous amount of time. Now, with Contentsquare, we can summarize 10 recordings at a time, or more, and get to bugs, friction points, and user frustration much faster.
3. Find out how many customers the problem is affecting (and how much it’s costing you)
You’ve spotted an issue that’s generating calls, emails, and messages—but those contacts are only part of the story. For every customer who called, others likely hit the same problem and just silently ghosted you. If you’re only counting the contacts, you’re underestimating the scope of the issue.
Here’s how to see the full picture in Contentsquare:
Start by identifying the digital behavior pattern that frustrated customers share—the pages they visited, the actions they took, and the moments where sentiment dropped. Sentiment analysis within the Conversation Intelligence tool allows you to identify these patterns across every conversation
Then, find other users who matched that pattern but never contacted support. Journey Analysis lets you filter based on behavior so you can see the whole segment of affected users.
Visualize how widespread the friction is across all users. Heatmaps show you exactly which elements people ignore, miss, or rage-click at scale.
Finally, put a number on it! Use Impact Quantification to calculate the revenue or conversion impact tied to the friction point.
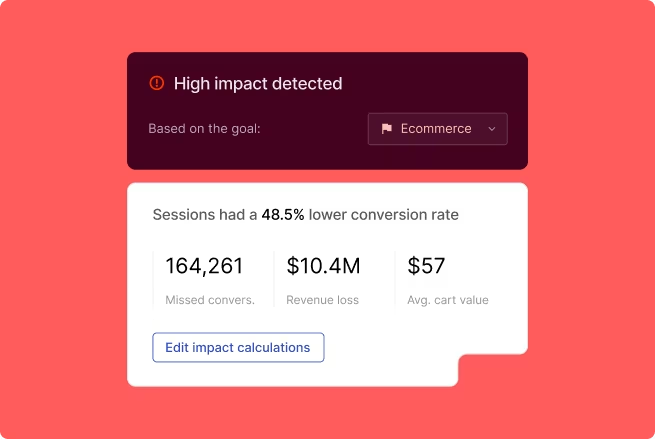
Translate friction points into financial terms with Contentsquare’s Impact Quantification
The bottom line: if you have 800 contacts a month at a $12 cost per contact, you have a $9,600-per-month problem—yikes! Add the silent drop-offs and churn risk, and the real number is likely even bigger (and now you know exactly how much).
🔥 Calendly put this into practice—and cut cost per case by 23%
By connecting conversation data to their support workflow, appointment scheduling platform Calendly used Contentsquare to cut their average handle time by 3 minutes, bringing their cost per case down by 23%. They also moved their voice-of-customer reporting entirely to Conversation Intelligence, saving countless hours of manual analysis.
4. Find the root cause—and what it’ll take to fix it
You’ve found the page where your product or web experience breaks down. But ‘The checkout page is broken’ isn’t something your product or engineering team can act on. Is it a confusing layout? A backend error? Unless you know why your checkout page is causing problems, you risk fixing the wrong thing.
Here’s how to get a diagnosis in Contentsquare:
Using our Root Cause feature in Conversation Intelligence, figure out what’s behind the contact driver, such as a product bug or a content issue
Click Error Analysis to check whether a technical error, like a JavaScript error or failed API call, is contributing to the problem
By using these tools together, you get a clear answer to whether this is a fix for your design, content, or engineering team.
For example, a spike in contacts about not being able to find an order status might seem like a content problem at first. But Root Cause reveals that customers can find the page, but can’t find the tracking link itself. That’s a UX fix, not a content issue, and now your design team knows exactly what to prioritize.
The result: your team knows what’s broken—and who needs to fix it!
![[Visual] Root-cause-CI](http://images.ctfassets.net/gwbpo1m641r7/1F2WPXjXyGOPJ2S1OsKMU5/5dc4bdf34af46dcd36901e5bbcce3344/Root-cause-CI.png?w=1280&q=85&fit=scale&fm=avif)
Use Root Cause to quickly get to the bottom of an issue within a customer conversation
5. Measure whether a fix actually works
A digital fix goes live. But did it reduce contacts? Most teams can’t answer that question confidently because the siloed data means they don’t have access to everything they need.
Here’s how to close the loop in Contentsquare;
Use Conversation Intelligence to track the trend in a specific contact driver after you’ve fixed the problem. Are those contacts going down?
Turn to Contentsquare’s 360 experience intelligence tools to confirm that the on-page behavior has changed. For example, Funnel Analysis shows you if users are completing a specific journey and dropping off less after the fix. Our Heatmaps tool confirms that users are now clicking on the right element—and you can even compare the before and after side by side.
The result: contact center and digital teams share a single view of an improvement’s impact—and a proof point either team can take to leadership.
![[Visual] Contact-drivers](http://images.ctfassets.net/gwbpo1m641r7/7yCyITN2sRbMeULnQt2cSB/327efe0345a737cea68b6adb4ba77745/Contact-drivers.png?w=1280&q=85&fit=scale&fm=avif)
View trends in contact drivers with Conversation Intelligence
🤖 Is your AI agent deflecting contacts—or driving revenue?
AI agents handle more customer conversations than ever before—but teams still measure them in isolation. If your containment rate (the number of contacts resolved in automated channels) looks good, the agent must be working, right?
Not necessarily. That number alone doesn’t give you essential context, like what the customer did on the page before the AI agent stepped in, or what they did afterward.
Here’s how to get the full picture in Contentsquare:
Use AI Agent Analytics to track containment, abandonment (the percentage of calls where the customer hangs up before speaking to an agent), and sentiment by intent—then, cross-reference those intents with conversion outcomes to see which ones are working
Use Impact Quantification to compare conversion rate and revenue between users who triggered the AI agent and those who didn’t—this is where you find out whether the agent is helping or hurting your numbers
Finally, click over to Journey Analysis to see what users who interacted with bots did next—did they move forward toward conversion or exit?
That middle point is the one most teams miss. The real question isn’t just whether the agent deflects contacts—resolves them without human intervention—it’s whether deflection is where the actual value is. An agent that deflects a lot of contacts but quietly suppresses conversions might save you money on support costs while costing you more in revenue. Comparing conversion with and without the agent lets you optimize for overall impact, not just cost.
The result: teams stop treating AI agent performance as a mysterious black box, and start understanding whether their agents drive savings, revenue, or both.
![[Visual] AI-deflection](http://images.ctfassets.net/gwbpo1m641r7/5Vt0yDb4vlDd6y3rJARyIo/947ac6085c3c45cefe602af0403a390c/AI-deflection.png?w=1280&q=85&fit=scale&fm=avif)
Improve AI deflection rates with Contentsquare’s Conversation Intelligence
Close the loop between your contact center and digital team
By using speech analytics and digital experience together, you turn a vague customer complaint into a concrete improvement to your site or product. The teams that see the most success aren’t the ones with the most data—they’re the ones who’ve connected it, so support, product, and digital teams work from the same information.
The signals were always there. Now you have everything you need to act on them.
FAQs about speech analytics
Speech analytics is the automated analysis of customer conversations to surface insights like
Contact drivers: why customers reach out
Sentiment: how they feel during the interaction
Agent performance: how well the conversation was handled
