
Great digital experiences feel effortless, but there’s a huge amount of customer insight needed to really get it right. And with so many potential data points and sources, it can be hard to know where to start or how to set your team up for success.
Enter digital analytics: the most powerful way to understand your users, make data-driven decisions, and prioritize your resources to have maximum business impact.
In this guide, we cover everything you need to know about digital analytics: what it is, why it matters to your business, and actionable ways to start using it today to drive engagement, conversions, and revenue.
Key insights
Digital analytics is no longer just for specialists—it’s a necessity for every team. Democratizing your data with a centralized, easy-to-use platform puts the power of customer insights in everyone’s hands, enabling teams to work quickly to improve the user experience.
AI-powered data analysis capabilities are a game-changer for experts and data newbies alike, removing hours of admin, reducing time to insight, and relieving strain on your engineering teams
A successful digital analytics strategy needs to combine quantitative and qualitative data, incorporating inputs from a range of sources to help you truly empathize with customer needs and preferences
What is digital analytics?
Digital analytics is the process of collecting and analyzing data from your website, app, product, and other digital touchpoints (like social media, email, and marketing campaigns) to understand user behavior and optimize performance.
This data comes from a range of sources and tools, including
Behavior analytics tools like session replays, heatmaps, and journey analysis that reveal how users act on your site or product
Customer interactions with your social media platforms or support channels
Website traffic data like page views, bounce rates, time spent on page, and drop-offs
Digital experience monitoring like error analysis and speed monitoring
Product data like usage and engagement metrics
Voice-of-customer (VoC) feedback from online surveys and interviews
Mobile analytics data from your app
Digital analytics is used by product, marketing, user experience (UX), design, and ecommerce teams to turn customer behavior into insights that fuel informed decision-making and improve the customer experience (CX).
Digital analytics vs. data analytics vs. web analytics: what’s the difference?
Digital analytics, data analytics, and web analytics share some similarities, but there are key differences in terms of scope:
Data analytics is the overall discipline of collecting, analyzing, and interpreting data from any source—digital or otherwise
Digital analytics is a subset of data analytics that explores data from a range of digital sources and experiences, such as customer behavior within your product, app, website, or social media
Web analytics is a subset of digital analytics that focuses specifically on data from your website or web-based application
Data analytics vs. digital analytics vs. web analytics | What it is | What it’s used for | Data sources |
|---|---|---|---|
Data analytics | The process of collecting, analyzing, and interpreting data from any source | Understanding business performance, identifying risks and opportunities, and making informed decisions about organizational initiatives | All business data (Ex: financial, operational, CRM data) |
Digital analytics | Draws on data from a range of digital tools and sources | Improving digital experiences across all touchpoints to drive better CX, increase conversions, and promote long-term retention | Digital data (Ex: website, product, digital marketing campaigns, mobile app data) |
Web analytics | Focuses specifically on data from your website | Optimizing website performance by increasing traffic, conversion rates, and engagement metrics | Website data (Ex: performance, traffic, user behavior) |
10 ways digital analytics helps teams achieve key business goals
Digital analytics powers everything from your marketing efforts to product improvements. Here are 10 ways teams use digital analytics to enhance CX and drive real business results.
Increase user engagement
Use digital experience analytics to understand how users really engage with your site or product and make data-driven improvements that increase engagement, conversions, and retention.
For example:
1. Learn what users are looking for
Collect data from heatmaps to discover which elements of your site or product capture attention and resonate with your target audience—and which parts get missed or overlooked. Use your learnings to redesign and refine key pages to boost engagement and conversion rates.
2. Uncover high-impact user journeys
Analyze user journeys to understand which paths result in conversions and which ones lead to dead ends. Remove blockers, address drop-offs, and work backward from your most successful journeys to encourage more users to take these paths.
3. Watch user behavior to personalize experiences
Watch session replays to compare how different user segments behave, then create personalized experiences based on their needs. For example, if users from a certain segment show high engagement with sections about your product’s AI functionality, you could create dedicated landing pages or content marketing material to highlight these capabilities further.
💡 Pro tip: use AI-powered Session Replay Summaries in Contentsquare to get in-depth insights from one or multiple session replays without spending hours watching each one. Contentsquare’s AI, Sense, takes the heavy lifting out of data analysis, delivering key insights, potential issues, and behavioral trends in a few clicks, all with time-stamped links to the most critical moments.
![[Visual] AI session replay summaries](http://images.ctfassets.net/gwbpo1m641r7/3xrdkhayKftcgj7tXavwVS/bd8b2ea0930743b584316093cd8aab4d/AI_session_replay_summaries.png?w=3840&q=100&fit=fill&fm=avif)
Identify friction points
Digital analytics tools like Contentsquare’s Experience Monitoring reveal friction and user pain points that negatively impact your users and cause high bounce rates—or even churn. With the right tools, you can quickly find and fix errors and prioritize them based on business impact, helping you maximize your return on investment (ROI).
For example:
4. Monitor trends in CX and user behavior
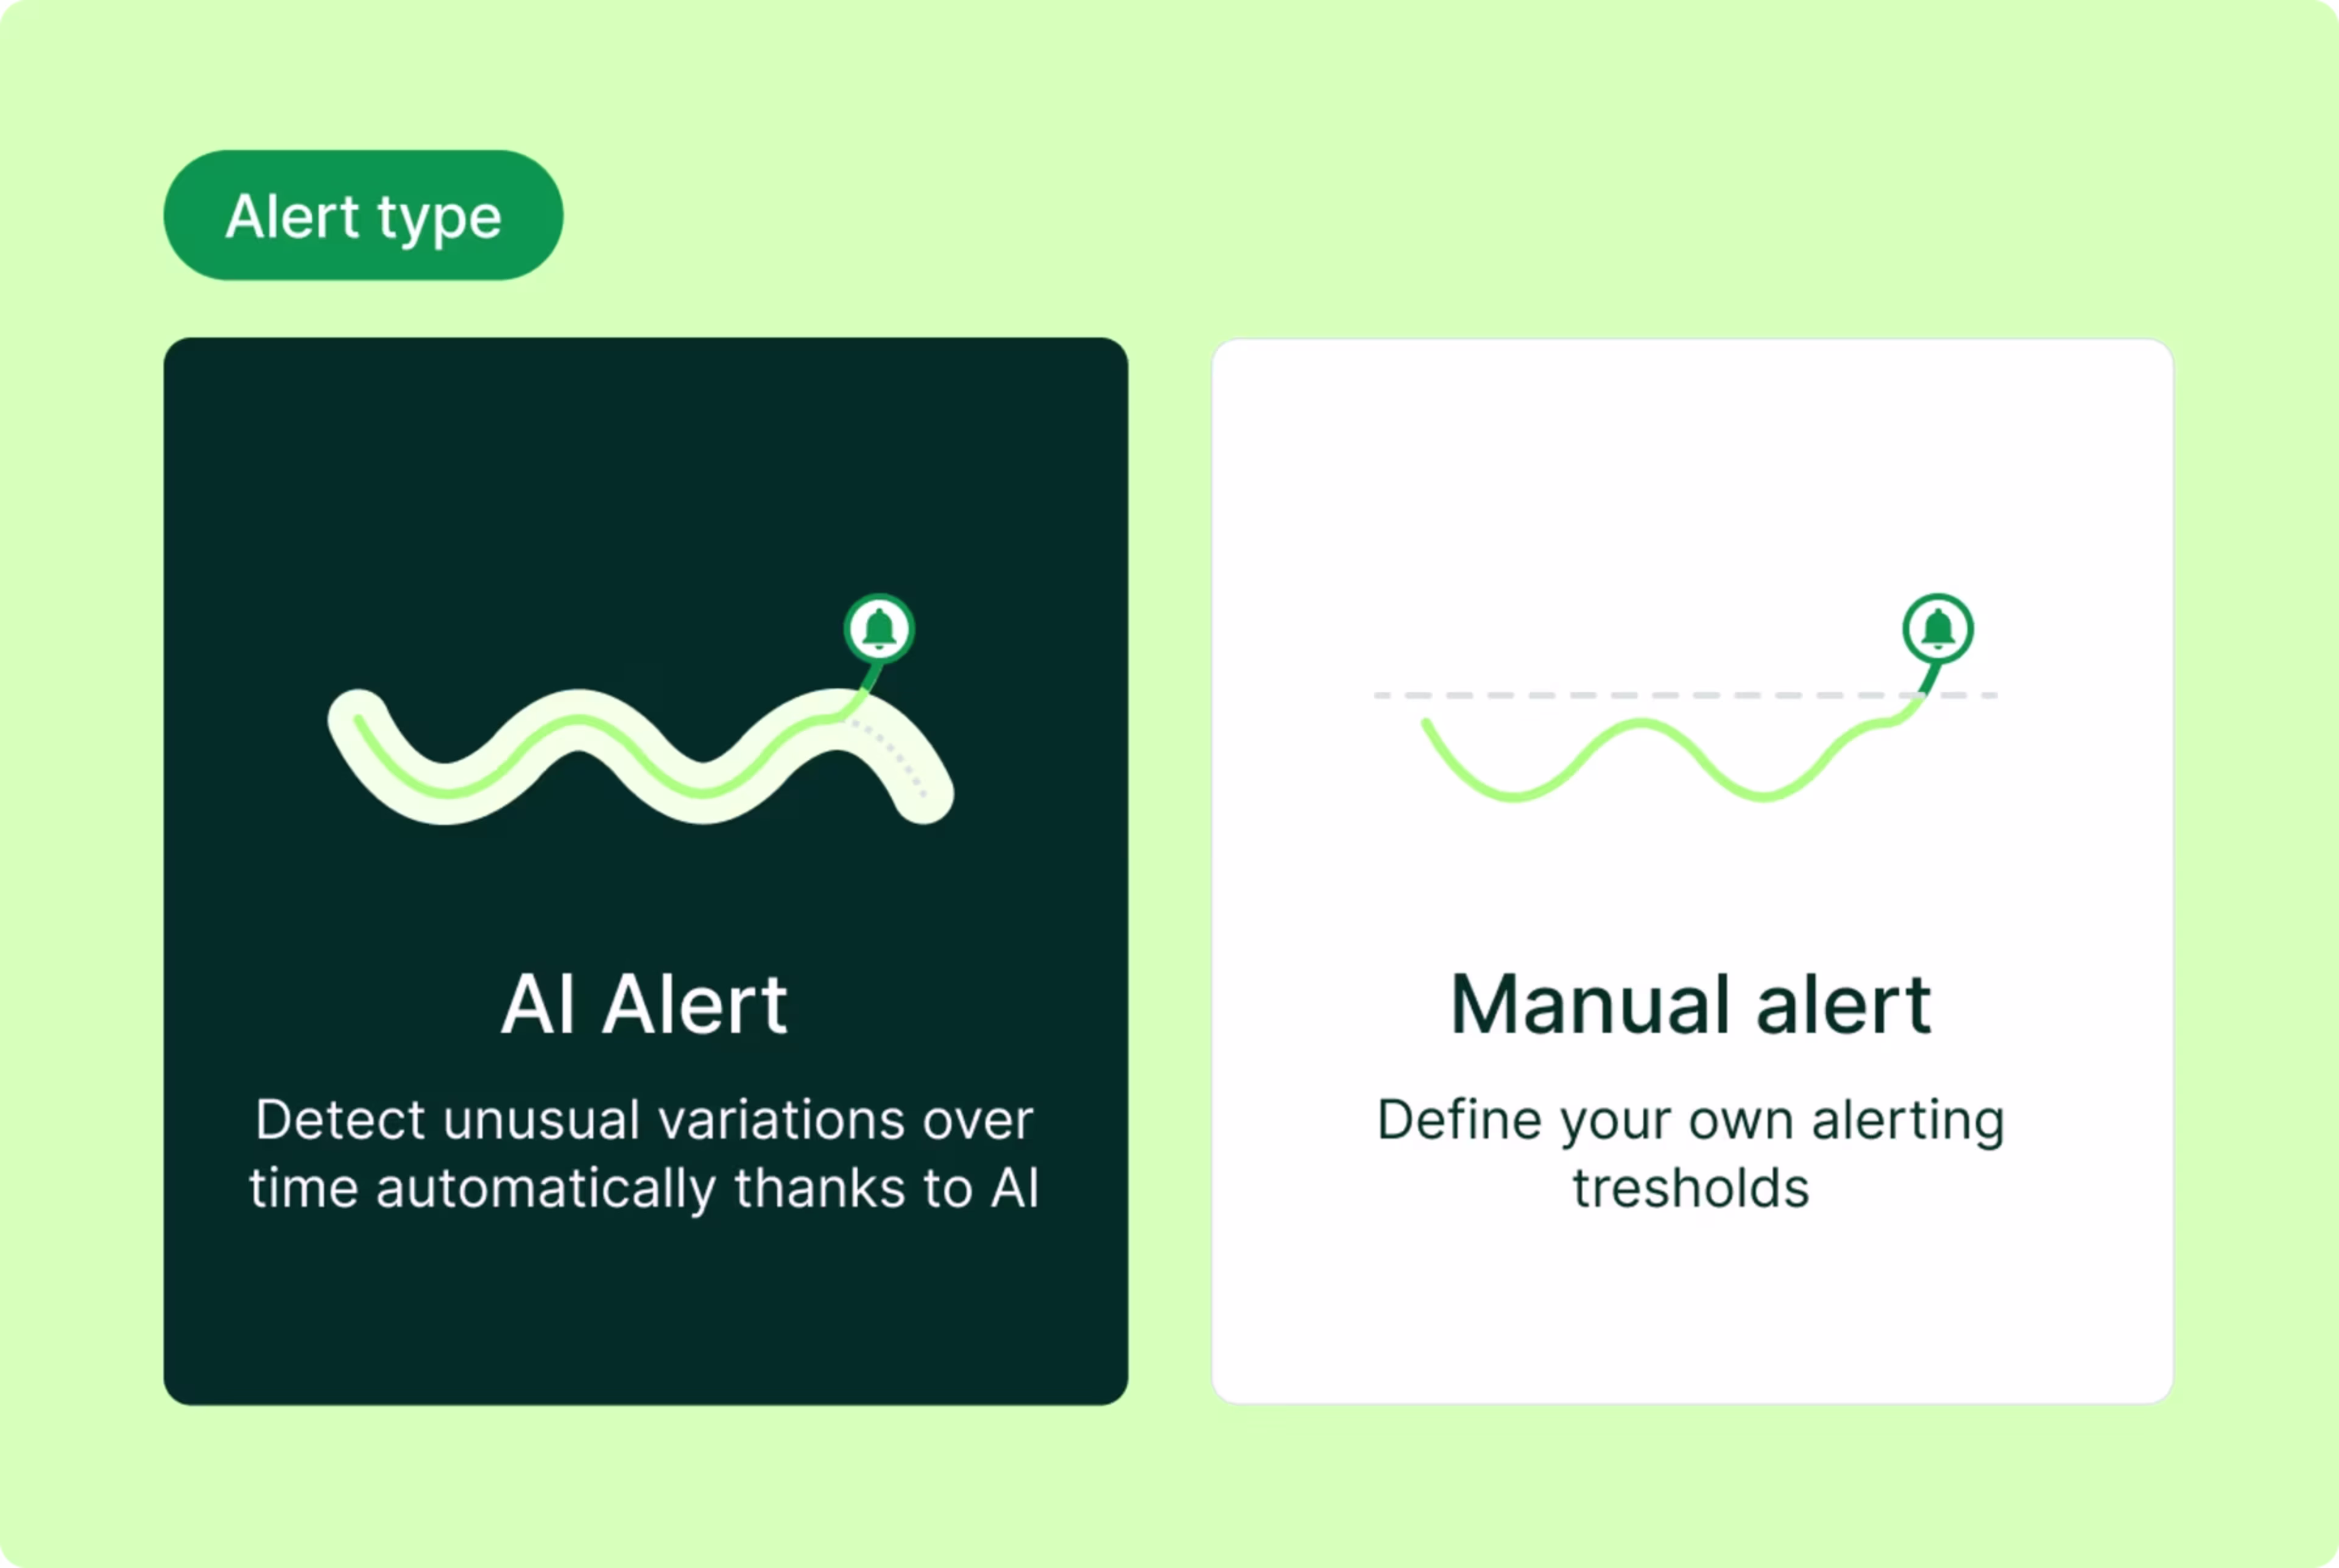
Use AI alerts to quickly and effortlessly stay on top of key performance indicators (KPIs). Set alerts to get informed about deviations or anomalies in important digital analytics metrics like
Conversion rate
The number of users who experienced errors
Bounce rates
Page views
Device- or segment-specific behaviors
Then, get notifications directly via email or in your Slack workspace so you can immediately respond to issues before they become problems.
Use Contentsquare’s AI alerts to track the KPIs that matter most to your business
5. Quantify and prioritize frustration factors
Use an AI-based frustration score to find moments of friction on your site and take action accordingly.
Contentsquare’s frustration score feature considers a range of factors—such as rage clicks, multiple field submissions, JavaScript and API errors, and performance issues—then assigns each page, page set, or session a score from 0–100. This feature uses AI to objectively rank how frustrating these pages or sessions are for users, so you can easily prioritize the most impactful fixes.
Want to drill in a little deeper? Filter session replays by frustration score and use Session Replay Summaries to quickly contextualize how frustration impacts the digital experience. Watch and share the most relevant moments for valuable insights on how to improve the customer journey.
💡Pro tip: add a frustration score widget to your Contentsquare digital analytics dashboard to monitor frustration at a glance and track how it changes over time. |
Build products people love
Use product analytics—another subset of digital analytics that focuses on how users interact with your product from beginning to end—to understand engagement, including which features they use (or don’t), barriers to adoption, and what keeps them coming back.
For example:
6. Improve feature adoption
Track the adoption of your newly released feature across different plan types, user segments, or devices to understand how it’s performing—and what you can do to increase usage. Make data-driven optimizations, like finding and fixing UX errors that cause users to drop off, or launch re-engagement campaigns to specific user segments to help them realize value.
7. Tailor onboarding by audience
Track onboarding by user segment and monitor long-term usage data to understand which flows lead to long-term success—for customers and your business. Identify where different user types need help, and zoom in with session replays to see exactly how you can support them. Then, create additional content to proactively address blockers, or use A/B testing to trial new onboarding flows based on specific use cases to help more users realize value, faster.
💡Pro tip: use Contentsquare’s AI copilot, Chat with Sense, to get in-depth analyses instantly. Ask questions and let Sense analyze all digital data across key Contentsquare capabilities to provide clear, comprehensive answers illustrated with relevant data visualizations. Enhance your analysis with Sense’s suggested follow-up questions or click ‘Explain my approach’ to get a detailed breakdown of how it reached its conclusions.
Deeply understand your audience
Qualitative data analytics uses VoC tools to get rich user feedback and connects these insights with your other data points to provide a fuller picture of the overall customer experience.
For example:
8. Capture user feedback with surveys
Launch surveys to hear directly from your customers. Choose from Contentsquare’s pre-made template library or let Sense quickly generate one for you based on your research goal (like ‘Why are users abandoning the checkout?’). Remove hours of manual research by using AI to analyze the results and produce summary reports that give you main focus areas, relevant quotes, and a suggested action plan for next steps.
9. Test prototypes before launch
Run user tests to see how people intuitively navigate your prototype or website and get their candid feedback. Use Contentsquare to launch user tests at scale and across time zones: set a task or goal, record participants completing it in their own time, and get their valuable insights about the process, all without a researcher.
10. Get deeper insights with interviews
Conduct user interviews with existing customers or members of your ideal customer profile (ICP) to get detailed feedback about their experiences, needs, and pain points. You can also follow up on specific survey responses by inviting that user to an interview to learn more. Contentsquare’s Interviews capability streamlines scheduling and recruitment from a diverse pool of over 200,000 participants, and automatically gives you AI-generated transcripts post-interview to make analysis a breeze.
How to choose the right digital analytics tool
When choosing a digital analytics tool, look for one that ticks these boxes:
✅ Connected and all-in-one
An all-in-one platform like Contentsquare connects the dots between key data points, giving you a comprehensive overview of the user experience, enabling more accurate, detailed analysis across the entire customer journey.
✅ AI-powered
Cutting-edge AI capabilities empower every team to get more from digital analytics data, massively reducing labor-intensive admin and time to insight. This helps you make decisions faster, work quickly to make optimizations, and prioritize enhancements that boost your business.
✅ Automatic data capture
Remove tedious tagging and manual setup with automatic data capture from day one. Get complete, retroactive data so you always have the information you need—even if your goals or events change.
FAQs about digital analytics
Digital analytics is the practice of collecting, analyzing, and acting on data about how people experience your digital properties—websites, mobile apps, and other digital journeys. It helps you understand what users are trying to do, where they struggle, and what drives outcomes like purchases, sign-ups, renewals, or support deflection. Modern digital analytics goes beyond “what happened” and also clarifies “why it happened” by tying behavior patterns to experience quality and business impact.

![[Visual] Contentsquare's Content Team](http://images.ctfassets.net/gwbpo1m641r7/3IVEUbRzFIoC9mf5EJ2qHY/f25ccd2131dfd63f5c63b5b92cc4ba20/Copy_of_Copy_of_BLOG-icp-8117438.jpeg?w=1920&q=100&fit=fill&fm=avif)
![[Visual] AI analytics home - stock](http://images.ctfassets.net/gwbpo1m641r7/64i3HakmQ9aHWYWEEqpFUM/f1d5d2a41b5c7d7a523a34b58bd50ece/AdobeStock_634961399.png?w=1920&q=100&fit=fill&fm=avif)