![[Guide] [Behavior analytics] Strategy - Cover image](http://images.ctfassets.net/gwbpo1m641r7/2mYjwn6o7Ifwx2h19dmA9V/fcb2b0375023eb3072e886ce0605d7fb/5744496.jpg?w=1280&q=85&fit=scale&fm=avif)
The moment has arrived: after carefully researching your product or service, a lead has decided your company is the best fit for their needs and filled out your inquiry form. They hit 'Submit,' the page starts to load—and then freezes.
Problems like these—slow page load speeds and form failures—interrupt the user experience, frustrate customers, and result in lost revenue. That's why you need digital experience monitoring (DEM) platforms. These tools let you proactively identify, track, and fix issues to improve customer satisfaction and conversion rates.
In this guide, you'll learn about 12 DEM platforms so you can pick the one that best suits your needs, ensuring a seamless experience and keeping users returning to your product or site.
Key takeaways
Digital experience monitoring tools track performance, errors, and user interactions, giving you the visibility to catch and fix issues before they hit your bottom line
The best DEM platforms cover three monitoring approaches: real user monitoring (RUM), synthetic monitoring, and application performance monitoring (APM), often combining them for complete coverage
Proactive monitoring is where the real value lies. By analyzing user interactions continuously, you can identify problems before they frustrate customers or cause a dip in revenue.
Monitoring works best when paired with analytics and feedback, giving you a full picture of both technical performance and actual user behavior in one place.
DEM tools comparison table
Tool | Best for | Key strength | DEM type | Pricing |
|---|---|---|---|---|
Contentsquare | All teams | Business impact quantification + behavioral insights | All-in-one | Custom |
Dynatrace | Enterprise tech teams | AI-powered root cause analysis | All-in-one | Custom |
New Relic | Technical teams | 775+ integrations | All-in-one | Free tier available |
Datadog | DevOps/IT teams | Security + monitoring combined | All-in-one | Usage-based |
ThousandEyes | Network-focused teams | Third-party service visibility | Synthetic + Network | Custom |
Splunk Observability | Splunk users | Real-time streaming analytics | All-in-one | Usage-based |
AppDynamics | Enterprise business teams | Business transaction correlation | APM + RUM | Custom |
Site24x7 | SMBs | Cost-effective full-stack | All-in-one | Tiered plans |
Catchpoint | Global performance teams | Synthetic testing from 2,500+ locations | Synthetic | Custom |
Noibu | Ecommerce teams | Checkout error detection | RUM + Error | Custom |
Raygun | Small dev teams | Code-level crash reporting | APM + Error | Tiered plans |
ManageEngine | On-prem IT teams | 150+ technology integrations | APM | Tiered plans |
12 digital experience monitoring tools to improve the user experience
Your company's invested a lot of time and resources into creating a website or product your customers love. But even the best digital experiences can slow down, break, or confuse users.
That's why you need digital experience monitoring (DEM) tools. They track important aspects of the user experience to give you a complete picture of how your site is performing and how you can improve it.
Before diving into specific tools, it helps to understand the three main approaches to DEM:
real user monitoring (RUM) captures data from actual user sessions, showing you real-world performance and behavior as it happens
synthetic monitoring uses automated scripts to simulate user journeys and proactively detect issues before users encounter them
application performance monitoring (APM) monitors backend infrastructure, servers, and application code to identify technical root causes
Many platforms combine multiple approaches. Here are 12 digital experience monitoring tools to help you find the right fit.
1. Contentsquare
Contentsquare's monitoring tools let you track and optimize user interactions across your digital touchpoints. It combines real-time digital experience monitoring metrics with behavioral insights, showing you exactly how users engage with your website or product.
With its intuitive interface, Contentsquare makes it easy to diagnose performance issues, identify friction in the customer journey, and understand why users behave the way they do.
Contentsquare's experience monitoring solution has two stand-out capabilities:
Web Performance: track page load times, first input delay, Largest Contentful Paint (LCP), and other key performance metrics that have a major impact on your website's results. Monitor these proactively to see how they affect conversions, bounce rates, and retention. And when performance issues do pop up, you can figure out the root cause and begin remediation fast.
Error Analysis: find the technical errors (like JavaScript and API issues) and non-technical errors (like a coupon code that doesn't work) that have the biggest impact on your business outcomes. Then, open up a Jira ticket with a click of a button so your tech team can start finding solutions. Bonus: real-time alerts in Slack or Teams ensure you never miss an error spike.
![[Visual] Error analysis](http://images.ctfassets.net/gwbpo1m641r7/6ELBPV051gA5ePLDZOiFEG/8352c504a71e140b84d4b0587b2c446c/eyJwYXRoIjoiY29udGVudHNxdWFyZVwvZmlsZVwvZHVGZlF4bWVzMjU0WGhkNXExOXcucG5nIn0_contentsquare_-5dJe5Xqp6vEwH1Gl8wqmZQXmHHT4auNG_.png?w=1280&q=85&fit=scale&fm=avif)
Contentsquare's Error Analysis capability lets you view error trends and jump right into relevant session replays—or quantify their business impact—with one click.
While these features are incredibly useful, what sets Contentsquare apart from the rest is how seamlessly it works with its experience analytics and other platform-wide capabilities.
Here are a few tools you can use in combination with Contentsquare's Web Performance and Error Analysis:
Frustration Score: get a list of your most common errors—from slow load times to rage clicks—to see what's causing the most frustration for users
Session Replay: jump directly to session replays to see exactly what your users saw on their screen and find resolutions for them
Impact Quantification: discover how much an issue affects your conversion rate and bottom line
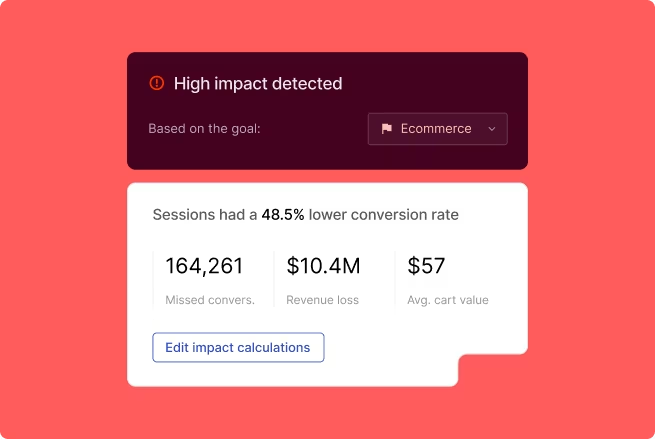
Contentsquare’'s Impact Quantification capability makes it easy to see how issues affect your conversion rates and revenue so you can prioritize fixes.
Contentsquare is ideal for organizations that want an easy-to-use platform to turn the user experience into a competitive advantage.
2. Dynatrace
Dynatrace offers end-to-end digital experience monitoring that helps you better understand your website's performance and user interactions. It allows your tech teams to quickly pinpoint issues and optimize performance to improve customer satisfaction.
Dynatrace's DEM solution offers features like:
Real-time monitoring: tracks user interactions, downtime, outages, and app performance in real time to immediately reveal any disruptions
Troubleshooting: uses AI-driven root-cause analysis to surface hard-to-find errors and analyze them in depth
AI-powered analytics: detect anomalies, highlight critical issues, and understand product performance with analytical dashboards
Dynatrace is ideal for enterprise-level technical teams looking for an AI-assisted front-to-back-end solution to improve digital experiences.
💡Did you know? Many companies combine Dynatrace's and Contentsquare's capabilities as complementary tools in their tech stacks.
Dynatrace, which is geared toward a more technical audience, takes an 'inside out' approach. It emphasizes what the server is doing and how that affects users.
Contentsquare, on the other hand, takes an 'outside in' perspective. It tells you, ‘The user is frustrated,’ and points you to the cause. Plus, its intuitive interface makes it approachable for all kinds of business users, from marketing to product teams.
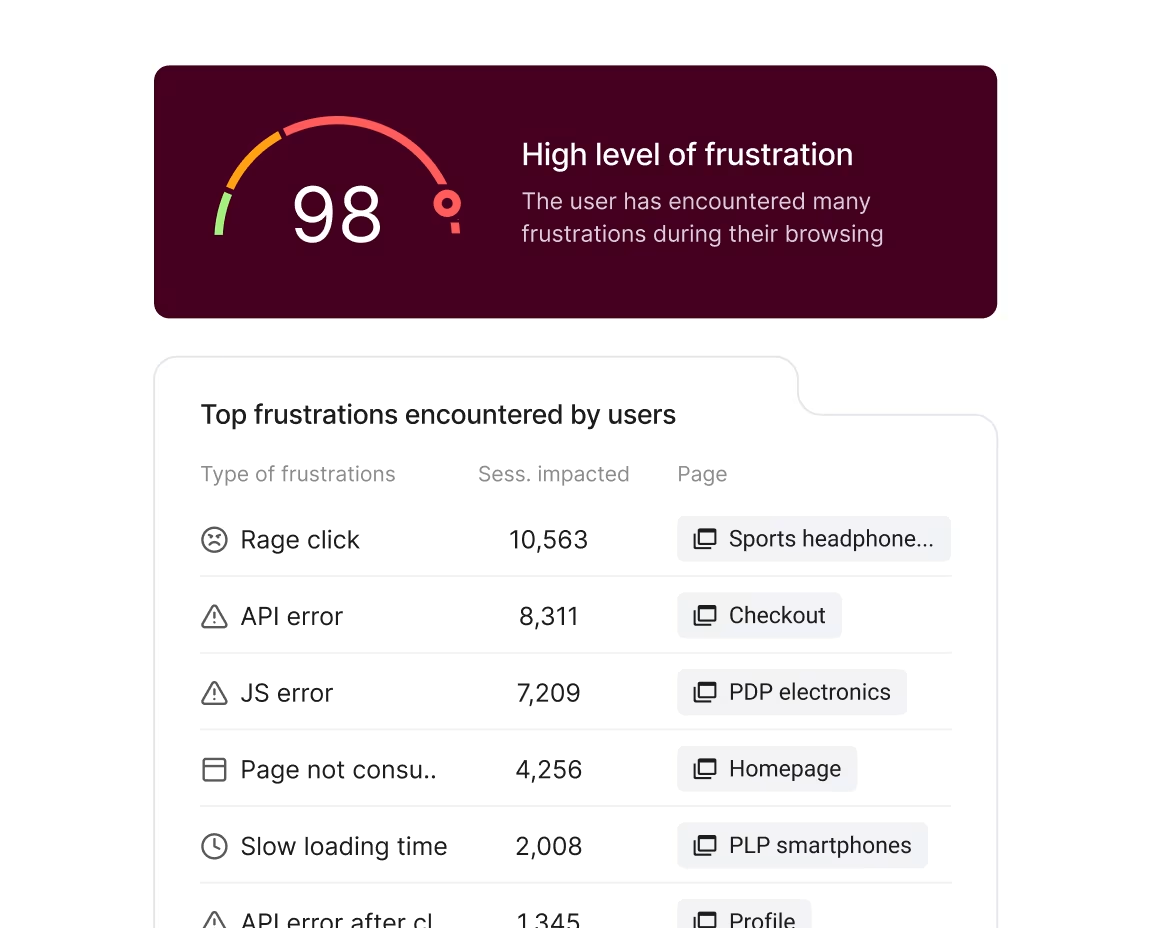
Contentsquare's Frustration Score puts the user's perspective first, showing you what irritated them the most.
3. New Relic
New Relic is a digital experience monitoring software that helps you monitor, debug, and improve your entire stack. It provides a clear picture of how users experience your digital projects and where performance bottlenecks may decrease user satisfaction.
Here are a few of New Relic's helpful capabilities and features:
End-to-end monitoring: get visibility into your network, infrastructure, apps, and end-user experience
Cross-platform observability: lets you manage errors across platforms from a central inbox and see dynamic visuals on a single dashboard
Integrations: offers over 775 integrations to ensure it works smoothly with the rest of your tech stack
New Relic is ideal for technical teams looking for front- and back-end monitoring.
4. Datadog
Datadog is a comprehensive monitoring and security platform that helps you optimize your website, mobile, and app performance. It gives you a unified view of your servers, databases, cloud-based tools, and applications, so you can find and fix issues that affect the user experience (UX).
Some useful Datadog features include:
API tests: monitor endpoints on different network layers and then use these insights to validate workflows
Real user monitoring (RUM): track real user data to improve your front-end performance
Synthetic monitoring tests: use bots to simulate customer journeys across browsers and devices
Datadog is ideal for enterprise DevOps and IT teams looking for a combined DEM and security solution that allows for cloud and infrastructure security management.
💡Pro tip: integrate Datadog with Contentsquare to ensure all of your business users have access to essential DEM data.
With the integration, you can easily jump from a session replay in Contentsquare to investigate backend issues within Datadog—or vice versa.
As an AI-powered customer experience intelligence, Contentsquare also fills the gaps in Datadog's platform, allowing you to:
Quantify the impact of technical issues on your bottom line
Get user feedback through VoC tools to help with website tracking and learn how to create happier customers
Perform retroactive text searches to look for hidden error messages like ‘"Oops, something went wrong’" and surface other non-technical issues
Increase your product analytics capabilities to track key performance indicators (KPIs), identify journey blockers, and boost revenue
Get AI-powered recommendations that pinpoint what causes slowdowns and how to fix them, saving your team valuable time
![[visual] Trackr errors, performance, and experience in one platform](http://images.ctfassets.net/gwbpo1m641r7/5kij4TrV5pm5szmdUXmsFV/aa2461e9d49a006265c63e335acd8e15/Contentsquare-speed-analysis.jpeg?w=1280&q=85&fit=scale&fm=avif)
Get automated tips on how to make your site faster with Contentsquare’'s Speed Analysis.
5. ThousandEyes
ThousandEyes, now part of Cisco, specializes in network path visibility and internet monitoring. It helps you understand how third-party services and network conditions affect your users' digital experiences.
Key ThousandEyes features include:
Network path visualization: see exactly how traffic flows between users and your applications, identifying where latency and slowdowns occur
Internet outage detection: get alerts when ISP or cloud provider issues affect your users, even when the problem is outside your infrastructure
Cloud and SaaS monitoring: track the performance of third-party services your business depends on
ThousandEyes is ideal for enterprises needing visibility into third-party services and network performance beyond their own infrastructure.
6. Splunk Observability Cloud
Splunk Observability Cloud offers full-stack observability with strong roots in log analytics. It helps teams correlate infrastructure, application, and user experience data in one platform.
Splunk Observability Cloud features include:
Real-time streaming analytics: process and analyze telemetry and performance data as it arrives for immediate insights
AI-assisted troubleshooting: use machine learning to surface anomalies and reduce mean time to resolution
Infrastructure monitoring: track servers, containers, and cloud services alongside application performance
Splunk Observability Cloud is ideal for organizations already using the Splunk ecosystem or needing unified observability across complex environments.
7. AppDynamics
AppDynamics, also owned by Cisco, focuses on application performance monitoring with a strong emphasis on business transaction visibility. It connects technical performance to business outcomes.
AppDynamics features include:
Business transaction monitoring: track how application performance affects specific business processes and revenue
Code-level diagnostics: drill down to the exact line of code causing performance issues
Customer journey analytics: understand how performance problems affect users at each step of their journey
AppDynamics is ideal for enterprises wanting to correlate application performance directly with business outcomes and revenue impact.
8. Site24x7
Site24x7, part of the ManageEngine family, offers comprehensive monitoring at competitive pricing. It provides a broad range of monitoring capabilities suitable for growing teams.
Site24x7 features include:
Website monitoring: track uptime, response times, page speed, and transaction flows across your web properties
Server monitoring: monitor on-premises and cloud server health and performance
Real user monitoring: capture actual user session data to understand real-world performance
Site24x7 is ideal for small to mid-sized businesses seeking cost-effective full-stack monitoring without enterprise complexity.
9. Catchpoint
Catchpoint specializes in synthetic monitoring and internet performance, helping teams proactively test user experiences before problems affect real users.
Catchpoint features include:
Synthetic monitoring from global locations: test customer journeys from hundreds of locations worldwide to catch regional issues
Network insights: understand how DNS, CDN, and network conditions affect performance
API monitoring: validate that your APIs perform correctly and quickly
Catchpoint is ideal for organizations prioritizing proactive monitoring and global performance visibility.
10. Noibu
Noibu is a DEM tool that helps ecommerce teams identify and resolve potential issues that impact the user experience. By providing real-time visibility into performance problems such as broken links and checkout errors, Noibu helps you prevent revenue loss and enhance customer satisfaction.
Some of Noibu's helpful features include:
Bug detection: find problems in code deployments to prevent friction in the user experience
Customizable alerts: set up notifications based on your current goals and needs so your team can respond quickly
Watch session replays: search for and watch user sessions to see how performance issues play out on your online store
Noibu is ideal for ecommerce professionals looking to improve site reliability and user experience to increase conversions.
💡Pro tip: if your ecommerce team uses Contentsquare, combine website monitoring with Surveys for next-level insights.
Contentsquare lets you survey your customers or put a feedback button on any page of your website so they can point out bugs or UX issues. Spot a problem on your site? Uncover the underlying cause by jumping straight into experience monitoring tools.
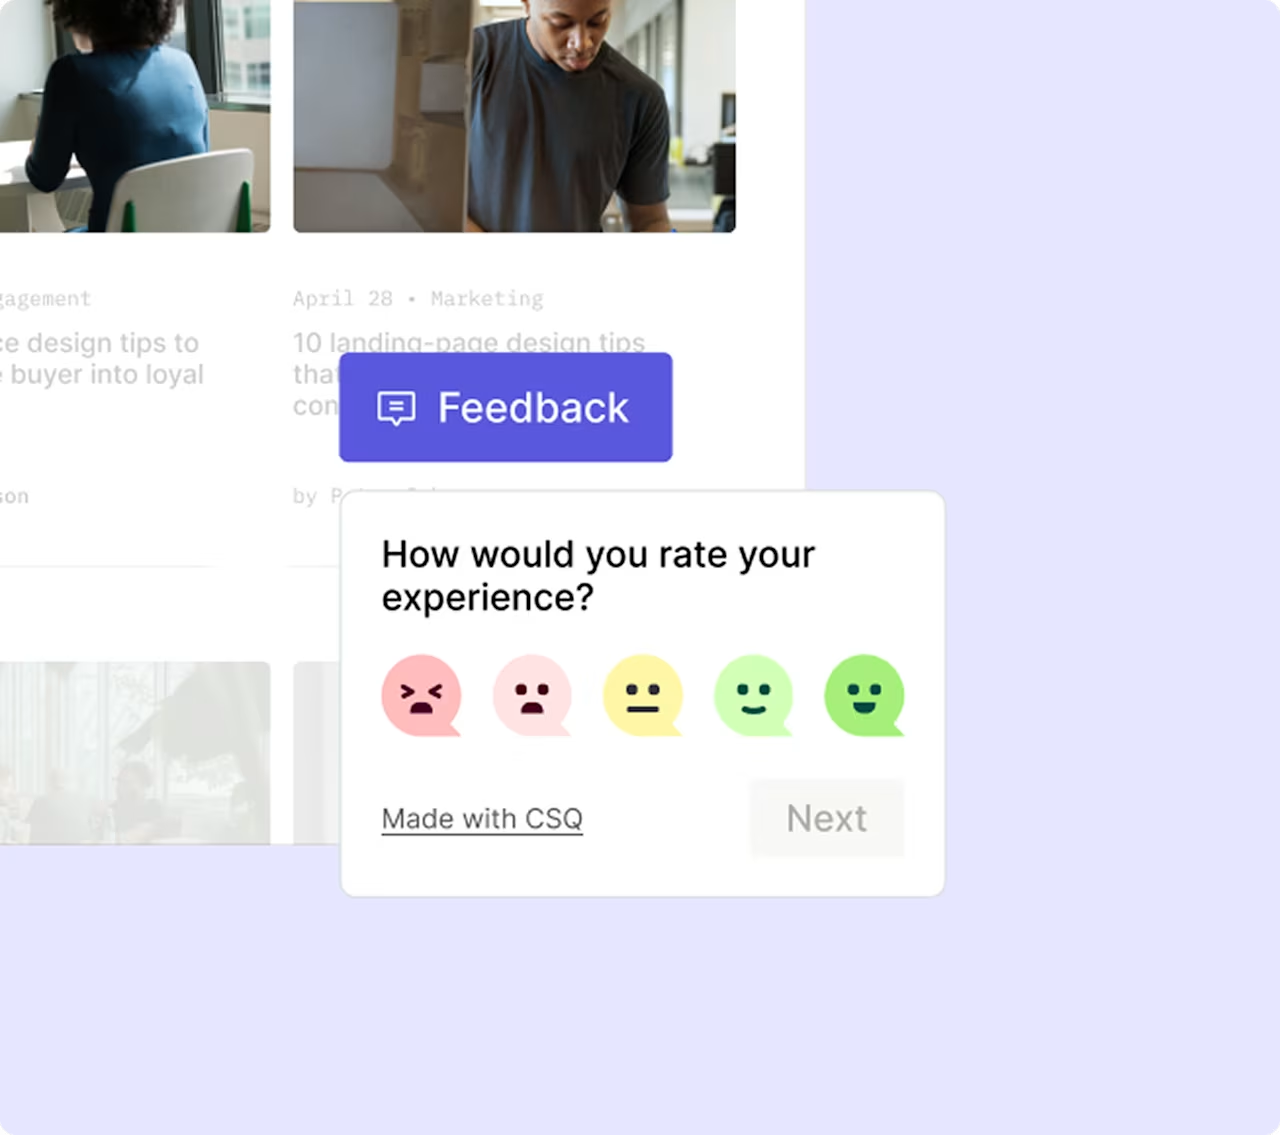
Let your customers report errors and bugs by putting a feedback button on your site.
11. Raygun
Raygun is a DEM tool that focuses on application performance and error monitoring, giving developers and product teams insights into how users interact with apps and where things go off course.
Here are some of Raygun's main features:
Crash reporting: provides detailed code-level error reports, letting you sort problems by priority level
AI error resolution: analyzes and diagnoses errors with one click by sending contextual information to AI agents or your preferred large language model (LLM), giving you improved visibility
Performance monitoring: offers real-user monitoring and application performance monitoring (APM) to help engineers identify and fix bottlenecks and bugs
Raygun is ideal for engineers at small-to-medium businesses wanting to troubleshoot errors, bugs, and crashes.
12. ManageEngine Applications Manager
ManageEngine Applications Manager offers both on-premises and cloud deployment options with broad technology coverage. It's designed for IT teams that need flexibility in how they deploy monitoring.
ManageEngine Applications Manager features include:
150+ technology integrations: monitor a wide range of applications, databases, and infrastructure components out of the box
Automated root cause analysis: quickly identify the source of performance issues across your stack
Customizable dashboards: build views tailored to different teams and use cases
ManageEngine Applications Manager is ideal for IT operations teams needing on-premises deployment options or broad technology coverage across diverse environments.
How to choose a digital experience monitoring tool
With so many options available, selecting the right DEM tool comes down to understanding your team's specific needs. Here are the key factors to consider:
Your team and use case
Technical teams may need deeper APM capabilities with code-level diagnostics, while business users benefit from intuitive interfaces and session replay that don't require engineering expertise. Think about who will use the tool day-to-day.
If you're monitoring customer-facing applications, you'll want strong RUM and customer journey capabilities. For internal employee tools, you might prioritize infrastructure monitoring and uptime tracking.
Evaluate integration capabilities
DEM tools should connect with your existing tech stack—ticketing systems like Jira, collaboration tools like Slack, and analytics platforms you already use. The easier it is to share insights across teams, the faster you can resolve issues.
Prioritize business impact visibility
The best tools don't just show you that something broke—they help you understand what it cost you. Look for capabilities that quantify how issues affect conversion rates and revenue, not just technical metrics. This helps you prioritize fixes and justify investments to stakeholders.
When you can see that a specific error affected 2,000 sessions and cost an estimated $15,000 in lost conversions, prioritization becomes much clearer.
Get proactive about problem-solving for a smooth customer experience
Digital experience monitoring tools give you essential insights into how your website and products work for your customers. They ensure you get the best return on your digital transformation investments and give you peace of mind that everything is running as it should—without bugs, bottlenecks, or speedbumps.
When everyone has access to your DEM data, meeting your digital experience needs becomes easier than ever. And when you can supplement that DEM data with experience analytics data—which captures the entire user experience over a single session across devices—you ensure you have the most comprehensive data to make decisions that keep your customers happy and your revenue growing.
A solid DEM strategy combines proactive monitoring with the behavioral context to understand not just what went wrong, but why it matters to your users.
FAQs about digital experience monitoring tools
Digital experience monitoring ( DEM ) is the practice of tracking and analyzing how users interact with websites, applications, and digital services to identify performance issues and improve user satisfaction . It combines multiple monitoring approaches to give you visibility into both technical performance and user behavior .
![[Headshot] Amy Mitchell-Whittington](http://images.ctfassets.net/gwbpo1m641r7/3M13wpbaQxP5xFsDyJtNM4/3d4f9ea1c77e9fb72e11dd3ed6c1506e/amy_headshot.jpg?w=1280&q=85&fit=scale&fm=avif)
![[visual] laptop on table with glass of water and books](http://images.ctfassets.net/gwbpo1m641r7/4kNCDkZuHxWka96yJb0Jmp/e20ae24e493e7473cdda1fc5c92a069b/BLOG-website-feedback-tools-3987020.jpeg?w=624&q=85&fit=scale&fm=avif)
![[visual] man and a woman in front of the laptop](http://images.ctfassets.net/gwbpo1m641r7/4MGw9yViQS4fJSNlpsrUFB/b3cc18c9886ebfad5f35ef56c0b9ef64/Magic_Stick_-_Photo_4.jpeg?w=624&q=85&fit=scale&fm=avif)