The company
Forge Holiday Group brings together market-leading holiday brands Sykes Holiday Cottages, Forest Holidays, UKCaravans4Hire and Bachcare, representing more than 23,000 cottages across the UK, Ireland and New Zealand. Founded at a kitchen table in 1991, the company now employs 1,000+ people across more than 20 regional brands.
As it has grown, Forge has committed to making a positive environmental impact as a Certified B-Corp and to using technology to foster an outstanding customer experience (CX).
Forge Holiday Group website
Jon Parsons, Customer Tribe Lead at Sykes Holiday Cottages, develops and delivers the brand’s CX strategy. To do that, he turns to Contentsquare for digital experience insights and analysis.
Key metrics
Reduced payment page exit rate by -6.5%
Increased call-to-action interactions by +7.5%
Boosted funnel completion by +5.3%
The challenge
Sykes Holiday Cottages experienced excellent results with their conversion rate optimization (CRO) program and wanted to help Forest Holidays—one of their partner brands—see improvements, too.
Forest Holidays, which offers eco-friendly cabins in 30 forest locations across the UK, didn’t yet have a CRO program and had noticed some issues with their website. Jon and his team approached the problem the same way they do at Sykes—by starting with insights from Contentsquare's Experience Analytics.
The key problem they identified was Forest’s checkout journey—particularly on the last step of the payment page.
“We'd got people all the way through the journey. They've sat there with their card details, having filled up four forms, and half of them were leaving at that point,” says Jon. “That indicates a whole load of problems to us, as we shouldn't be losing people at that point in the journey.”
The solution
Thinking about what had worked for Sykes in the past, the Forest Holidays project team decided to run 3 A/B tests.
1. Removing unnecessary content to avoid confusion
The team hypothesized that a large ‘Pay balance in full’ checkbox was causing friction on the payment page. The checkbox was unnecessary because it was the only option for customers and sat directly above the essential credit card info form fields.
The team ran an A/B test with the original page as the control and the page without the checkbox feature as the experimental version.
Using Journey Analysis, they analyzed the results. Not only had the payment page exit rate fallen, but they uncovered additional insights about their customers.
![[Visual] Customer story - Forge Holiday Group- Pay-balance-element](http://images.ctfassets.net/gwbpo1m641r7/dE7U6JvVCIHouGLnQQezI/b5571cc43e8852b5822661f70b92dee9/Pay-balance-element.png?w=3840&q=100&fit=fill&fm=avif)
Sykes Holiday Cottages payment page
“It gave us that learning that unnecessary content was getting in the way for our customers,” Jon says. “By removing those elements, we could start to see tangible improvements in the metrics that we’re trying to go after.”
Then, they used Zone-Based Heatmaps to see how removing the ‘Pay balance in full’ section changed customers’ attention to other page elements.
![[Visual] Customer story - Forge Holiday Group- attractiveness-heatmap](http://images.ctfassets.net/gwbpo1m641r7/7dvCPJDZy0FIrlitZVzzjs/30b2b94c79763a9c8cad1fd0983f5957/attractiveness-heatmap.png?w=3840&q=100&fit=fill&fm=avif)
Heatmap analysis on Sykes Holiday Cottages payment page showing attractiveness rate of control (left) and experiment (right)
2. Reordering page elements to get clear on pricing
The team decided to try another modification: moving the total price closer to the main call to action.
On the original page, 2 lines stood between the total price and the orange ‘Continue to extras’ button. The team hypothesized that a simple swap would make the overall price clearer to customers, encouraging them to hit the button to continue on their journey.
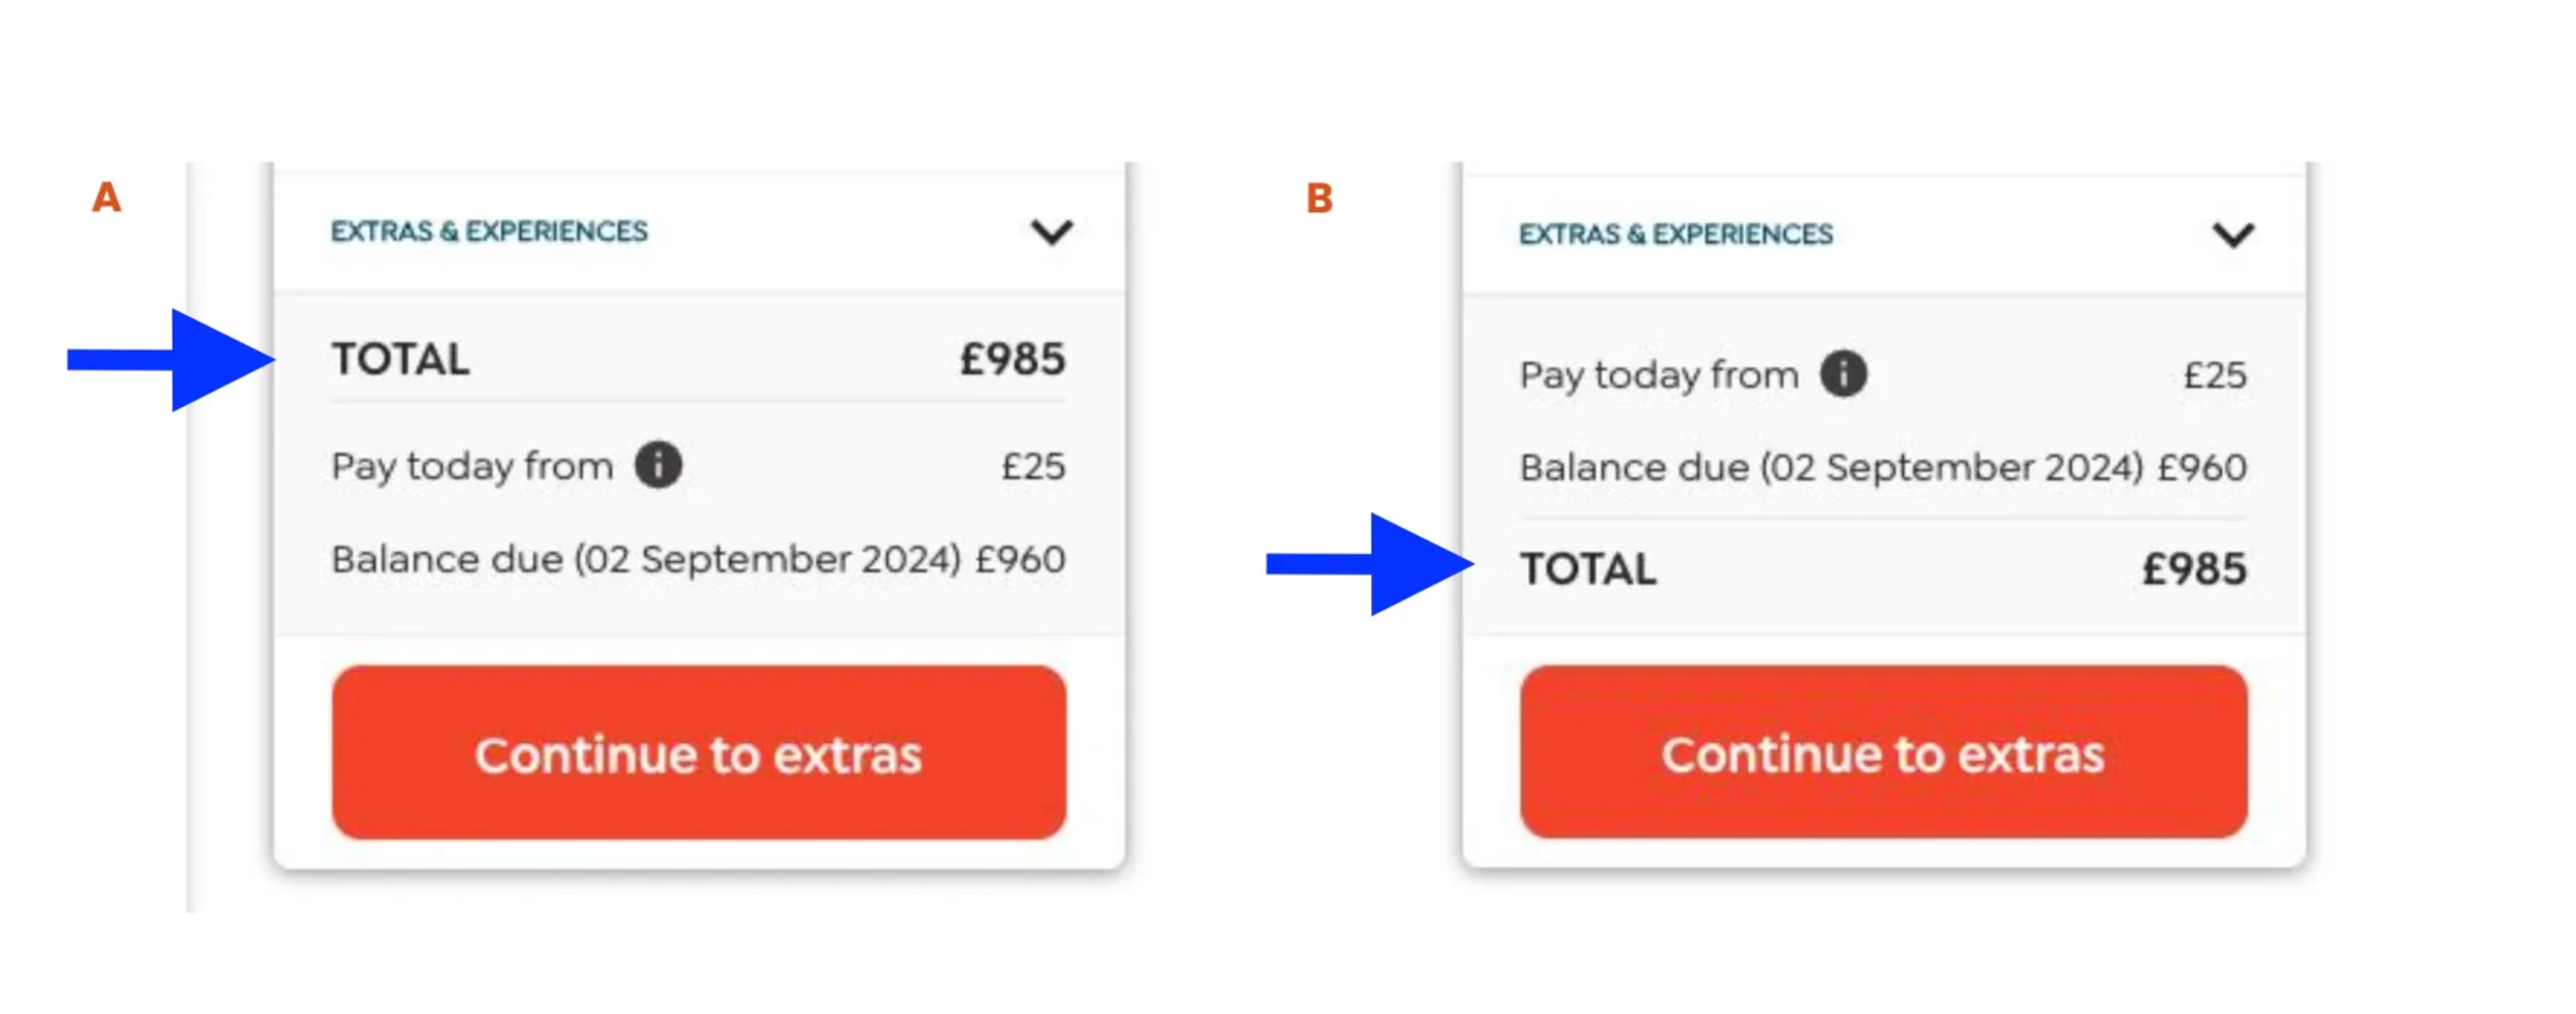
Sykes Holiday Cottages pricing page showing total price control (left) and experiment (right)
Jon and his team ran another A/B test and analyzed the results using Contentsquare.
“We saw changes all the way through the checkout, but we saw a lot of impact on that final page,” says Jon. “That made sense because at that point customers wanted to confirm their price and be clear on what they’re paying.”
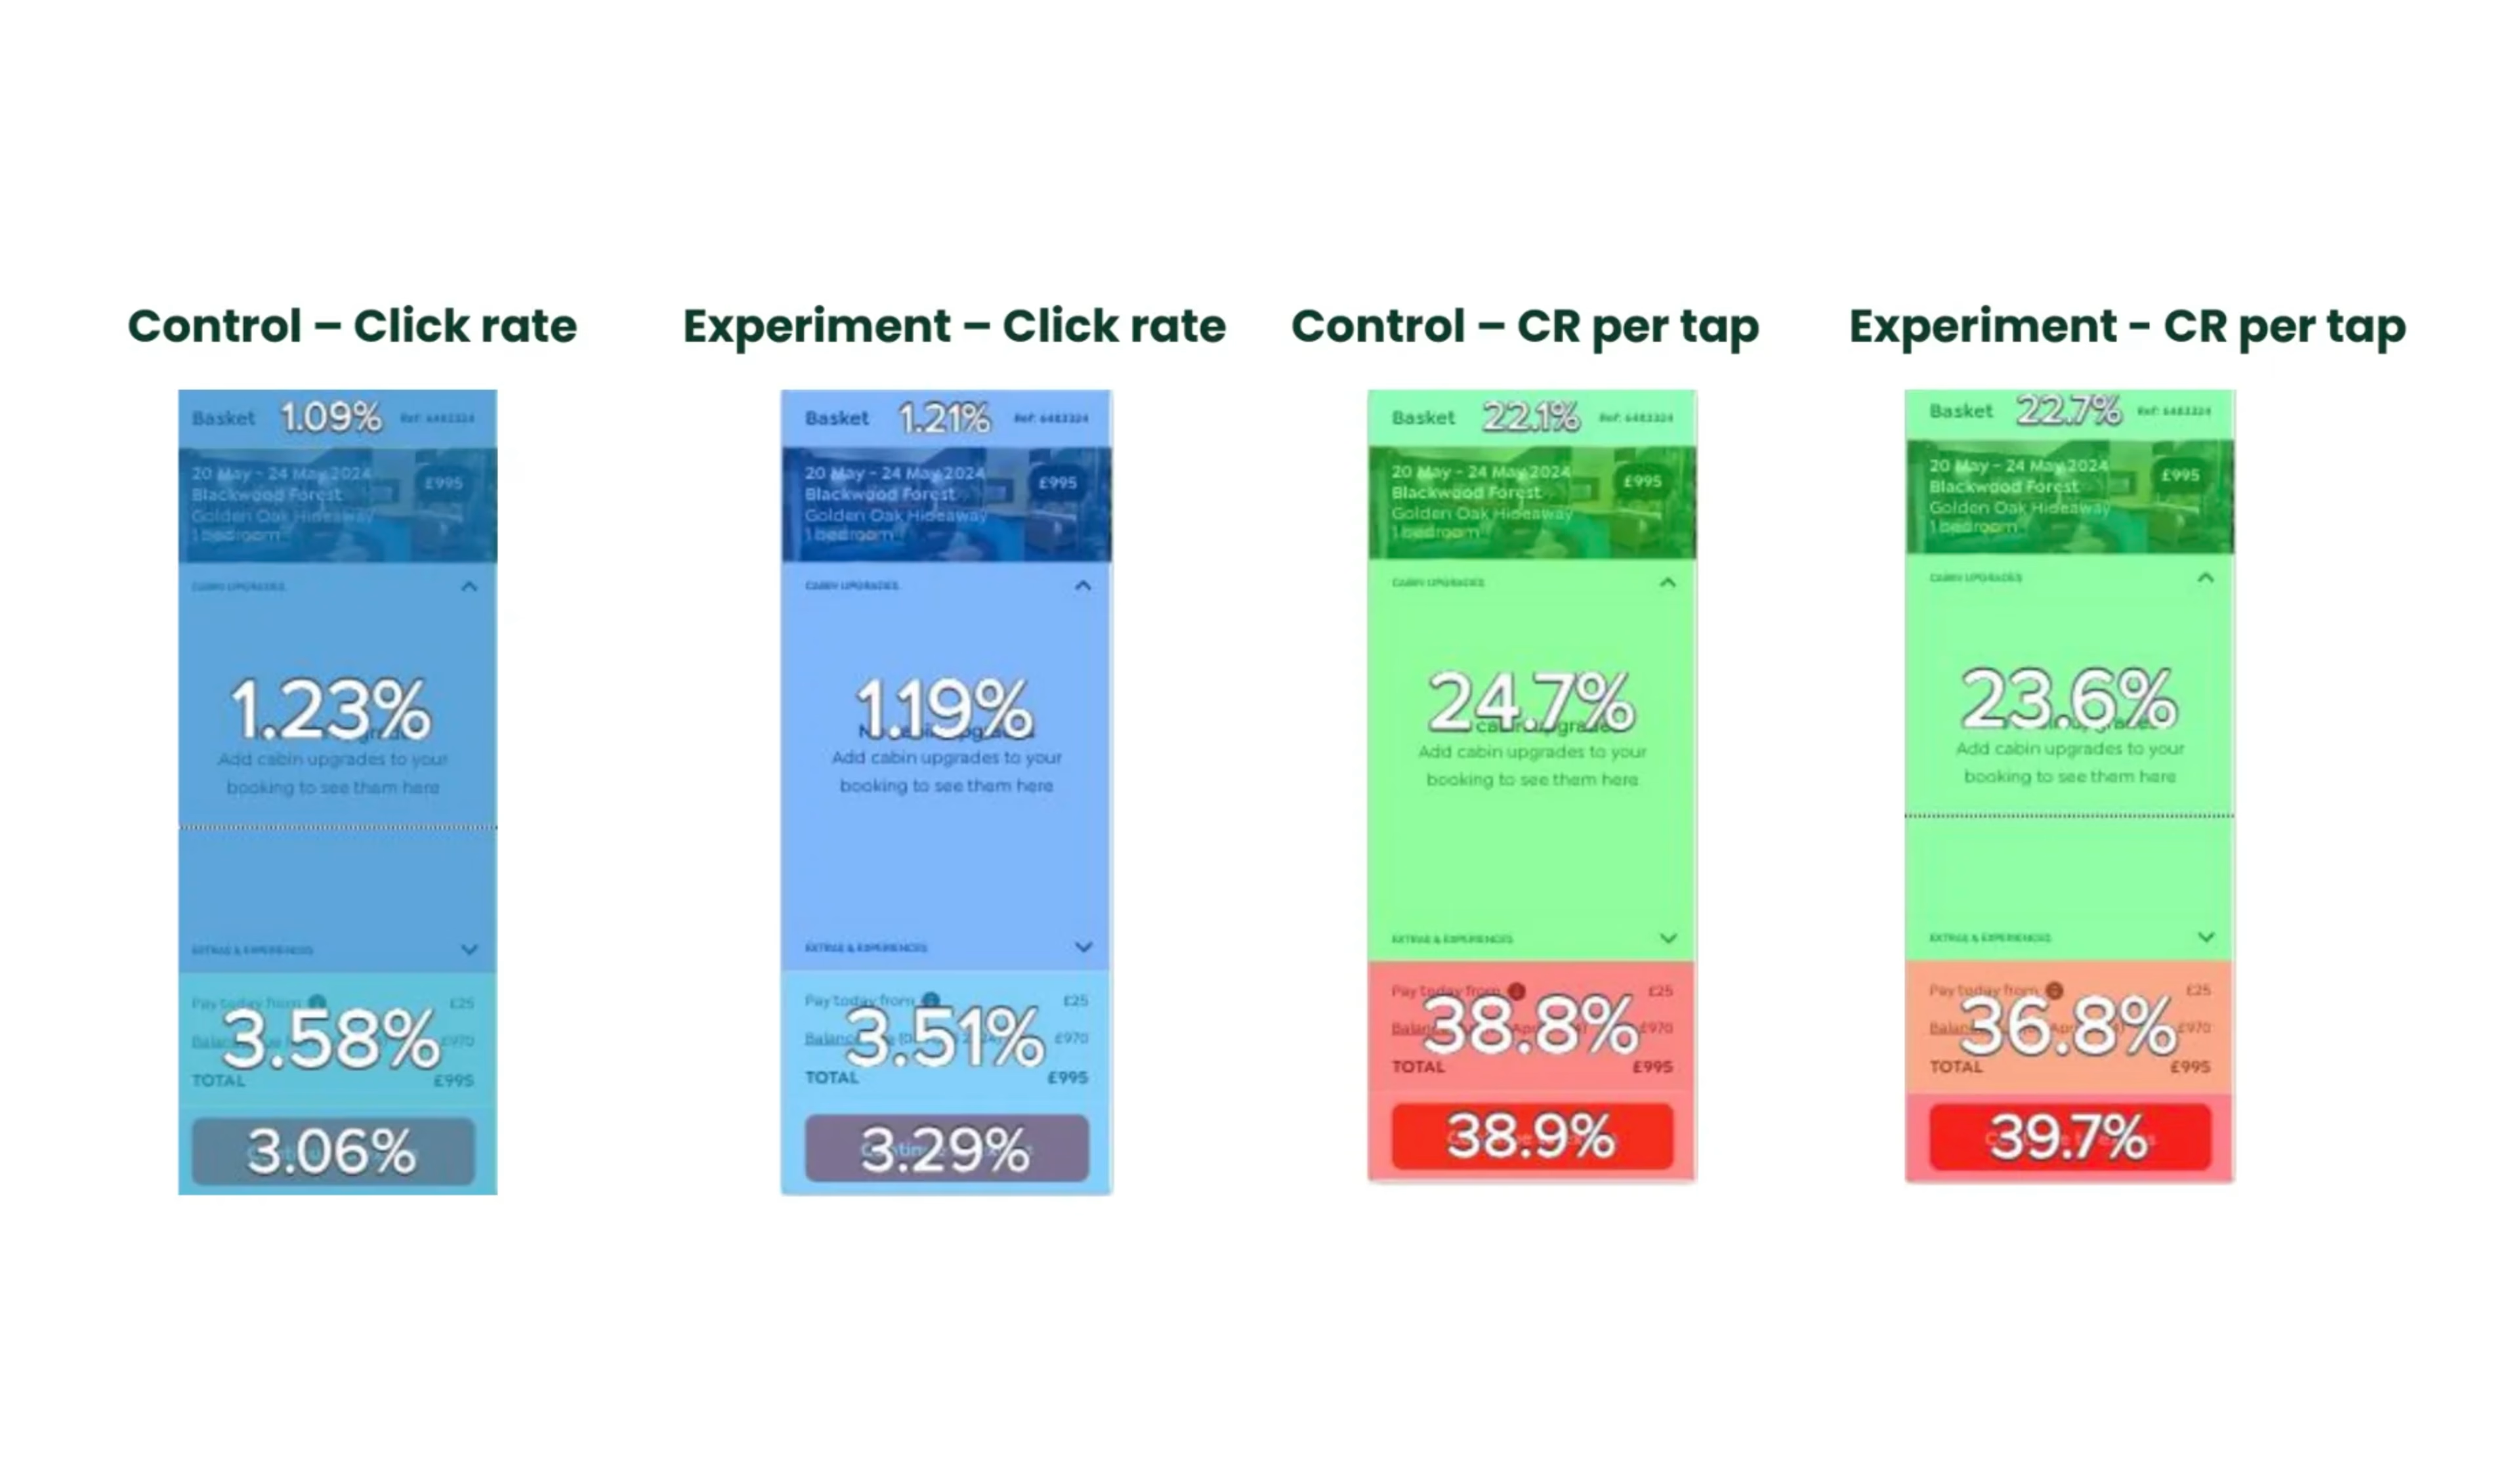
Heatmap analysis on Sykes Holiday Cottages basket page showing click rate and click rate per tap of the control (left) and experiment (right)
Then, the team turned to zone-based heatmaps to investigate how the change affected CTA interactions, starting with a visualization of the percentage of site visitors who clicked at least once in a zone.
Again, Contentsquare was crucial to understanding what customers want and getting closer to proving that for them. “We learned that pricing is really important to our customers and that clarity of price is really important in that context as well,” Jon says.
3. Adjusting formatting to optimize checkout
The previous 2 tests had given the team enough insights into their customers to hypothesize one additional change. The team hypothesized that the ‘Balance due’ text, which had been underlined for emphasis, was causing clicks and confusion.
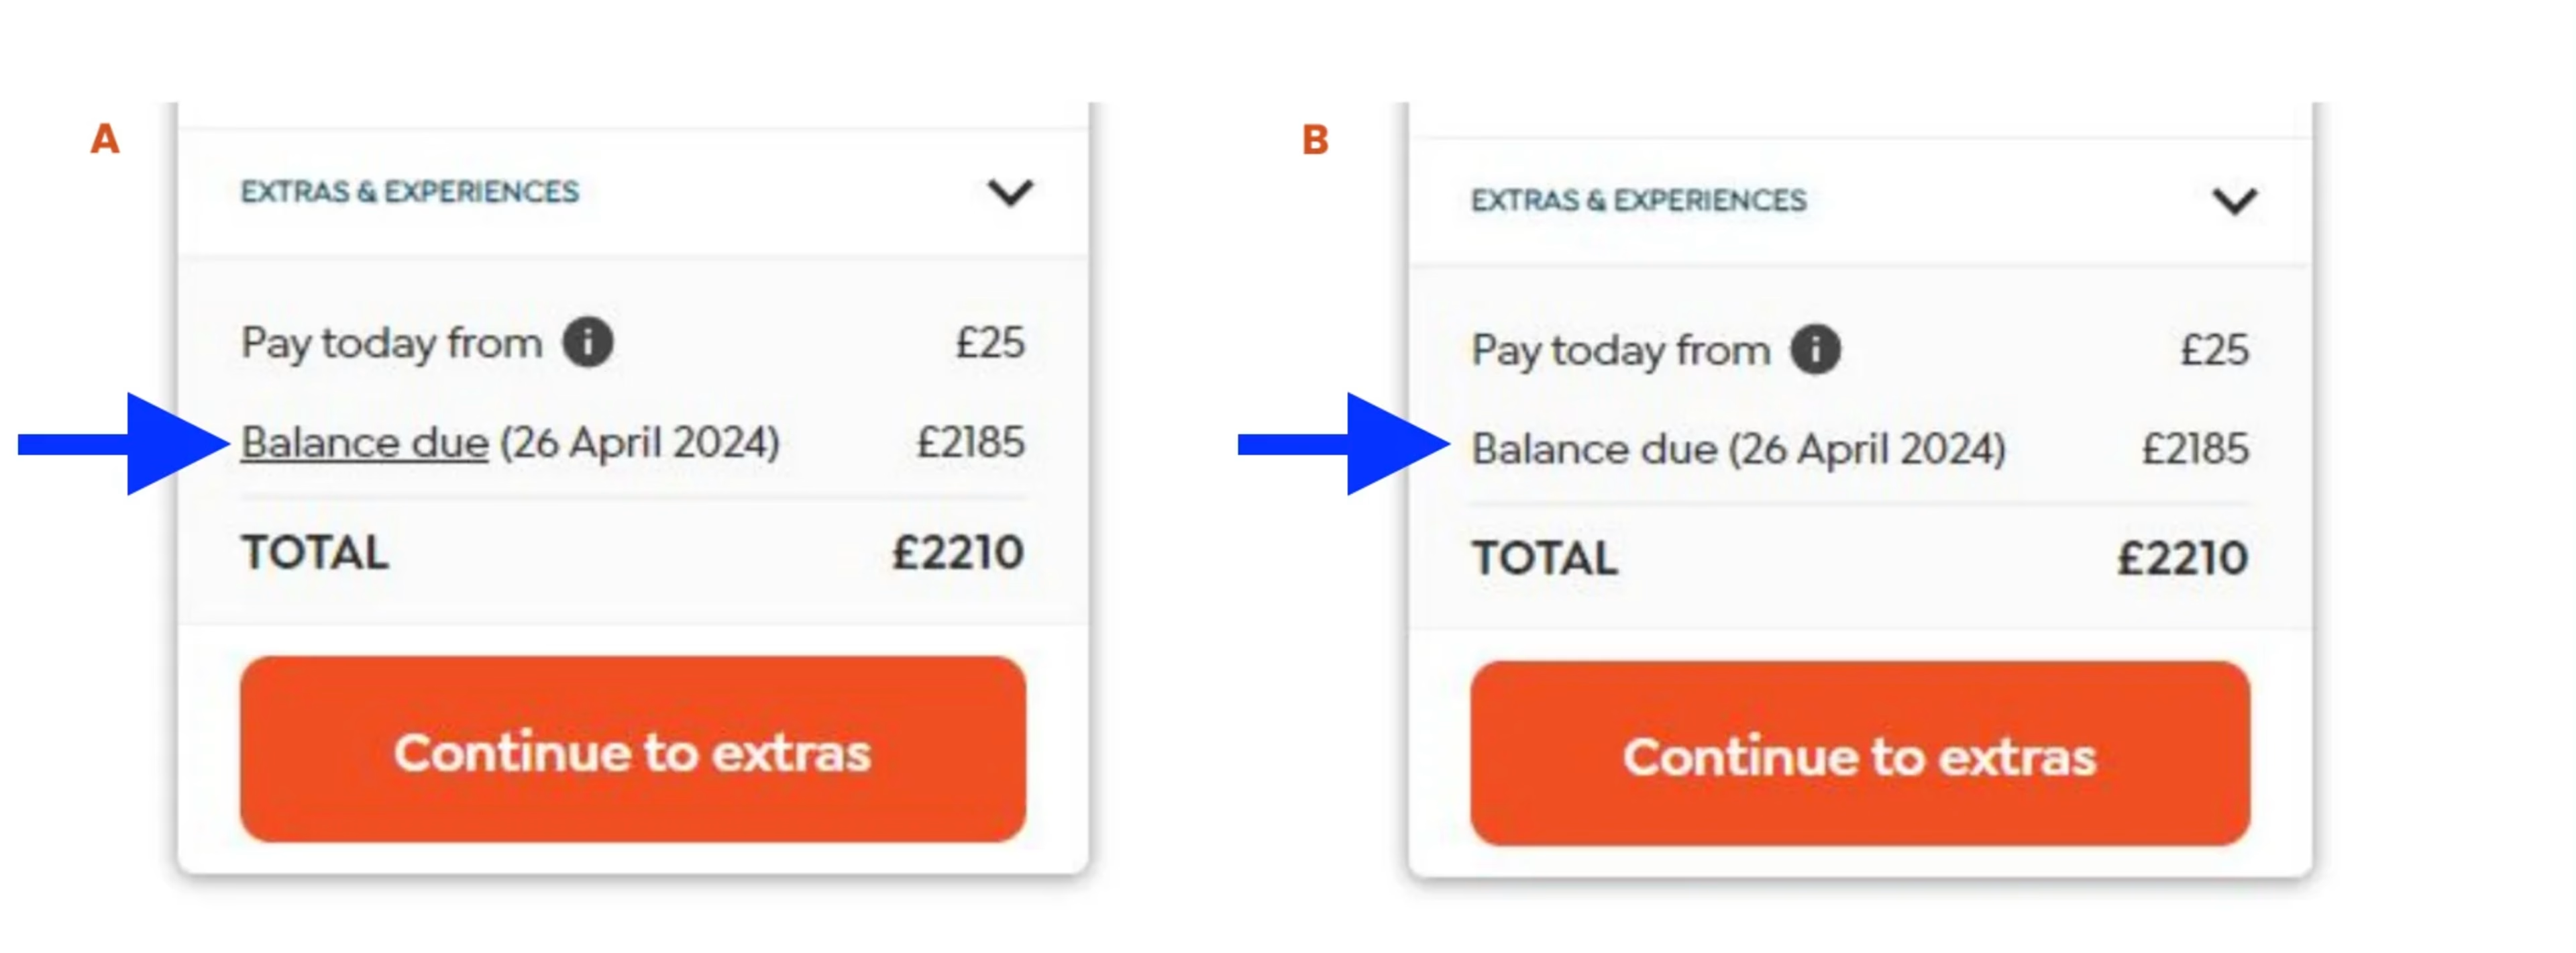
Balance due text on Sykes Holiday Cottages payment page control (left) and experiment (right)
They hoped that by removing the underlining, they’d see an increase in conversions and CTA interactions.
So, they ran another A/B test. Using Contentsquare to analyze the data, they saw a clear increase in funnel completion. Then, they looked at their Heatmaps to gauge the change in CTA interactions.
The results
Analysis in Contentsquare's Experience Analytics enabled Forge Holiday Group to optimize checkout conversions for their Forest Holidays site. With just a few minor adjustments to the UX and three A/B tests, they eased the customer journey and noticed a
-6.5% drop in payment page exit rate
+7.5% increase in call-to-interactions at checkout
+5.3% rise in checkout funnel completion
They also learned more about their customers and what they value, such as clarity in pricing and a frictionless checkout flow. This knowledge has helped them produce other testing successes and see exceptional increases in their year-on-year growth in checkout completion.
The combination of a really strong process and data from Contentsquare has accelerated our volume of successes way beyond our expectations.

What's next?
Forge Holiday Group will continue to rely on Contentsquare to measure the impact of their testing experiments. In particular, Journey Analysis and Zone-Based Heatmaps will help them improve customer happiness and boost revenue through clicks.


