The challenge
To better understand its website user behavior, the City of Paris turned to Contentsquare's Experience Intelligence Platform for help.
With its website being the primary source of information for users, the City of Paris’ communications department—responsible for monitoring, maintaining and updating website content—wanted to understand how its users were navigating and engaging with the site.
1. Creating a data-driven, user-centric culture
When implementing Contentsquare, the City’s communication department had three key objectives in mind
Optimizing content by understanding what type of content users were looking for
Improving the UX design of pages by better understanding user journeys and prioritizing page structure
Driving data-driven decision-making (and moving away from making intuition-based decisions)
Since implementing Contentsquare, teams across the organization have adopted the platform, with numerous departments using the platform to identify points of friction in user journeys that frustrate users and address these to improve the overall website user experience.
Contentsquare has also helped the City of Paris' communications department optimize website content and supported digital transformation throughout the organization.

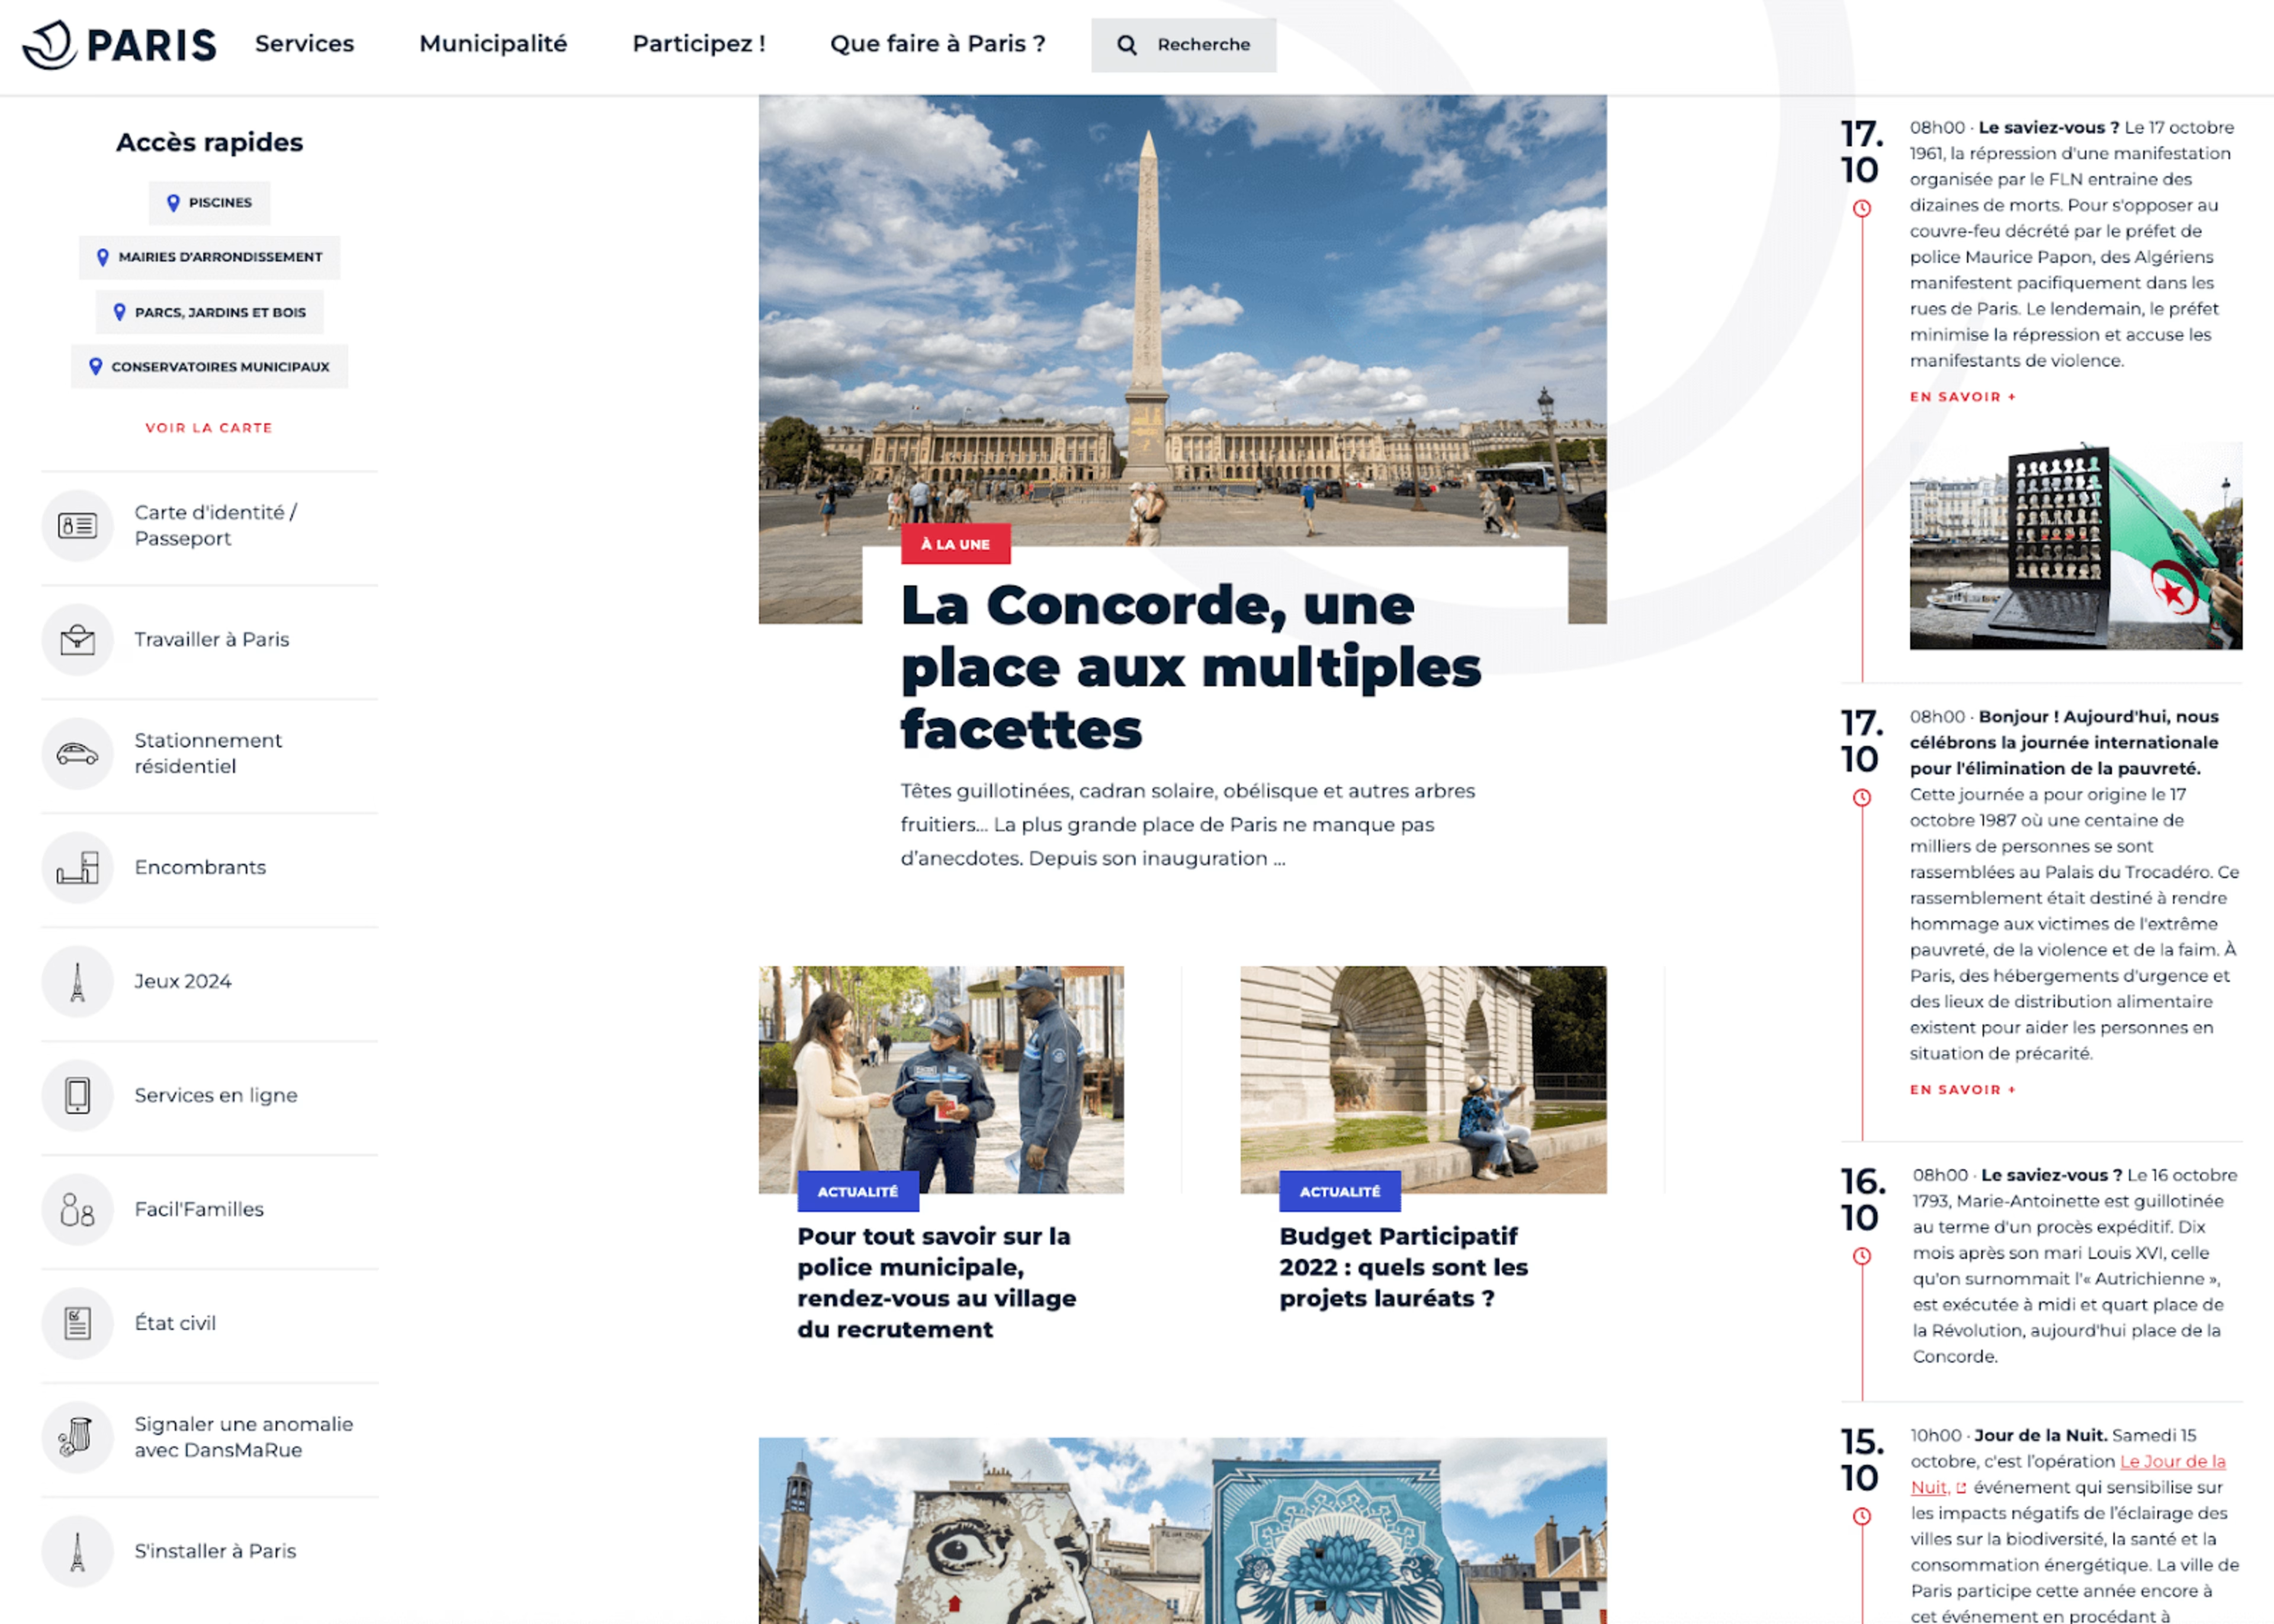
City of Paris's homepage
2. Use case: Olympic Summer Games Paris 2024
In preparation for the 2024 Olympic Games, the City of Paris created a dedicated landing page. To ensure a seamless digital experience for users visiting the page, the city’s communications department decided to analyze engagement using Contentsquare.
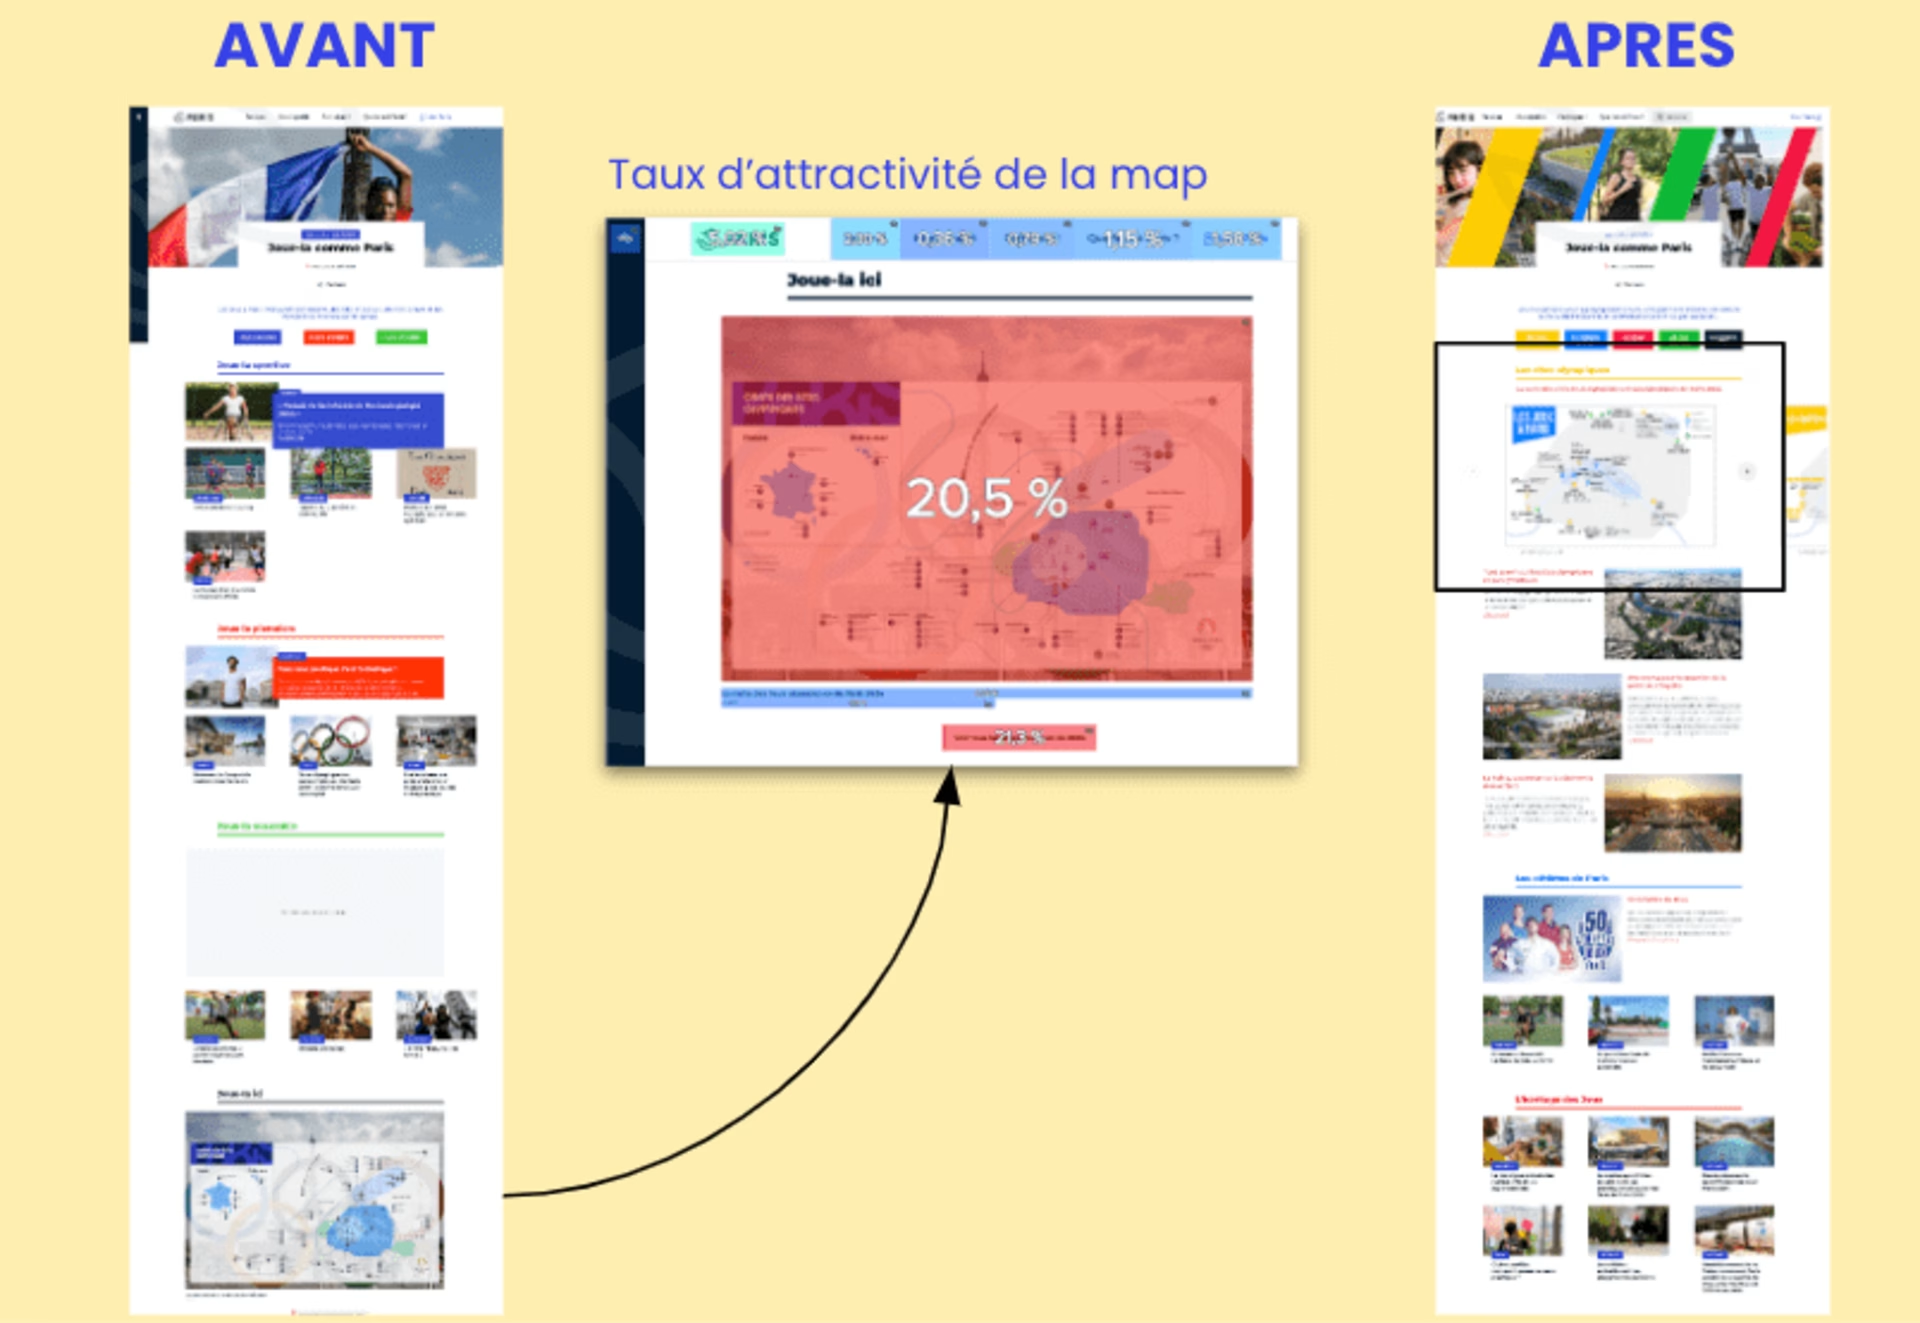
Using Heatmap analysis, the team noticed that users were engaging with the map section at the bottom of the page. This section's attractiveness rate was surprisingly high, at 20.5%. Despite being below the fold, many users clicked on the map of Paris after being exposed to it.

Heatmaps analysis on the Paris 2024 Olympics landing page before optimization (left) and after (right)
Based on these insights, the team decided to move the section higher up the page to increase its exposure.
The results
Higher click recurrence in the map section, and therefore better page performance
Decrease in call volume to the dedicated event phone line
Tips from the City of Paris
Here are 2 tips from the City of Paris on how to make the most of the Contentsquare platform:
Implement early: make sure you implement the solution at the early stages of your digital design projects
Draw on Contentsquare's expertise: make use of the training and support provided by Contentsquare’s team of experts

With a platform like Contentsquare, we’re able to test and validate our hypotheses. It has also helped our team upskill, prioritize our roadmap, set clear objectives, and make user-centric decisions."


