It’s no secret that brick-and-mortar stores have been struggling to attract shoppers in recent years. Now, digital businesses are facing similar challenges with their equivalent of footfall— web traffic.
As revealed in The 2024 Digital Experience Benchmark Report and Interactive Explorer, our latest annual survey of the digital customer experience, visits to websites fell -3.6% year-on-year (YoY) in 2023—and a majority (55%) of sites saw lower web traffic.
In this article, we dive into key findings from our Benchmarks around the traffic data trends of 2023.
Plus, we discuss how digital experience analytics (DXA) helps you get your website (or app) out of this traffic jam in 2024.
Web traffic: why the cost of doing digital business rose last year
Not only was there less website traffic last year, but brands were paying more for it—as paid advertising drove one in three visits (33.8%), a +5.6% YoY gain in traffic share.
At the same time (as highlighted in Tinuiti’s Digital Ads Benchmark Report), ad spend rose across the most critical acquisition channels—+17% on Google and +13% on Meta’s social media platforms.
Given this increased bill, why are websites still so reliant on paid advertising?
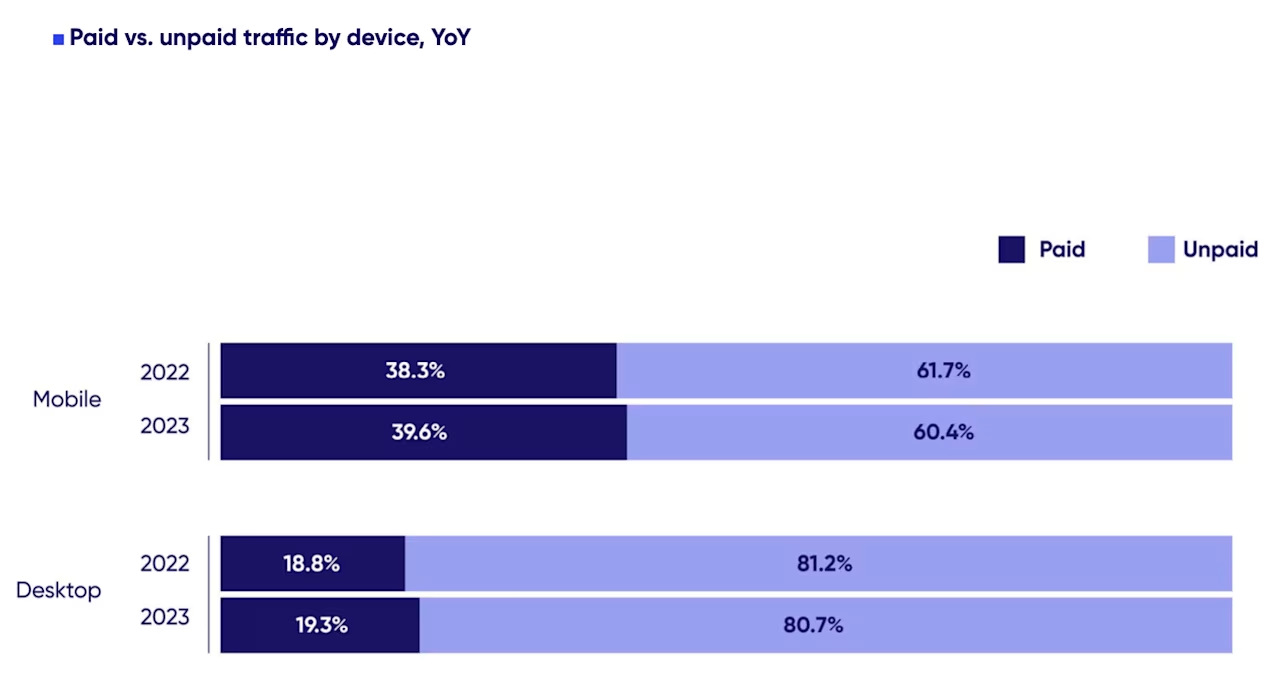
One big reason is that the most traffic came from mobile: it accounted for two in three (69.7%) visits to websites last year (while desktop visits dropped by -11.5% YoY).
Furthermore, 39.5% of mobile traffic came from paid advertising in 2023 (up from 30.5% in 2022), compared to only 19.3% of desktop visits.
Websites’ increasing reliance on increasingly expensive paid sources, combined with the drop in traffic volume, meant cost per visit rose by +9.4% in 2023.
3 ways to increase web traffic with digital experience analytics
Whether it’s a temporary economically determined trend or not, the decline in traffic volume last year has to be reckoned with this year.
And there’s a very real upside to this ultimatum.
The volume drop could be the forcing factor needed to shift the mindsets of digital teams away from simply acquiring new visitors and toward a better, more nuanced understanding of the traffic that does show up—so they can make the most of it.
There are few (if any) more powerful tools for doing that than a digital experience analytics platform like Contentsquare.
Here are just three examples of how DXA helps you capitalize on every visit you get.
1. Understand who your visitors are and how they’re behaving
Our Digital Experience Benchmarks will help you understand the sort of traffic you can expect to see on your website and app this year—and prepare for it.
But to really get a handle on who you’re serving on a daily basis, your business needs specific and up-to-date information on incoming traffic.
A good DXA platform tells you how your visitors got to your site or app (whether that’s via a paid or unpaid source), what device they’re using and whether they’ve visited before.
It tells you how different visitor segments behave once they’re actually on your site or app—so you can compare the behavior of these segments and see where you’re failing to serve one segment while satisfying the other.
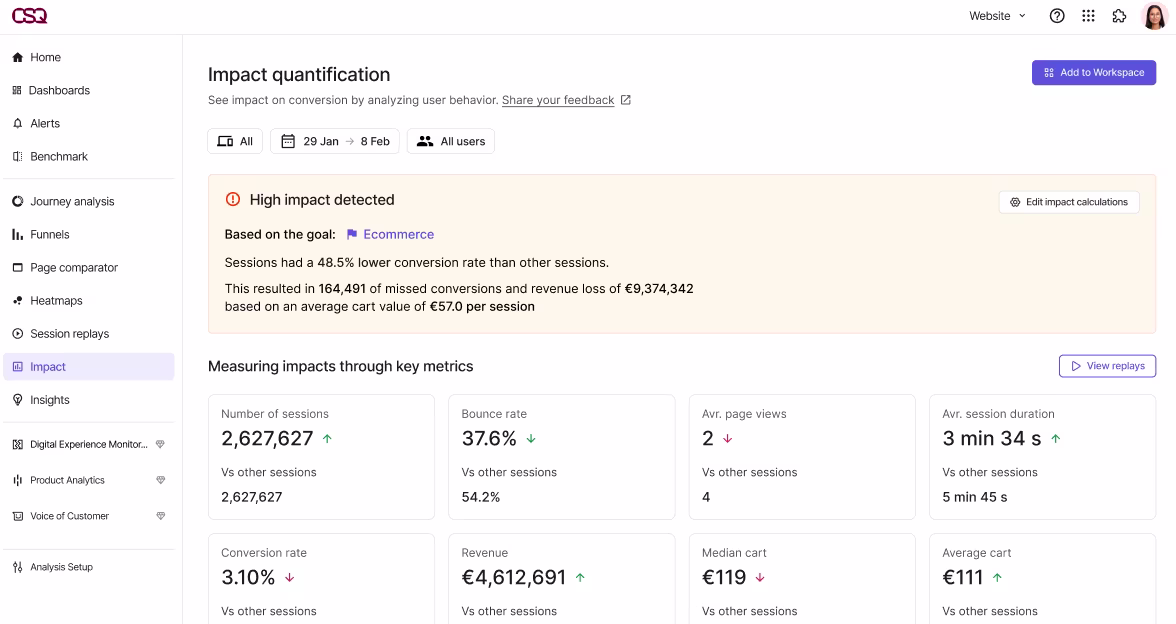
Use Contentsquare’s Impact Quantification to do an extensive analysis of user segments, so you can identify trending behavior by segment, compare the impact of issues on different segments, and understand how they affect conversion, sales and ROI. For example, you can see at a glance how many returning user sessions are impacted by errors on desktop.
2. Optimize your user journeys to increase web traffic
While there are all sorts of ways to attract organic traffic, such as search engine optimization (SEO), to take advantage of that traffic you need to be able to understand how visitors are using your site—at both a macro and micro level.
On the macro side, you need a high-level view of your customer journey.
Customer journey analysis gives your teams a full overview of every visitor’s on-site journey, including where it started, where it ended and the path they took in between.
Using Contentsquare’s Customer Journey Analysis, you get clear, color-coded visualizations that help your teams identify opportunities and issues within seconds.
![[Customer Story] [Clarins] Journey Analysis](http://images.ctfassets.net/gwbpo1m641r7/4nozxbnvlcRqDnxYjbPNnm/707c4b2a2c0c36077eb336538bb1098c/Complex.svg?w=655&q=85&fit=scale)
Our Customer Journey Analysis also lets you segment data to understand how different customer types—defined either by where they came from or how they behaved—are progressing (or not progressing) through your experience.
And, thanks to our recent acquisition of Heap, a leading product analytics platform, Contentsquare also empowers you to understand and optimize user journeys—not only within your website and app, but across all your branded experiences.
3. Minimize frustration and maximize engagement on every page and screen
The 2024 Digital Experience Benchmarks report states that the average bounce rate for websites in 2023 was 48.7%—and that the bounce rate exceeded 50% in six of the ten industries analyzed.
Furthermore, there was a -5.5% YoY drop in conversion rates. This means that not only were teams paying more for less site traffic in 2023—but they also were wasting more of that spend.
One of the biggest factors behind the poor outcomes we saw last year (if not the biggest) is user frustration, which (in a world where customers increasingly expect frictionless experiences) can do real damage to your metrics.
Frustrated visitors might fail to convert, or leave your site or app, never to return. Often, they’ll also spread the word about their bad experience to other potential customers.
DXA platforms equip you to detect and fight frustration with error analysis—a capability that leverages AI to identify, prioritize and alert your team to frustrating technical issues, such as Javascript errors (the culprit in 17.7% of visits in 2023) and malfunctioning buttons on your web pages.
Contentsquare even features an AI-powered frustration score to help you surface where frustration is being fueled the most on your site.
A great DXA platform also gives your team the analytic tools it needs to investigate and fix these issues—as well as user experience (UX) issues relating to page design and copy.
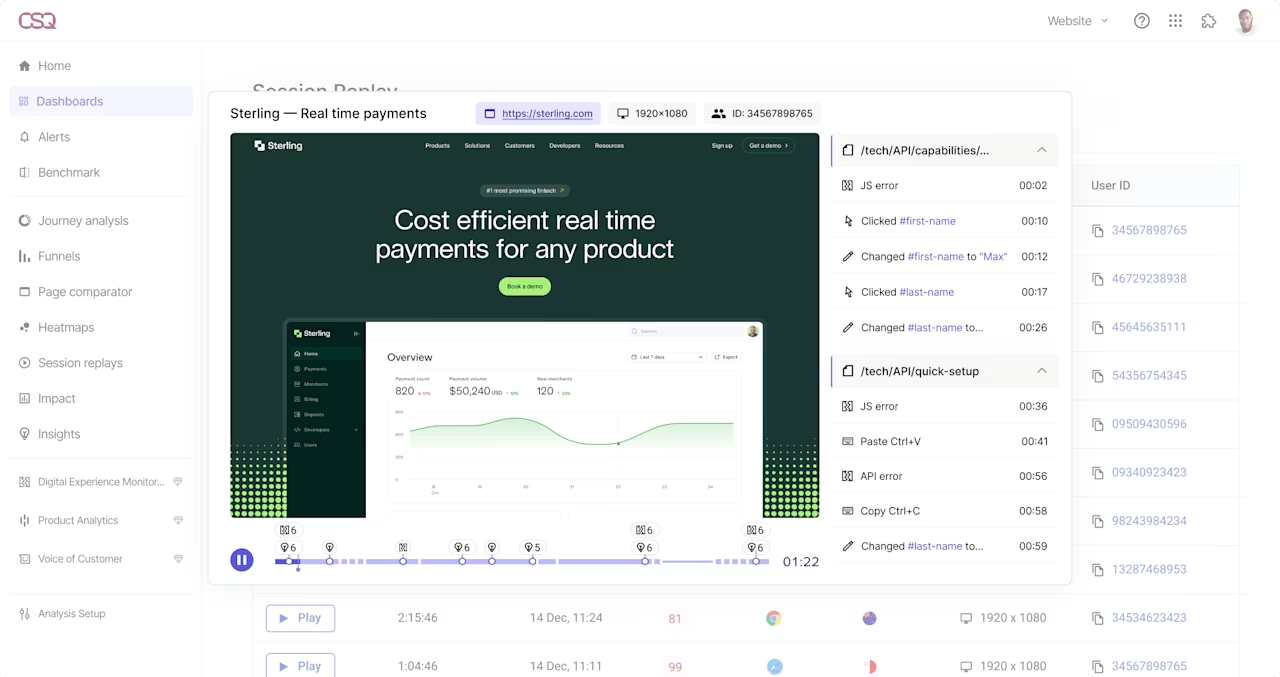
Use Contentsquare’s Zone-Based Heatmaps (pictured below) and Session Replay to see things from your users’ perspective—and identify exactly what and what isn’t working on every page and screen of their brand’s digital experience.
![[Visual] Zoning and Heatmaps](http://images.ctfassets.net/gwbpo1m641r7/1fY6bBg1dnmmchw0aGq0u7/fbbc1440b4715d35ffdbf3b048eafd18/Zoning.png?w=1280&q=85&fit=scale&fm=avif)
Not only does this empower your teams to reduce frustration, but it also enables them to optimize your experience to drive engagement by improving your site content.
5 digital marketing strategies with a customer-centric twist
1. Find new keywords and use them throughout your site
Keyword research and optimization is the process of understanding what your audience searches for and creating a website that answers their query, so that your site is more likely to be the result they see and click on in the search results.
Using an SEO tool—like Google Search Console—to analyze your website traffic is one of the most popular ways to find your top-performing keywords and uncover related terms.
Keywords are often associated with blog posts, but there are opportunities to add keywords across your entire website, including
Product descriptions and meta titles
Structured data for products (like price and ratings)
Product reviews
FAQs
Key pages like product, about, use case, and pricing pages
Customer stories
Help guides
Another way to learn about your customers’ interests is to ask them: a survey with open-ended questions on your website lets you ask visitors what they want to learn from your content. This feedback captures their needs and desires in their own words, a concept known as Voice of Customer (VOC). By using VOC throughout your website, you can create content that resonates deeply with readers and make readers feel as though you’ve “taken the words straight from their mouths.”
🔎 Pro tip: consider the user’s intent at each step of your marketing funnel.
A marketing funnel describes the different steps a customer takes to learn about your company and make a purchase. For example, someone who wants to buy their first kayak may read a blog post about the types of boats, then read about the company’s manufacturing process, review models, and finally make a purchase.
At each step of your marketing funnel, your audience has a different intent—that is, the type of information they want and need.
Use an exit intent survey to discover what’s missing throughout your funnel, and then add keywords at each step to increase engagement.
Imagine the kayak company uses an exit intent survey and realizes visitors leave the product page because they don’t know if they’ll fit in the kayak. In that case, the company would add keywords about weight limits and seat dimensions to optimize the page for user searches at that stage of the funnel.
![[Visual] Exit-intent survey](http://images.ctfassets.net/gwbpo1m641r7/70LxdbnLg3vHHjjMfZjfmb/ae68013aad3713169bfcac7b7ab1c795/image3.png?w=750&q=85&fit=scale&fm=avif)
Use a Contentsquare exit intent survey template to ask visitors what’s missing from your website
2. Learn which content engages your visitors the most
There are a few ways website content, like blog posts, drives traffic to your website.
First, blog posts contain keywords that your audience searches for.
Second, if your content is engaging and relevant to your audience, they may share it with their network and introduce you to new potential customers.
Finally, other websites, publications, or industry newsletters can share your blog posts with their audiences to drive traffic to your site.
However, you need to have relevant and engaging content to drive traffic. Thankfully, your existing audience is the perfect testing group to learn what to do more of and what to leave behind the next time you sit down to create content.
Here are a few ideas to create user-centric content to drive traffic and engagement:
Use a content feedback survey to gauge how visitors feel about your content overall
Use a heatmap to determine which blog topics and layouts catch (and hold) users’ attention
Use open-ended surveys to find topics for new blog posts, webinars, and guides
Watch session replays from blogs with the longest average time on page to learn what engages your audience
Ask your sales and support teams what questions and concerns they hear most often
👀 Watch now: grow your audience with organic content.
Contentsquare (hi, that’s us! 👋) is an experience intelligence insights platform that gives you behavior analytics and feedback data to help you empathize with and understand your customers.
For example, Contentsquare Session Replay lets you watch how visitors use your website, like how they scroll and where they click. Filtering your replays also lets you focus on specific user interactions, like for a particular page or customer segment, to sort through playbacks quickly.
The customer-driven insights from session replays help you improve your content to increase website traffic
3. Use your existing audience to increase website traffic
Influencer marketing is a massive industry (as in roughly $24 billion dollars), and some websites and blogs work with content creators to drive traffic to their sites. To manage and scale creator-led campaigns more efficiently, many marketing teams rely on influencer marketing platforms, which help identify relevant creators, organize collaborations, and measure the traffic and conversions they generate. But professional influencers aren’t the only way to encourage people to recommend your brand—your customers and team can drive qualified web traffic, too. Here’s how:
Use a Net Promoter Score® survey to ask your audience how likely they are to recommend you to a friend. Customers with a high score are called ‘promoters’, and NPS surveys let you identify these fans. Then, ask them to share your company with their network or use their experience as a customer success story.
Set up a referral program to encourage customers to share your business with friends and network. For example, Contentsquare has a partner program where agencies and freelancers earn a revenue share for referrals.
Share your perspectives with industry influencers. For example, find opportunities (like podcasts) for internal team members to be guests on. Giving your internal team opportunities to share their experiences makes your brand feel more personal while increasing traffic and attention.
4. Uncover popular topics and graphics to use in social media campaigns
The social media marketing landscape is constantly changing, and there’s no way to be active and effective across all channels all the time. Understanding your customers and which content and channels drive the most traffic helps you prioritize your work.
Try these strategies to create a customer-centric social media strategy:
Place a survey on your blog that asks visitors where they heard about you to identify top promotion channels and referrers
Create a concept test survey on your site to let your audience vote on their preferred visuals
Interview customers to uncover audience psychographics that influence your campaign positioning
Use heatmaps to see what imagery catches visitor attention on your website to reuse in social media campaigns
![[Visual] Heatmaps types](http://images.ctfassets.net/gwbpo1m641r7/44qPX6Nyu2v2i9pGM8JdIE/e1ccfd573959295483bb4b867ca7e57f/Heatmaps___Engagements__3_.png?w=1002&q=85&fit=scale&fm=avif)
Different types of heatmaps reveal on-page patterns so you understand what content your users find most valuable
5. Test, measure, repeat
Measuring marketing performance helps you make informed decisions to choose the right traffic-increasing strategy in the future.
For example, suppose a webinar and a social media campaign took the same effort to produce, but the webinar delivered more qualified traffic. In that case, you know which tactic to use again.
Everything you learn about customers also allows you to collaborate within your company.
While teams might work in silos, like marketing or product management, your customers experience your brand holistically. Everything is connected, and each channel provides insights you can use in every other medium.
For example, if a blog post on a particular topic drives a lot of traffic and engagement, create a social media campaign on the same topic.
Here are a few tips on how to measure and improve your website traffic strategies:
Look for user behavior patterns over time, like which page has the highest drop-offs
Use customer satisfaction surveys to spot downward trends in satisfaction
Share insights across teams so everyone makes customer-centric decisions
Use a feedback widget to get customer insights for specific pages and improve the user experience
Use Funnel Analysis to find where users drop off and investigate with recordings
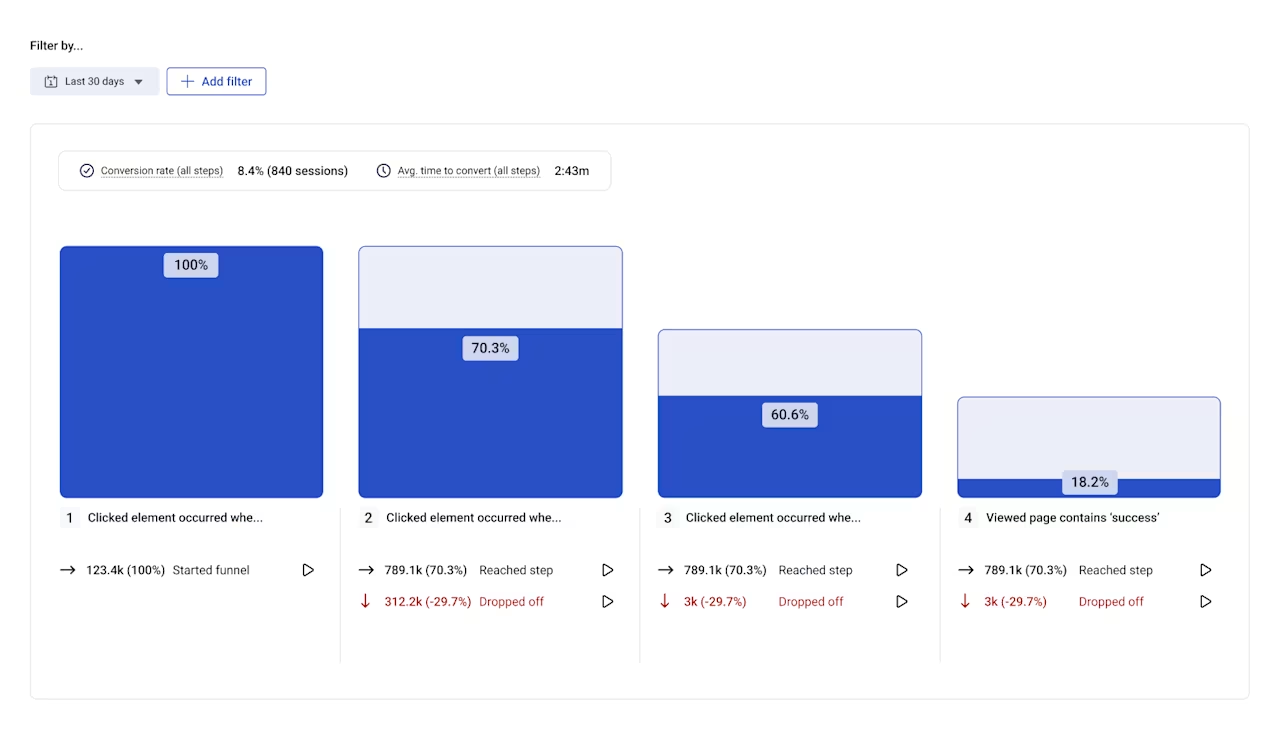
Contentsquare Funnel Analysis quantifies how visitors move through your website and lets you zoom in on steps with relevant session replays
💡 Pro tip: talk to customers to avoid working based on assumptions.
A feedback loop lets your team continuously connect with customers through interviews, surveys, and feedback tools to improve your website performance and increase traffic. Staying close to customers also prevents you from making random decisions based on guesses and hunches.
But what do you ask in a customer interview or on a survey to understand your audience? Here are 11 questions to get you started.
If our product disappeared tomorrow, would you try to find a competitor or could you live without it?
How often do you use our product?
What is your main goal for using our product?
What's preventing you from achieving this goal?
What's your greatest concern about our product?
What changed after you began using our product?
Why did you choose to use our product over others?
Have you used a similar product before?
How can we make our product better?
What do you like most about our product?
What do you like least about our product?
Turning traffic into sales
Once the traffic starts pouring in, you’ll want ways to turn those people into happy customers. Here are some tips:
Create detailed customer profiles: targeting the right audience is key to turning traffic into sales. If your customer profiles are vague, focus on narrowing them down. Use data like click-through rates (CTR) to identify who is engaging with your content and target niche demographics that are more likely to convert.
Align your keywords with your goals: evaluate the keywords driving traffic to your site and ask yourself whether you’re prioritizing sales-focused keywords (and attracting folks who are ready to buy). For example, "cost-effective laptops" is more likely to convert than "how to connect airpods to laptop."
Make your calls to action clear: every ad, post, or landing page should have a clear and immediate call to action (CTA). Tell your audience exactly what you want them to do—whether that’s to sign up for a free trial, download a whitepaper, or make a purchase. Experiment with different CTA copy to see what resonates most with your audience.
Optimize your website for usability: a smooth user experience is crucial for converting visitors. Conduct A/B testing and gather feedback to uncover potential pain points, such as a clunky checkout process or hard-to-find buttons. Use tools (like Session Replay and Heatmaps) to analyze where users are navigating, bouncing, or converting to make data-driven improvements.
Ensure your site is mobile-friendly: mobile optimization is non-negotiable. Test your site on multiple devices to ensure it’s easy to navigate, buttons are appropriately sized, and all elements display correctly. You’ll keep more mobile visitors around if you provide them with a good user experience.
Minimize frustration and maximize engagement on every page and screen: frustrated visitors might fail to convert, or leave your site or app, never to return. Error analysis tools can bring frustrating errors to light and help you spot them right away before they become bigger problems, so you can fix them and give users a delightful experience no matter which page they land on.
Understand the customer journey: customer journey analysis gives your teams a full overview of every visitor’s on-site journey, including where it started, where it ended, and the path they took in between. Using Contentsquare’s Journey Analysis, you get clear, color-coded visualizations that help your teams identify opportunities and issues within seconds.
![[Visual] Journey analysis on reference mapping](http://images.ctfassets.net/gwbpo1m641r7/30V6WdNQ7xg3mlOFV7DkmY/0e2235977563e2c759fdbd873d51ae59/01-Masthead__1_.png?w=1280&q=85&fit=scale&fm=avif)
🦁 Heatmaps in the wild
The team at Etam wanted to better understand how users navigated their site and what stopped them from moving towards a purchase during their ‘Love Price’ promotion.
Reviewing mobile heatmaps helped Etam’s team discover that users weren’t scrolling far enough down the homepage to see the Love Price promotional content block. As a result, this traffic wasn’t turning into customers.
A thoughtful homepage redesign did the trick, and as a result, the conversion rate per click on the Love Price block improved +16%.
Customer-centricity is an ongoing effort
Your customers and company are always evolving, so your work needs to constantly evolve, too. The more you invest in customer-centric strategies, the more insights you uncover, which you can then re-invest into your next campaign.
Combining curiosity and empathy with experience insights research tools ensures you make continuous progress toward your website goals.
FAQ on web traffic
Web traffic refers to the number of visitors who access a website. It is a key metric for measuring a site’s popularity, engagement, and overall online success. High web traffic can lead to increased brand visibility, higher conversion rates, and improved SEO rankings.
![[Visual] Jack Law](http://images.ctfassets.net/gwbpo1m641r7/6K99ulcVqLqKGyNZUaPiF8/145af0b27131005d862c790ddcafb3c5/Jack_Law.jpg?w=1280&q=85&fit=scale&fm=avif)
Jack has been creating and copywriting content on both agency and client-side for seven years and he’s ‘just getting warmed up’. When he’s not creating content, Jack enjoys climbing walls, reading books, playing video games, obsessing over music and drinking Guinness.