![[Visual] Contentsquare x Figma connector](http://images.ctfassets.net/gwbpo1m641r7/DdcOUXDymMZzq40kq8jcT/852456a5c6c879db8f564d2b84a6b817/Figma.png?w=1280&q=85&fit=scale&fm=avif)
You're redesigning a checkout flow, but the data on how real users move through the current one sits in a dashboard you rarely open. So you design from memory and best guesses, ship it, and wait. Weeks later, the numbers come back and show people hesitating and dropping off in the exact spots you could have fixed if you'd seen the behavior while you worked.
This guide shows design and product teams how to close that gap by bringing user behavior from Contentsquare into the Figma workflow, with real use cases and example prompts, so your next design starts from what users actually do, not what you assume.
Key insights
The problem isn't missing data, it's distance: most teams already track how users behave, but that evidence lives in a separate tool, so it arrives after the design decision is already made
Designing based on real behavior changes what you iterate on: when data sits beside the canvas, you shape screens around what users actually did, not a persona you imagined, and you do it in the moment
Evidence-led improvements compound over time: addressing real sources of friction early can help teams protect experience quality and reduce the risk of larger problems later.
Plain-language access spreads insight: when anyone can ask about real behavior in everyday words, insight stops being gated behind analysts and dashboards, so teams move faster and agree on evidence
Why design decisions need real behavioral data
Data-driven design means shaping screens around evidence of how people behave, not opinions in a review meeting. Why does that matter? Because a design can look polished and still send users away, and you can't always see that gap from the canvas alone.
Behavioral data closes it. It shows you where users hesitate, where they rage-click in frustration, and where they abandon a flow. You fix the real problem instead of guessing at it.
And the stakes are measurable. In our 2026 Digital Experience Benchmark Report, a 1.5-percentage-point reduction in rage per page was associated with one additional page view per session. Small experience fixes measurably extend journeys.
That link between friction and attention is exactly why conversion rate optimization depends on real behavior. Conversion rate optimization is the practice of improving how many users complete a goal, and assumptions can't do that work for you.
The catch is speed. Most teams keep behavioral data in one tool and design in another, so insights land too late to shape the work. Close that distance, and design decisions get made faster and with more confidence.
What is the Contentsquare MCP connector for Figma?
Model context protocol (MCP) is an open standard that lets AI tools connect to outside data through one common interface. Think of it as a universal adapter that plugs live data into the AI you already use.
The Contentsquare MCP connector for Figma uses that standard to bring behavioral data into Figma Make. It lets an AI agent pull real user data from Contentsquare as you design, so the numbers describing how people behave sit right where you make design choices.
How the Contentsquare MCP connector works inside Figma Make
The connector runs inside the Figma Make chat, where you generate designs and prototypes from natural language. You open the chat, connect the two tools, and ask a behavioral question in plain English, like "Which checkout elements are causing the most frustration this week?"
Figma AI then calls the Contentsquare MCP tool and returns updated data in real time. That data becomes the context for your next move, whether that's generating a prototype, redesigning a component, or prioritizing a fix. You do all of it without leaving the canvas.
Because the data is live, you're not working from a screenshot of last quarter's report. For example, Contentsquare’s Journey Analysis, which shows the paths users take through your product from start to finish, is one data source the connector has access to, so you can see where people drop off before you decide what to change. Contentsquare captures this behavior automatically, without manual tagging, so the history is ready when you ask.
Why Figma Make and Contentsquare work well together
Figma Make is where product, design, and engineering teams ideate, prototype, and ship digital experiences. Contentsquare is where you see how real users experience those designs once they're live. Connected through MCP, one feeds the other, so behavioral evidence turns into design action in the same workflow.
The closed loop from live data to design action
The value shows up as a loop with 4 simple stages:
Users interact with your live product. Contentsquare captures behavioral signals like rage clicks, scroll drop-offs, funnel exits, and errors.
The connector surfaces the friction. It makes that data answerable in plain language, returning updated metrics and friction points.
Figma Make acts on the insight. The agent uses that behavioral context to generate redesigns, restructure layouts, or build prototypes on the canvas.
The design ships and the loop restarts. The new experience goes live, and Contentsquare starts measuring how users respond, feeding the next round with data rather than guesses.
![[Screenshot] Contentsquare MCP Figma UI](http://images.ctfassets.net/gwbpo1m641r7/TShRhGez9MnXMnim308rs/6ca018c79aece25d2de2251141126794/1aefe7e7-c5fc-43ce-b8c1-ea32fc84e422.png?w=1269&q=85&fit=scale&fm=avif)
How to connect Figma and Contentsquare
What Contentsquare contributes
Contentsquare brings the behavioral side of the story into the design. Through the MCP connector, you get signals like frustration and rage-click rates, scroll depth and engagement-zone metrics, funnel drop-off and step conversion rates, and error rates tied to their revenue impact.
What Figma Make contributes
Figma Make brings the action. Its AI agents generate designs from natural language, read and write to your design system, run several agents in parallel, and build interactive prototypes, all on the canvas.
6 ways to use the Contentsquare MCP connector for Figma: examples and prompts
The six scenarios below are illustrative examples of how to turn a behavioral question into a design change without leaving Figma. Each one shows the exact prompt to type in the Figma Make chat, the data the connector pulls back, and what a Figma Make agent can do with it.
1. Automate weekly error-to-design briefs
Picture this: it’s Monday morning, 8:45 am. Before your first coffee, a UX incident brief is already waiting on the canvas.
You set this up once as a standing prompt in the Figma Make chat, with the Contentsquare connector added and type in this prompt:
Every Monday, pull last week's top five errors from Contentsquare and rank them by revenue impact. For each one, create a frame with the error, the affected user percentage, the revenue impact, and a proposed fix wireframe.
The connector runs Impact Quantification, which estimates the business impact associated with each error, so the priciest problems rank first. A Figma Make agent then turns the top five into wireframe frames.
At the top could sit a cart 404 that quietly wipes around $18,000 and snags about 6.2% of checkout sessions, already scoped with two fix options before standup. A repair could ship by Thursday.
2. Push A/B test winners into your design system
A design system is the shared library of components and styles that keeps a product consistent. When an A/B test finally picks a winner, rolling it out everywhere manually can be tedious work, so you hand that to the connector instead.
In the Figma Make chat, ask:
Pull the results of our homepage hero A/B test (variants A, B, and C) from Contentsquare, identify the winner by conversion rate and engagement, promote it into our main design system, and update the four dependent page templates.
The connector returns each variant's performance, then a Figma Make agent updates the shared component and propagates it across all four templates with an annotated decision log.
If Variant B shows a 14% mobile conversion uplift, the team could use that result to inform a design-system update. A rollout that used to take about three weeks could collapse into roughly three minutes, and anyone who opens the component later sees exactly why it changed.
Pro tip: ask the agent to attach the test data to the decision log, so anyone reviewing the change sees the evidence behind it.
3. Redesign funnel drop-off points in parallel
When a flow leaks users at more than one step, you don't have to fix them one at a time.
In the Figma Make chat, ask:
Analyze our onboarding funnel (steps 1 to 6) in Contentsquare, identify the two biggest drop-off points, then spin up two Figma Make agents at once: one to simplify the highest drop-off step, one to add a persistent progress indicator across every step.
The connector analyzes the available funnel data, showing step-by-step conversion and drop-off patterns. Say it flags Step 3 losing around 41% of visitors at the email verification step and Step 5 losing around 29% at plan selection.
Two agents then work in parallel: one rebuilds Step 3 with one-click social verification, the other threads a progress indicator across every frame. You review both redesigns in a single session instead of across two sprints.
4. Turn rage clicks into instant interface redesigns
Rage clicks are fast taps or clicks made in succession that indicate frustration, confusion, or a mismatch between user expectations and interface behavior. They’re a useful signal for investigation.
In the Figma Make chat, ask:
Pull rage click data on checkout step 2 from Contentsquare for the last 14 days, identify the top three elements by frustration score, then generate two redesign variants for each in Figma Make that reduce cognitive load and ambiguity.
The connector surfaces these frustration signals, showing exactly which elements users tap in anger. Say the data flags the CTA button at around 34% of rage clicks, the promo field at 28%, and the shipping selector at 19%. A Figma Make agent returns two variants per element, each annotated with the data behind it.
Pick the strongest variants, and checkout frustration scores could fall by around 31% over a fortnight.
5. Fix low-reach areas with data-informed layouts
A scroll dead zone is a stretch of the page most users never reach, so your best content can sit there unseen.
In the Figma Make chat, ask:
Pull scroll depth and zone engagement from Contentsquare for our product detail page on mobile over the last 30 days, find the zones in the dead scroll area, then restructure our Figma product detail page template so the high-engagement content sits above the fold.
The connector shows you how far people scroll and where their attention lands. The data might say around 68% of mobile users never scroll past the hero, while the highest-clicking reviews section is stranded below the fold. A layout agent could propose compressing the hero and moving the reviews into a more visible position for the team to review and test, helping you improve scroll depth and product detail page (PDP) conversion.
6. Build prototypes from real user sessions
Sometimes the fastest fix is to prototype the exact sessions where users struggled, not a persona you imagined.
In the Figma Make chat, ask:
Export all sessions from Contentsquare where mobile users hit the pricing page but didn't convert in the last 14 days, summarize the common struggle patterns, then build two Figma Make prototypes testing alternative pricing layouts that target those problems.
Say around 2,340 non-converting mobile pricing sessions come back, with one clear pattern: the subscription pay plans are difficult to read or use on small screens.
A Figma Make agent builds two prototypes to test against each other, a sticky comparison bar and a horizontal card swipe.
Both land on the canvas ready for testing, and mobile conversion could rise by around 19% in the first month.
What questions can you ask the connector?
You ask questions in natural language, the same way you'd ask a teammate, and the connector returns live behavioral data. Here are 6 example prompts grouped by goal, each with what comes back.
Errors: "Which errors cost us the most revenue last week?" returns ranked issues with their business impact
A/B tests: "Which hero variant won on mobile?" returns the winning variant and its conversion uplift
Funnels: "Where do users drop off in onboarding?" returns step-by-step drop-off and conversion rates
Frustration: "Which elements on checkout cause the most frustration?" returns ranked rage-click hotspots
Scroll: "How far do mobile users scroll on this page?" returns scroll depth and engagement zones
Sessions: "Show me non-converting pricing sessions this week" returns a filtered set of real sessions to study
How to get started with the connector in Figma Make
Getting started takes minutes, and you stay in control of what data the AI can reach. Contentsquare requires consent for access, so nothing is pulled automatically. Important: The Contentsquare MCP Connector for Figma is available through the Figma desktop app, not Figma in the browser.
Step 1: Connect the Contentsquare connector in the Figma Make chat
Open the Figma Make chat and select the Contentsquare MCP connector from the available tools.
Step 2: Authorize access to your data
Approve the connection so the AI can read your behavioral data. It gets set up in minutes, and you decide what it can access.
Step 3: Ask a behavioral question in plain language
Type a question about real users, like where they drop off or what frustrates them. The connector pulls the answer right into the chat.
Step 4: Turn the insight into a design change on the canvas
Ask Figma Make to act on that answer. It can redesign a screen, restructure a layout, or build a prototype grounded in the data.
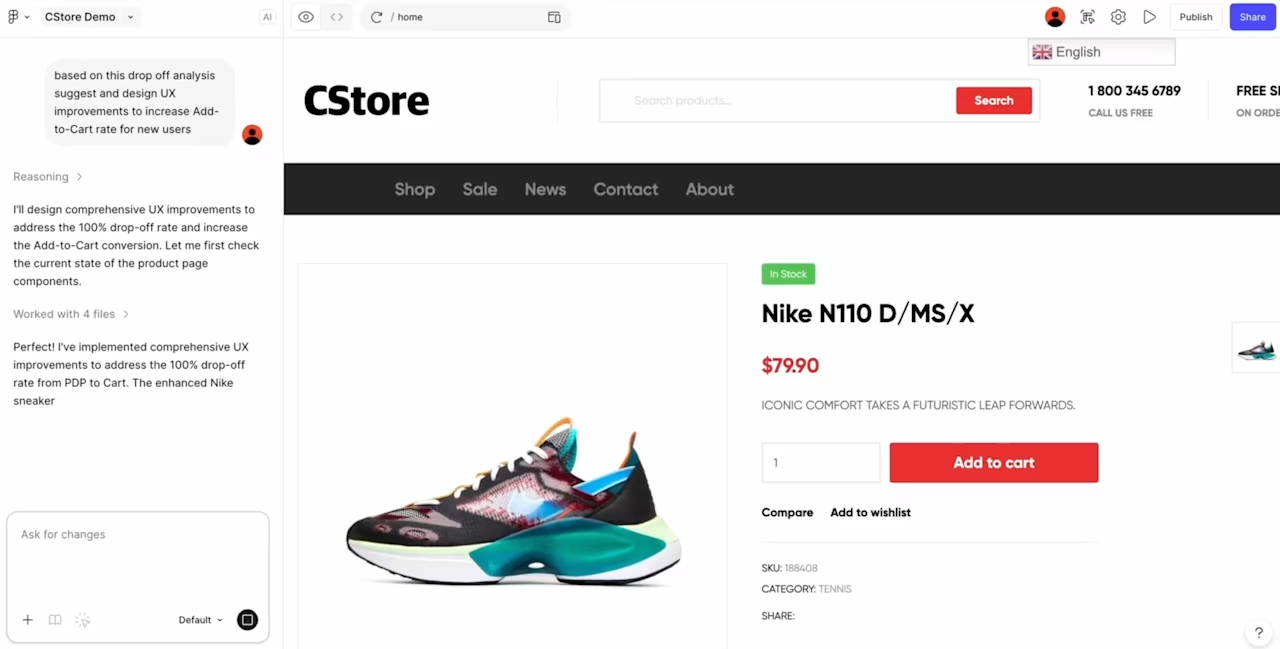
An example of how to use the Contentsquare MCP for Figma
FAQs about Contentsquare’s MCP connector for Figma
No. You ask questions in plain English, and the connector handles the data, so no code or query language is required.
![[Visual] Contentsquare's Content Team](http://images.ctfassets.net/gwbpo1m641r7/3IVEUbRzFIoC9mf5EJ2qHY/f25ccd2131dfd63f5c63b5b92cc4ba20/Copy_of_Copy_of_BLOG-icp-8117438.jpeg?w=946&q=85&fit=scale&fm=avif)
We’re an international team of content experts and writers with a passion for all things customer experience (CX). From best practices to the hottest trends in digital, we’ve got it covered. Explore our guides to learn everything you need to know to create experiences that your customers will love. Happy reading!
![[Blog] [Visual] Contentsquare's MCP](http://images.ctfassets.net/gwbpo1m641r7/5LCFhK68ROZ4LLkDAeaIKB/75eee8adbcc634dbdccf086807afc279/AdobeStock_361859073.jpeg?w=624&q=85&fit=scale&fm=avif)
![[Stock] 3 tips for your experimentation strategy](http://images.ctfassets.net/gwbpo1m641r7/7rzAn0l1w7lrnyGqqbPQsX/fc7b3d311b738d81ead59cb6144fa3f2/Copy_of_Why_you_need_to_host_an_anxiety_party__1_.png?w=624&q=85&fit=scale&fm=avif)