![[Guide] [Behavior analytics] Strategy - Cover image](http://images.ctfassets.net/gwbpo1m641r7/2mYjwn6o7Ifwx2h19dmA9V/fcb2b0375023eb3072e886ce0605d7fb/5744496.jpg?w=3840&q=100&fit=fill&fm=avif)
In the past few years, the financial services (FinServ) industry has undergone a total digital overhaul. Advancements in technology—from generative AI to payment apps—and the rising expectations of tech-savvy consumers are quickly reshaping the so-called traditional FinServ industry.
Mike Zarif, Product Lead at Afterpay, says it best:
“Today's customers are used to intuitive experiences like Uber, Uber Eats, Facebook and Apple, which have become the benchmark for customer experience. The key to building a successful digital product or experience is keeping up with and exceeding these expectations.”
The pressure is on financial services to deliver exceptional digital experiences that stand out from the competition.
To give you the insight, focus and strategic direction you need to succeed this year, we've analyzed FinServ user behavior data throughout 2023, including the most important digital metrics to measure and optimize for. We've applied our analysis to a massive dataset, comprising of >10.3 billion page views, >3 billion sessions, 430 sites, 27 countries and two FinServ sectors.
So, what did we find out?
While consumption on FinServ sites rose last year, traffic volume shrank significantly, and visits were marred by frustration. Keep reading to dive into these three trends in user behavior and find out what they mean for your digital experience in 2024.
1. Unpaid channels dominate dwindling traffic
Unfortunately, fewer visits were the harsh reality for sites in 2023.
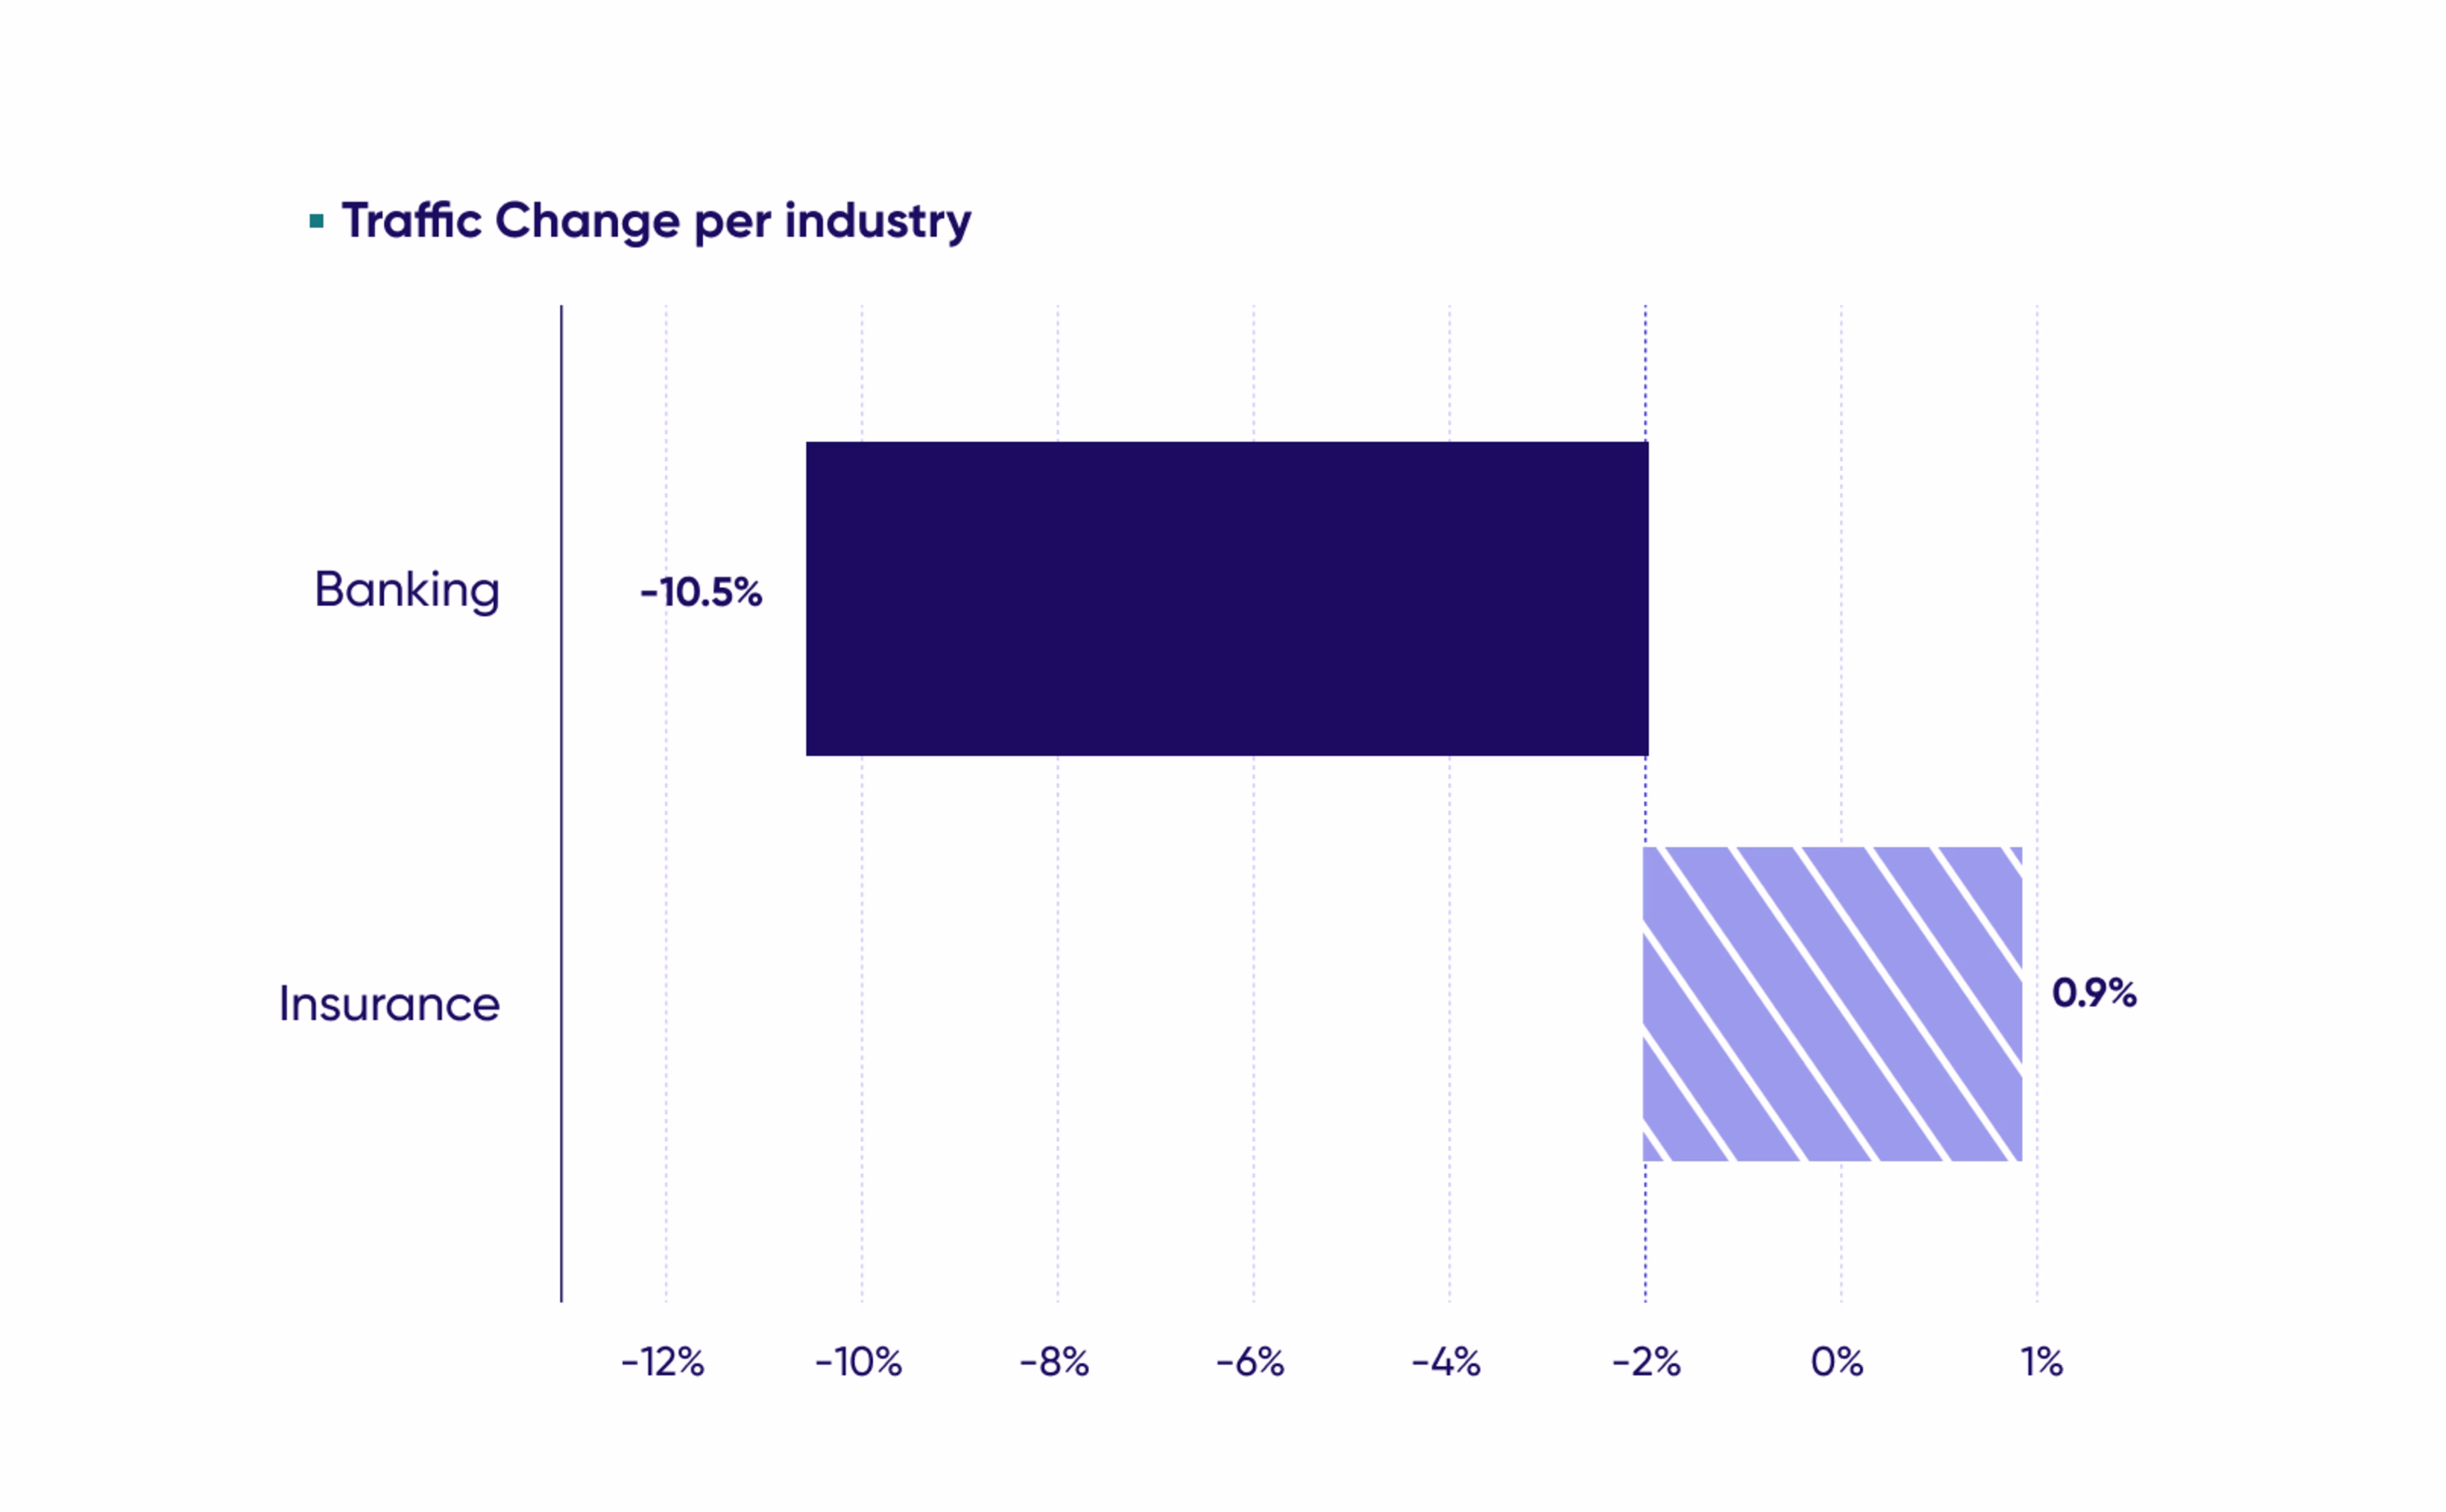
Traffic fell by -1.3% in 2023 across the industry—with banking suffering the biggest loss of -10.5%. Insurance managed to eke out a very slight gain of +0.9%.
This traffic decline hit hard on new visitor traffic, which fell by -4.5% YoY (as opposed to returning traffic, which grew by +1.8%). Rather than focus on driving brand new traffic to FinServ sites, digital strategies have zeroed in on keeping existing visitors coming back.
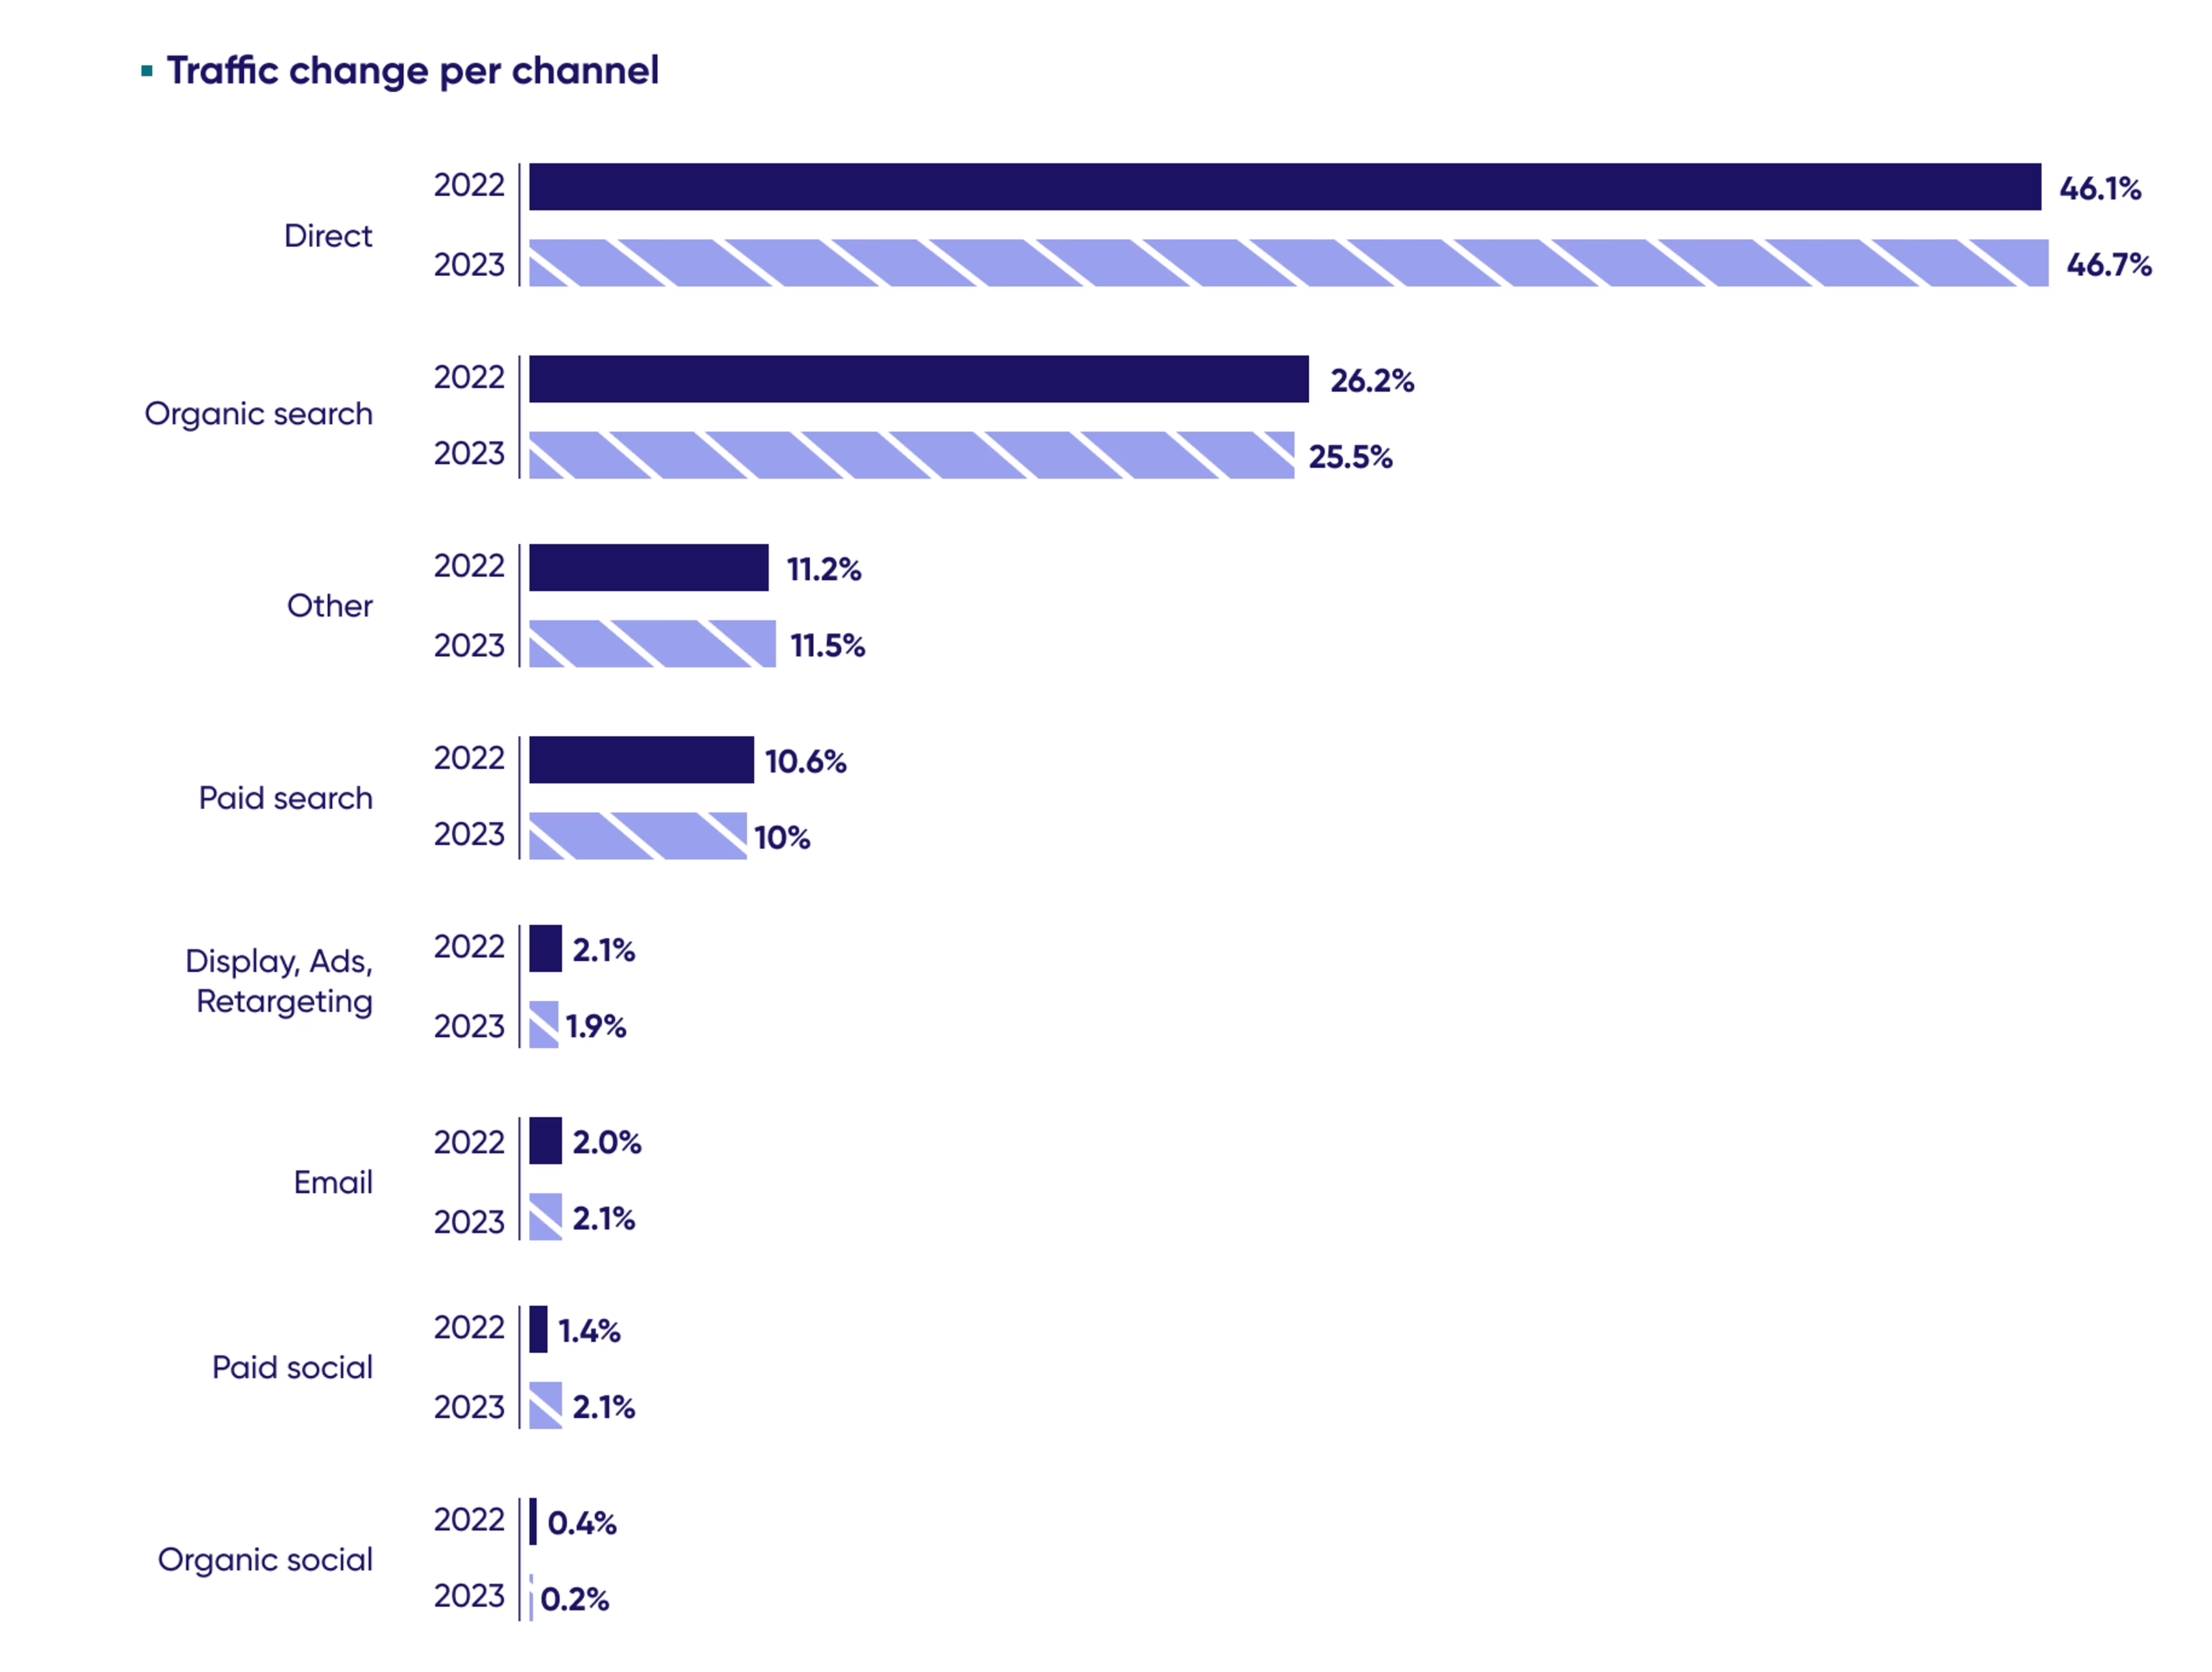
And unlike other industries (that paid a steep price for their traffic), the majority (86%) of this dwindling traffic came from unpaid channels.
Paid channels across FinServ made up 14% of all traffic YoY, and 19.1% of new visits. It was more important for Insurance sites with 19% of all traffic coming from paid, compared to Banking's 11%.
With such a huge dip in traffic volume—particularly in Banking—investing in paid channels could help drive growth for FinServ firms this year.
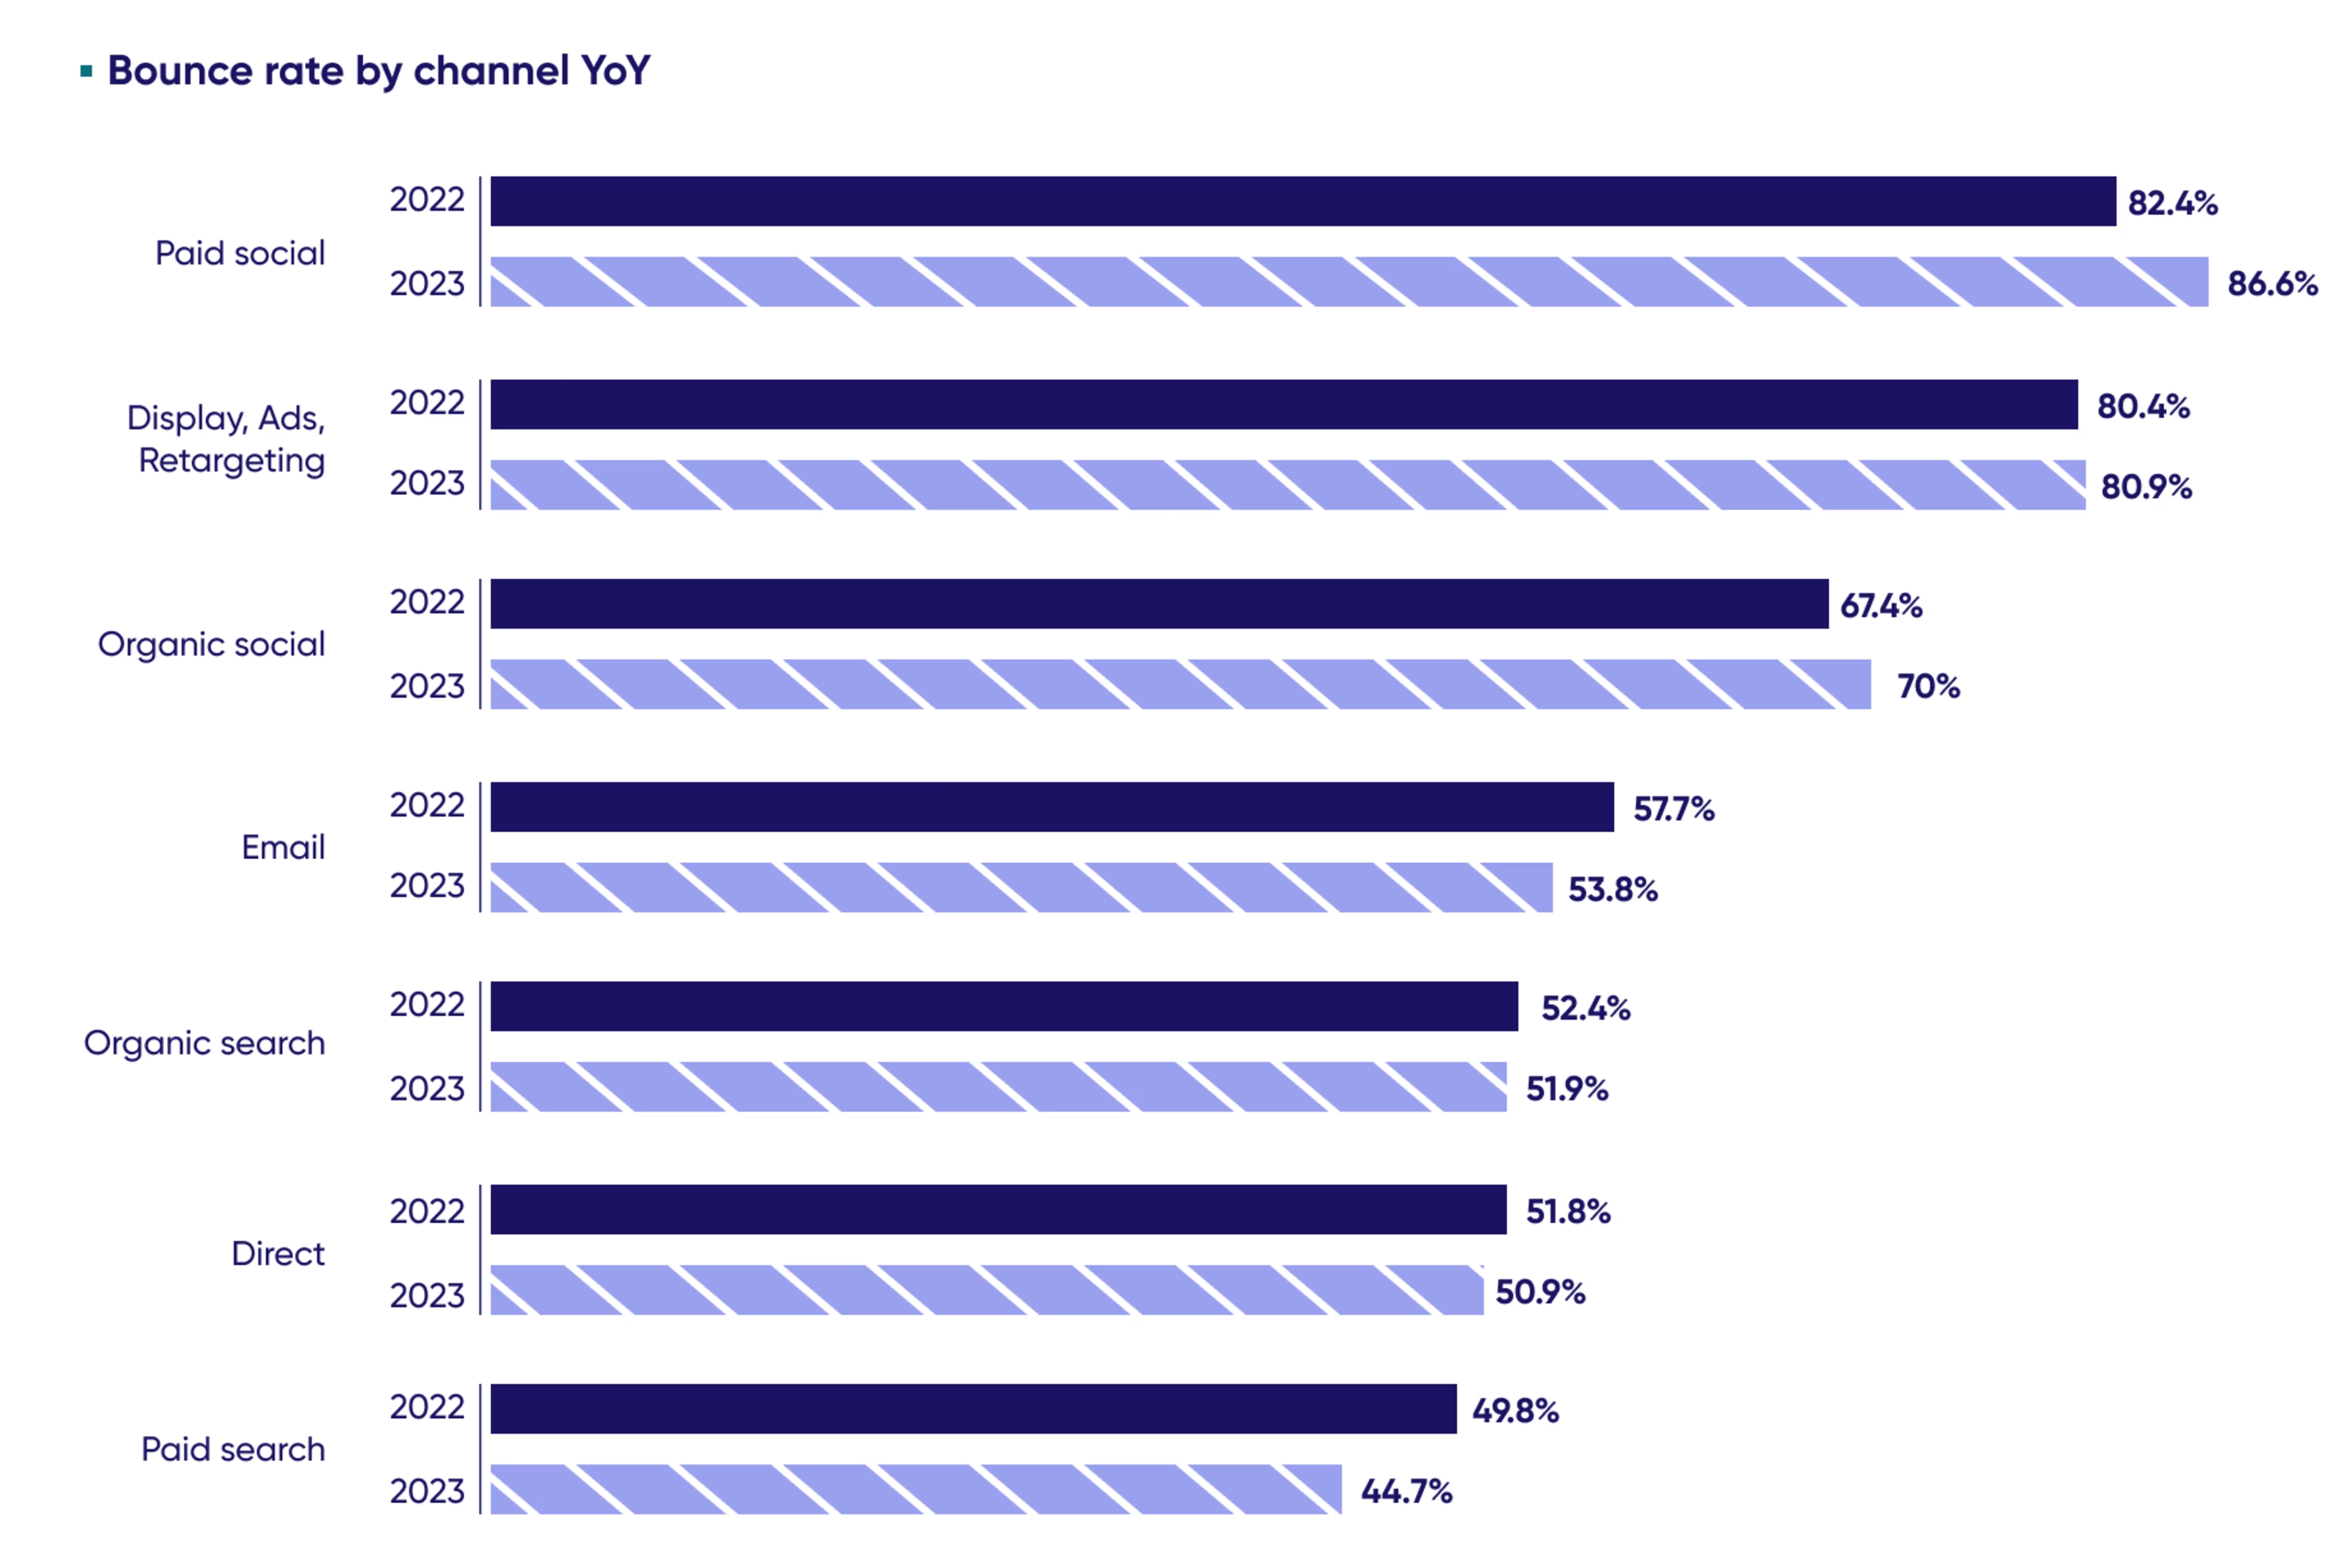
And out of all channels, paid search stands out as a top contender. It drove a fair bit of traffic (10.0%) in 2023 and had the lowest bounce rate (44.7%).
On the other hand, a big chunk of paid channels (paid social and display ads) had sky-high bounce rates exceeding 80%.
This may look unfavorable, but a high bounce rate isn't always bad—paid channels tend to send visitors to landing pages designed specifically for a call to action. Visitors generally convert or leave by design, leading to higher bounce rates.
So, before you set off to change your digital strategy, start by understanding the traffic coming into your website and the on-site behavior of your customers:
Where are your visitors coming from?
What devices are they using?
And why do they behave the way they do?
Digital Experience Analytics helps you answer these questions. And only once you have these insights can you prioritize the right actions to optimize your on-site experience.
2. Consumption rises, but mobile web sessions fall short
Consumption measures how much content a visitor consumes on your site during a session, including page views and time on-site.
It's an important metric for gauging visitor engagement, helping digital teams understand whether their content is hitting the mark.
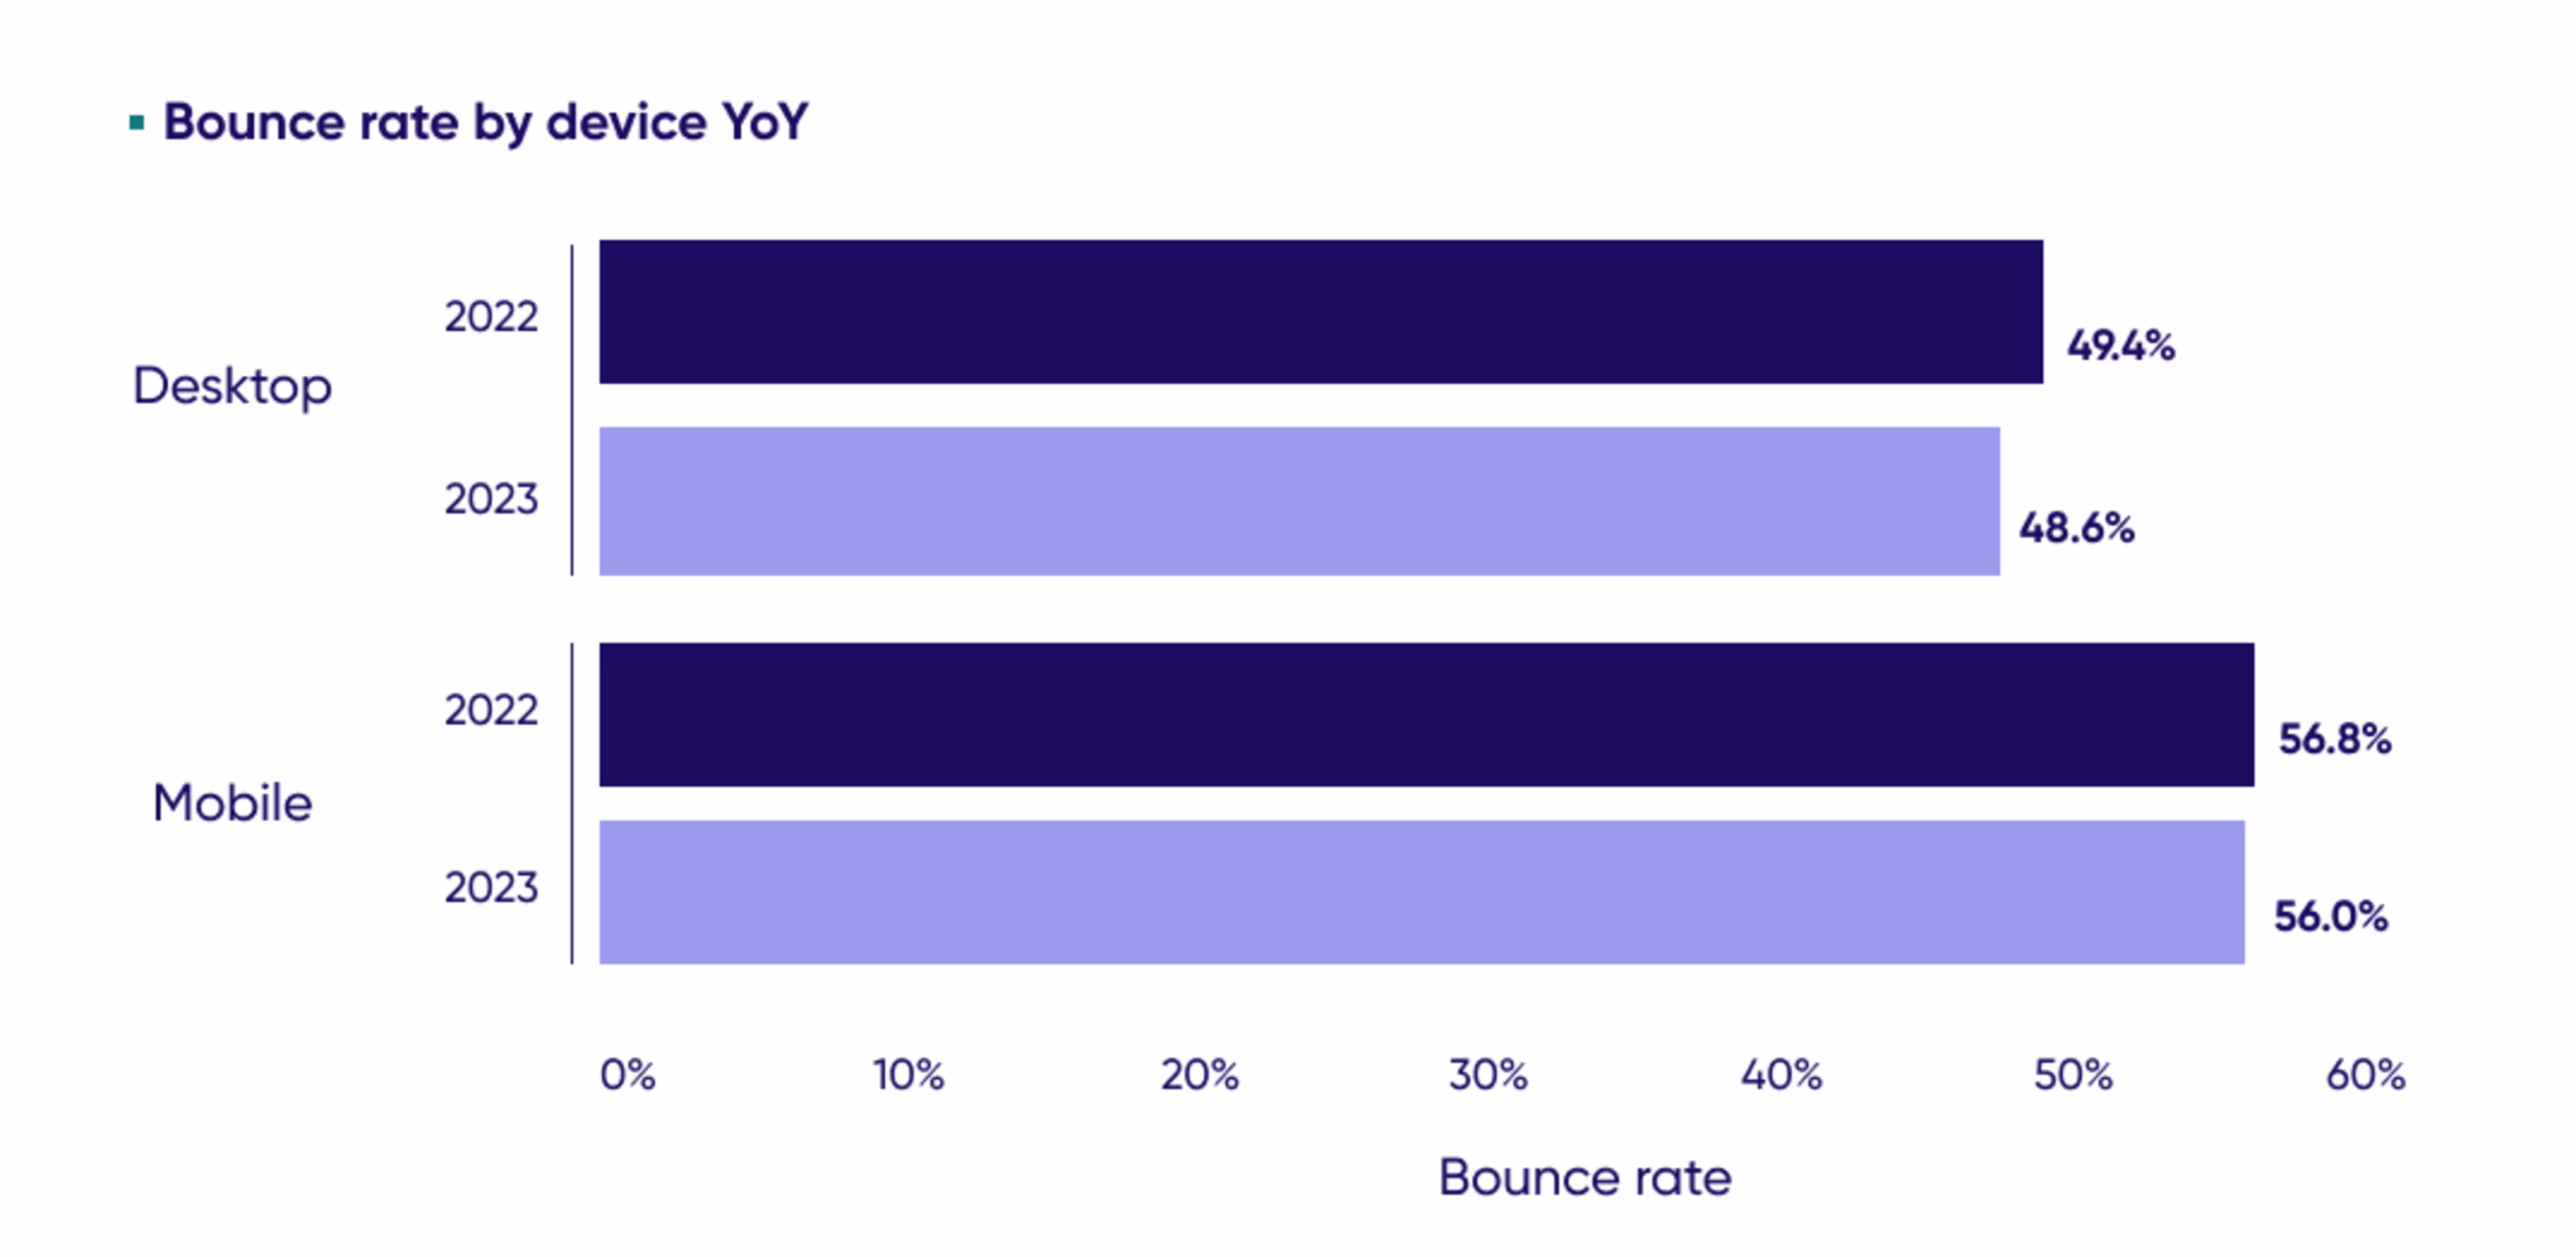
While consumption across FinServ sites was up by +7.4% YoY (+3.4 in Banking and +3.8 in Insurance) last year, mobile web sessions fell short in comparison to desktop.
The truth is that mobile visitors see fewer pages, and spend far less time on site. In other words, mobile's reality is the micro-visit.
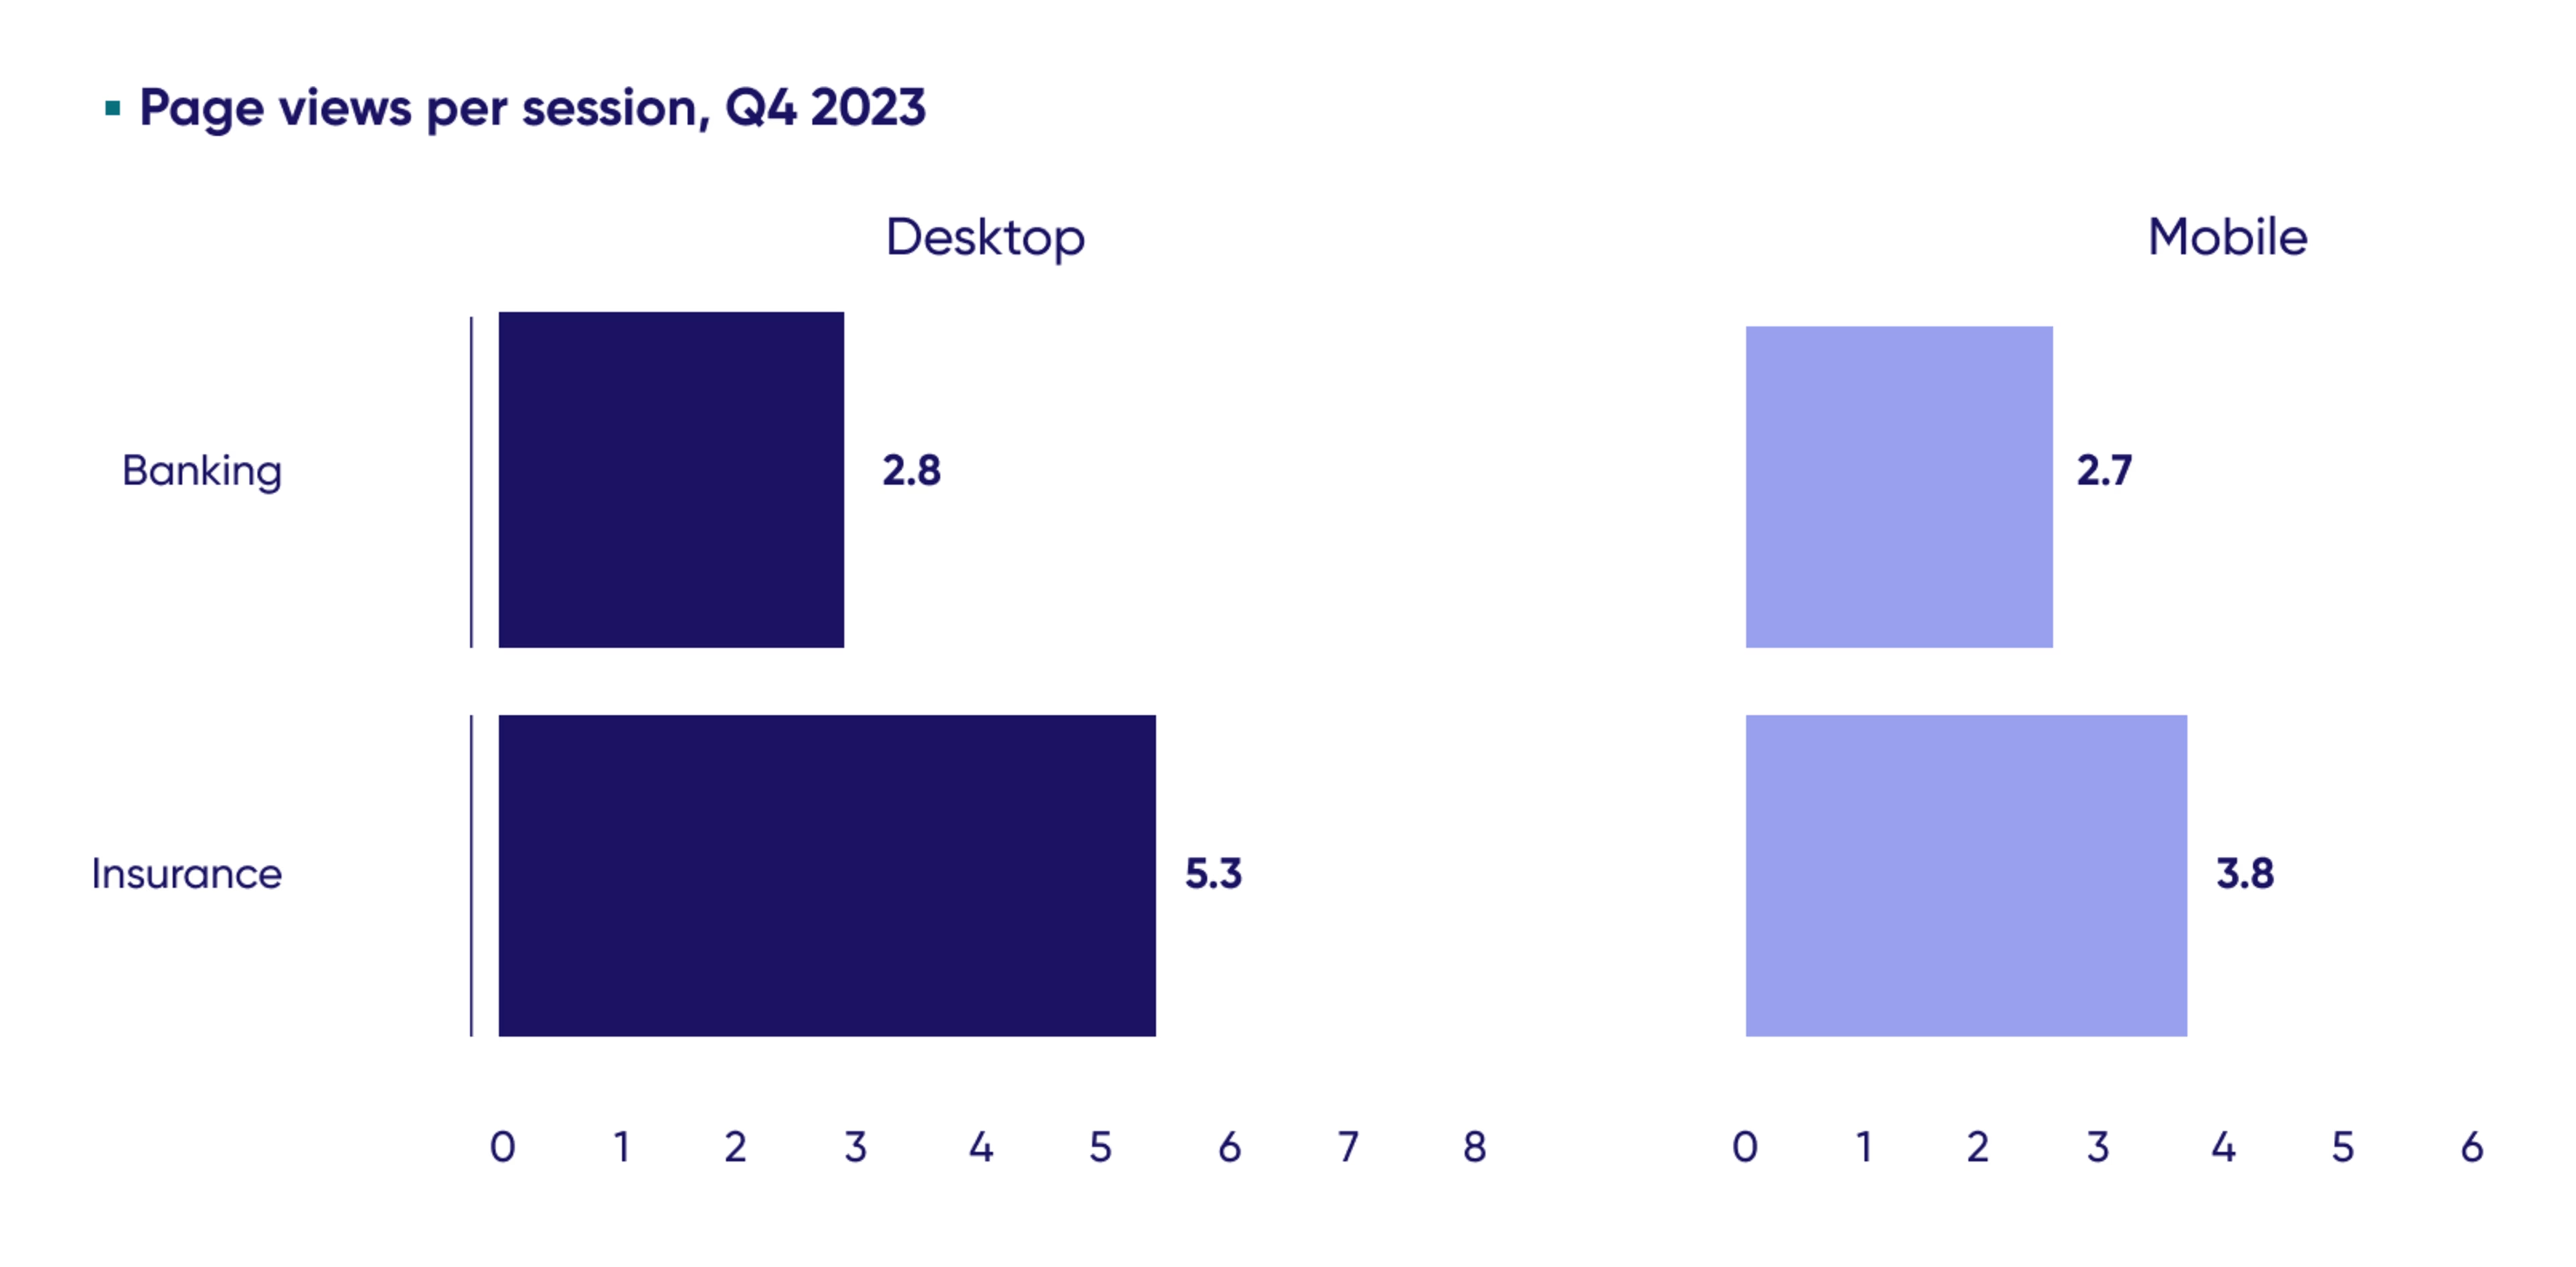
Banking had the shortest end of the stick, with visitors viewing approximately one less page per session on mobile web (2.7) compared to insurance (3.8).
But that's not all: mobile web visits also bring more bounces.
Mobile web visitors still struggled to continue their journey—and smaller screens saw a +15.2% higher bounce rate compared to desktop.
The good news is that across FinServ, bounce rates declined overall by -0.95% YoY, from 52.7% to 52.2%.
As mobile experiences continue to result in more one-and-done visits and lag behind desktop experiences when it comes to consumption, FinServ firms need to optimize their digital journeys across all devices and platforms—whether mobile web, desktop or app.
This is especially important as traffic was split evenly across desktop and mobile for the first time ever last year, with mobile increasing from 47.7% in 2022 to 50.1% in 2023.
3. Increased frustration was fueled by performance issues
In 2023, moments of friction remained an all-too-common feature of customer journeys for financial services firms, growing +9.6% YoY (34.2% in 2022 vs 37.5% in 2023).
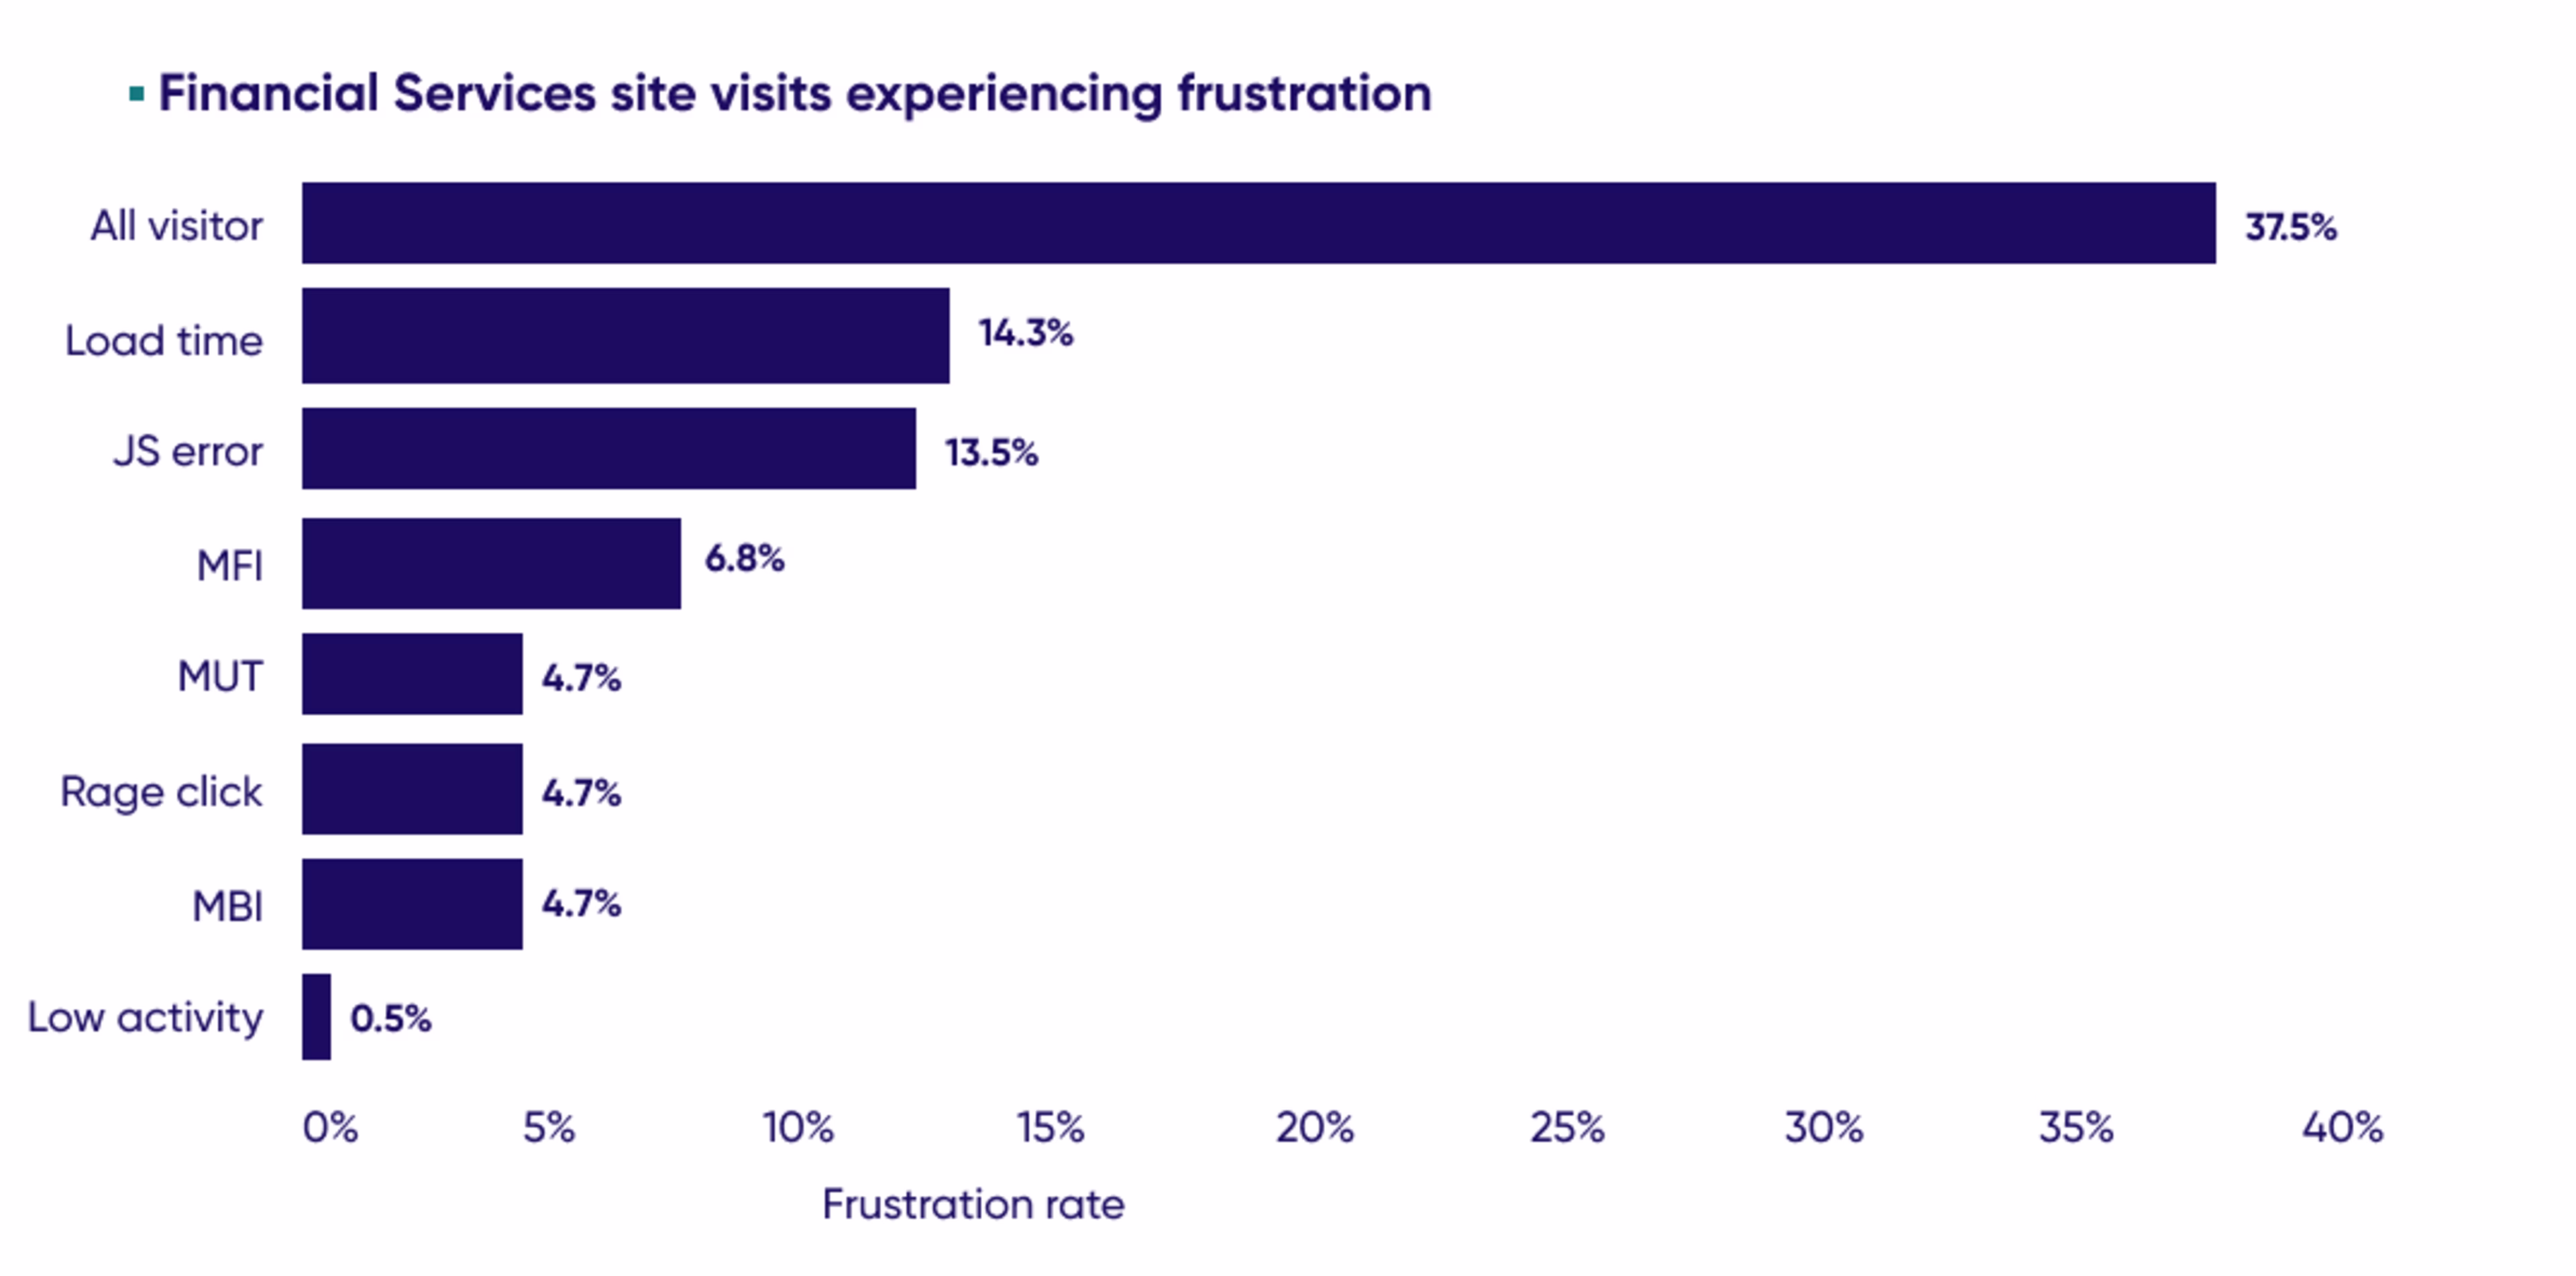
The graph above shows the top seven frustration factors across FinServ, which create obstacles along the customer journey and can sour an experience:
Slow page loads
JS errors
Multiple field interactions (MFI)
Multiple use targets (MUT)
Rage clicks
Multiple button clicks (MBI)
Low activity rate
Nearly 2 in 5 visitors experienced frustration in 2023, with slow load speed reigning as the top friction factor across FinServ. When comparing the two sectors, visitors navigating banking sites experienced +21.3% more frustration than those on insurance sites (41.6% vs 34.3%).
This may be because Banking had JavaScript errors that caused the most frustration. Fortunately, these errors are hidden and aren't often noticed by users, meaning they have minimal impact on the user experience.
To counteract the top cause of user frustration—slow page load—banking and insurance teams need to focus on meeting performance standards defined by Google's Core Web Vitals, so they can optimize the customer experience and avoid being penalized with a low search ranking.
But performance is far from the only problem. Frustration takes many forms and can flare up anywhere in the journey, impacting customer retention and satisfaction.
Use Digital Experience Monitoring to easily identify frustration wherever it appears, prioritize the most business-impacting issues, and rapidly discover the root causes—fast.
Get more insights into consumer behavior in financial services to elevate your digital experience
Equipped just with this data, you'll make many improvements to your Financial Services customer experience and digital strategy.
And luckily for you, we've got plenty more where that came from!
Dive into our 2024 Digital Experience Benchmark Report and Explorer to start picking up the insights that'll inform your digital strategy and improve your experience throughout 2024—and beyond.
![[Visual] Nea Bjorkqvist](http://images.ctfassets.net/gwbpo1m641r7/wtkAGoygaIfkRoTAbsygD/fc81bb8c1d017eebe8cc37129cb1f517/T027K0ZC9-U02N5UPR11R-68a6da458604-512.png?w=1080&q=100&fit=fill&fm=avif)
Nea is the Global Campaigns and Customer Content Lead at Contentsquare, based in London. With over seven years of experience in the SaaS industry, she’s passionate about creating engaging, compelling B2B content that drives traffic and conversions. Despite living in a big city, she loves nature and spends most weekends hiking in the countryside.