![[Visual] Stock - Happy user with coffee and phone](http://images.ctfassets.net/gwbpo1m641r7/5ubAy1D2BjSqaiT4Lz3sEP/2ea71cab72d252ee96b2d592f7e26ac5/AdobeStock_248831473.png?w=3840&q=100&fit=fill&fm=avif)
In the Travel & Hospitality (T&H) industry, the journey begins online, shaping the experience long before a customer boards a plane or checks into a hotel. Today's travelers expect every digital touchpoint to be seamless, intuitive, and memorable. But with conversion rates under pressure, brands need smarter ways to turn browsing into bookings.
This article will help you navigate this evolving landscape and show how Contentsquare’s insights and capabilities can maximize your digital potential.
Key conversion data points in Travel & Hospitality
Contentsquare’s 2026 Digital Experience Benchmarks report offers a comprehensive look at key trends affecting the digital customer experience in the T&H industry:
While overall T&H conversion declined -6.8% YoY, some individual sub-industries saw generally positive performance — Travel Agencies & Services (+18.5%) and Travel & Transportation (+13.4%) saw strong gains while Entertainment & Restaurants held steady with modest growth (+2.3%), and only Hotels, Resorts & Cruiselines mirrored the overall negative trend (-3.3%).
Mobile conversions saw a -4.1% drop YoY compared to -8.0% on desktop, suggesting that mobile-first experiences are becoming increasingly critical for T&H brands looking to protect conversion
Both new and returning visitors converted less in T&H, but new visitors were hit harder (-7.3% vs. -6.2% for returning visitors), indicating that T&H brands are struggling more with first impressions
Revenue per visit in T&H ended 2025 on a high, reaching $9.42 in Q4 — the strongest quarter in the period tracked — after a mid-year dip to $8.75 in Q2 2025, suggesting a seasonal recovery pattern with peak booking periods driving a strong year-end finish
![[Image] Benchmarks T&H conversions](http://images.ctfassets.net/gwbpo1m641r7/7kb9x2WGFPP8FCIWA2sBal/41c40e4e3aa8c6ca40fab92e5bd21620/contentsquare__conversion-rate---by-device_travel--hospitality__2_.png?w=1200&q=100&fit=fill&fm=avif)
How Contentsquare helps turn browsers into bookers
The T&H industry faces a dynamic digital environment. While traffic remains robust, converting visitors, especially new ones, has become more challenging. In order to deliver a seamless customer experience that converts, you need to understand precisely what drives users and why they might be abandoning their journey.
Here are 4 key ways you can use Contentsquare’s experience intelligence platform to drive conversion rates:
1. Optimizing traffic & first impressions
The way visitors arrive at your site significantly influences their expectations and where they’re at in their booking journey. To increase conversions, you need to adapt the experience to match their intent.
Analyze acquisition segments: Contentsquare's Acquisition Analysis capability shows you how users reach your site and which channels perform best. You can easily see how different acquisition sources correlate with journey success, enabling you to optimize your budget allocation.
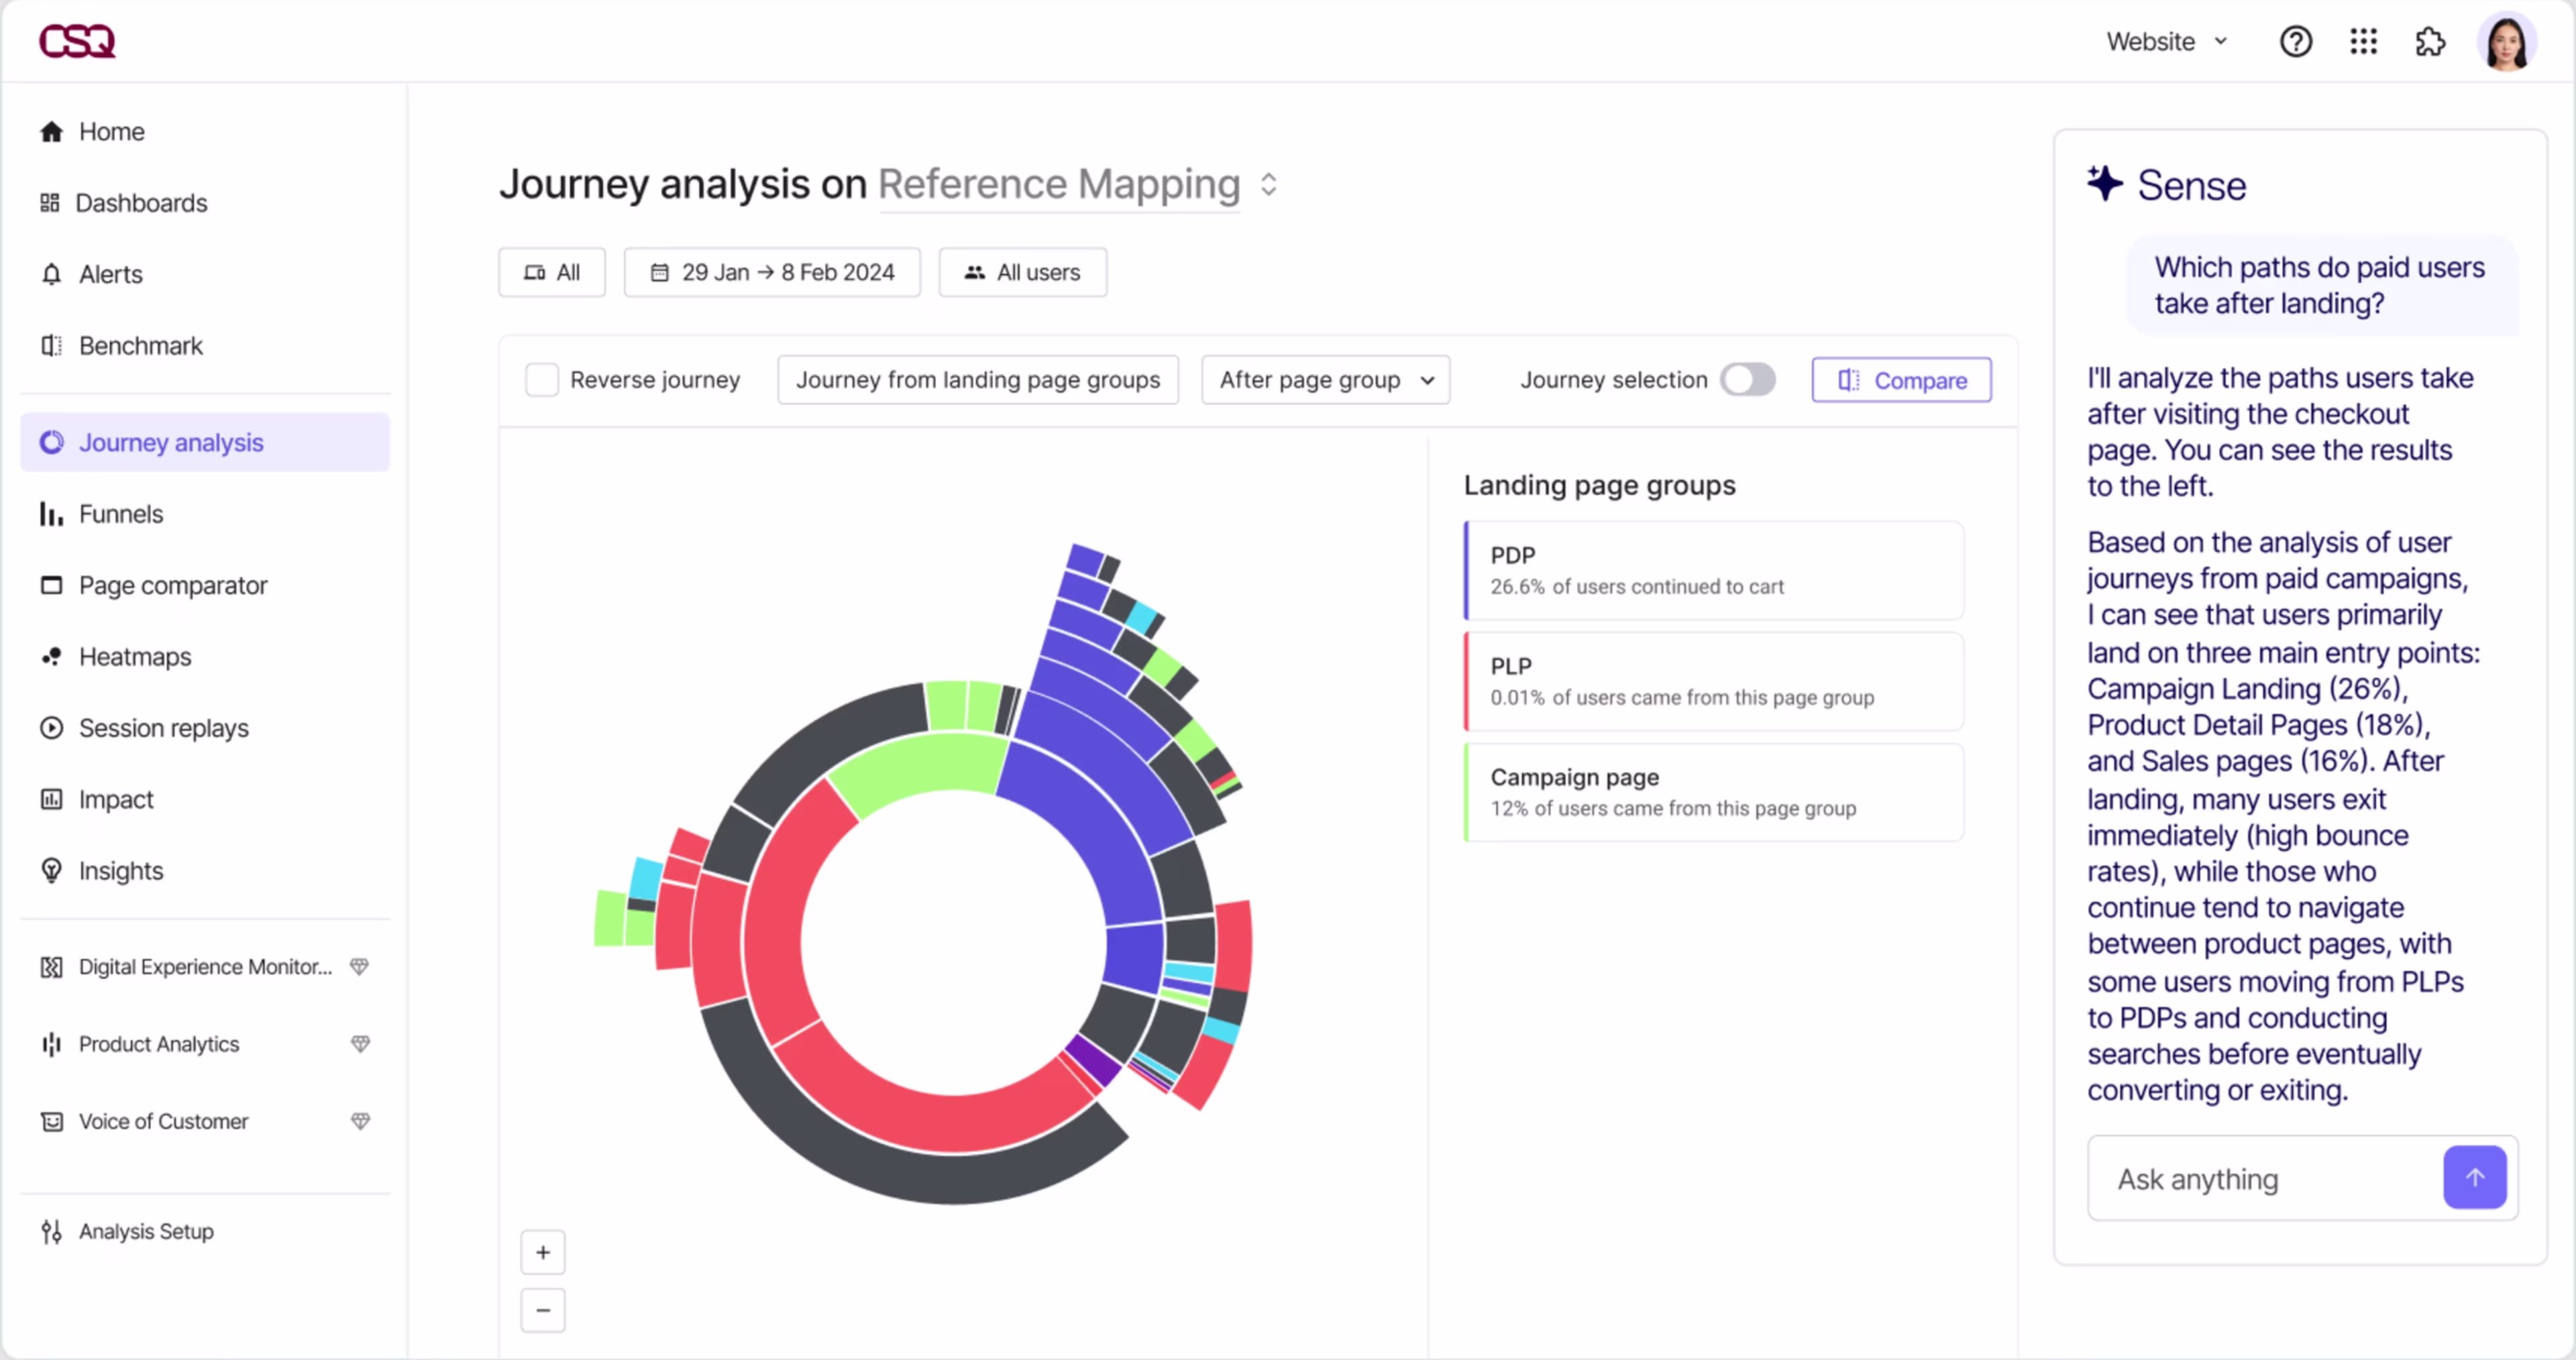
Spot friction points early: don't wait to find out where your users are getting stuck. The platform’s Journey Analysis capability gives you a big-picture view of the entire customer journey, so you can see where people get stuck or drop off. With the Advanced Journey Analytics capability, you can examine longer journeys, where travelers switch devices or engage in multiple sessions before converting. By studying these real journeys, you’ll find the exact spots where the booking process is breaking down and make changes that lead to more conversions.
For a deeper dive, the platform’s Session Replay capability uncovers the exact reasons for drop-offs, letting you see exactly what users experienced as they moved through your site. This helps find hidden problems like broken calendars, payment errors, or confusing seat maps that cause people to leave without booking. Want to know more about how Session Replays can help boost your conversions? Take a look at this comprehensive guide.
💡Pro tip: use Contentsquare’s AI Session Replay Summaries to get summaries of user behaviour patterns across one or multiple sessions in seconds.
![[Visual] Session replays AI summaries](http://images.ctfassets.net/gwbpo1m641r7/513RGRBy7acZFtxrrMg1cE/7f6851e3d8f3c4ca804c3e8cde0f847a/Session_replays_summaries.png?w=3840&q=100&fit=fill&fm=avif)
Understand content visibility and engagement: Use the platform’s Heatmaps capability to see exactly how visitors interact with your site at page level, making it easy to know what’s working, and what’s not. Here are a few Heatmaps features to create more intuitive and personalized experiences for travelers.
Click maps reveal where users click most, showing whether your booking buttons get enough attention or whether people are trying to click on non-interactive images
Rage click maps are a crucial indicator of frustration, detecting repeated clicks in the same spot. This is key for finding broken booking buttons or confusing payment forms that cause travelers to abandon their purchase.
Scroll maps show how far down a page users go. They help you ensure important details like pricing and amenities are placed high enough to always be seen.
Move maps track mouse movement to reveal a user's focus and identify confusing areas on a page
Directly tie page elements to conversions: zone-based heatmaps go beyond basic clicks to show how different page elements, like a promotional banner or a booking widget, contribute to conversions and revenue. This provides a clear picture of what's performing best and where you should focus your optimization efforts.
![[Visual] website monitoring Heatmaps & Engagements](http://images.ctfassets.net/gwbpo1m641r7/zSEt2fD70YN0KvCJ6Aycj/31e98fd778c4cc54879e524d717f5c91/Heatmaps___Engagements__3_.png?w=2048&q=100&fit=fill&fm=avif)
⚡️Success story: how Heatmaps analysis helped Thalys boost conversions
Leading railway operator Thalys (now Eurostar) wanted to ensure a seamless experience for their customers across their digital channels. The digital performance team turned to Contentsquare for help, using Heatmaps to discover a poorly placed promotional banner had a very low exposure and click rate.
They shifted the promotional banner higher up the page and removed some confusing messaging on one of their payment pages, which resulted in a +500% increase in its conversion rate, from 2.9% to 17.4%.
Read the full case study here
2. Engaging mobile users and streamlining journeys
Travelers are increasingly using their phones for research, bookings, and check-ins. While mobile traffic and engagement are soaring, desktop still leads in conversion rates. This presents a significant opportunity to boost mobile conversions by making early discovery as seamless as possible.
Optimize for mobile-first engagement: use mobile app heatmaps to see how users interact with your site. This visual data helps you optimize key elements like search filters, booking buttons, and payment forms, leading to a smoother experience and more conversions.
![[Visual] heatmaps on mobile](http://images.ctfassets.net/gwbpo1m641r7/32yEW2WJgxBgUDBm9n9BD3/fc91967812cf3fb773deff3999b6bf53/heatmaps_on_mobile.jpg?w=1920&q=100&fit=fill&fm=avif)
If a Heatmap shows a lot of frustrated clicks on a booking button, you can use Session Replay to see exactly what's going wrong. For example, you might discover the button is broken, loads too slowly, or gives a confusing error message. This combination lets you see how many people are affected by the problem and why they're struggling, so you can quickly fix the most important issues.
Understanding the full customer journey: use the User Lifecycle Extension for Contentsquare’s Experience Analytics product to see which content drives long-term value, like repeat purchases and loyalty, across multiple visits and devices. It’s particularly powerful for T&H sites because travel purchases are inherently multi-session journeys. Most travelers research destinations, compare prices, check reviews, and return multiple times across different devices before booking.
You can also use Journey Analysis to track user paths over time and see which parts of your site encourage healthy exits, helping you optimize the entire traveler's journey, not just a single session.
⚡️Success story: how experimentation helped Forge Holiday Group boost checkout completion by +5.3%
Forge Holiday Group had noticed some issues with one of their partner brand’s websites, Forest Holidays. Using Contentsquare’s Experience Analytics, they discovered an issue with the last step of their checkout page–customers were dropping off before purchasing.
They ran 3 A/B tests and used Heatmaps to determine the impact of certain changes to the checkout page. With just a few minor adjustments to the user experience (UX), they eased the customer journey and noticed a +5.3% rise in checkout funnel completion.
Read the full case study here
3. Eradicating frustration for smoother conversions
Travel & Hospitality experiences still suffer from high digital frustration rates, impacting nearly half of all site visits. Small annoyances like rage clicks, slow page loads, and JavaScript errors can quickly add up, driving users away. Identifying and proactively addressing these pain points is crucial for improving conversion.
![[Visual] 2025 digital experience benchmarks](http://images.ctfassets.net/gwbpo1m641r7/5zYRehCueGvbSFxZChFzau/18f3f38b53035b61722f8122084b3148/2025_digital_experience_benchmarks.jpg?w=1920&q=100&fit=fill&fm=avif)
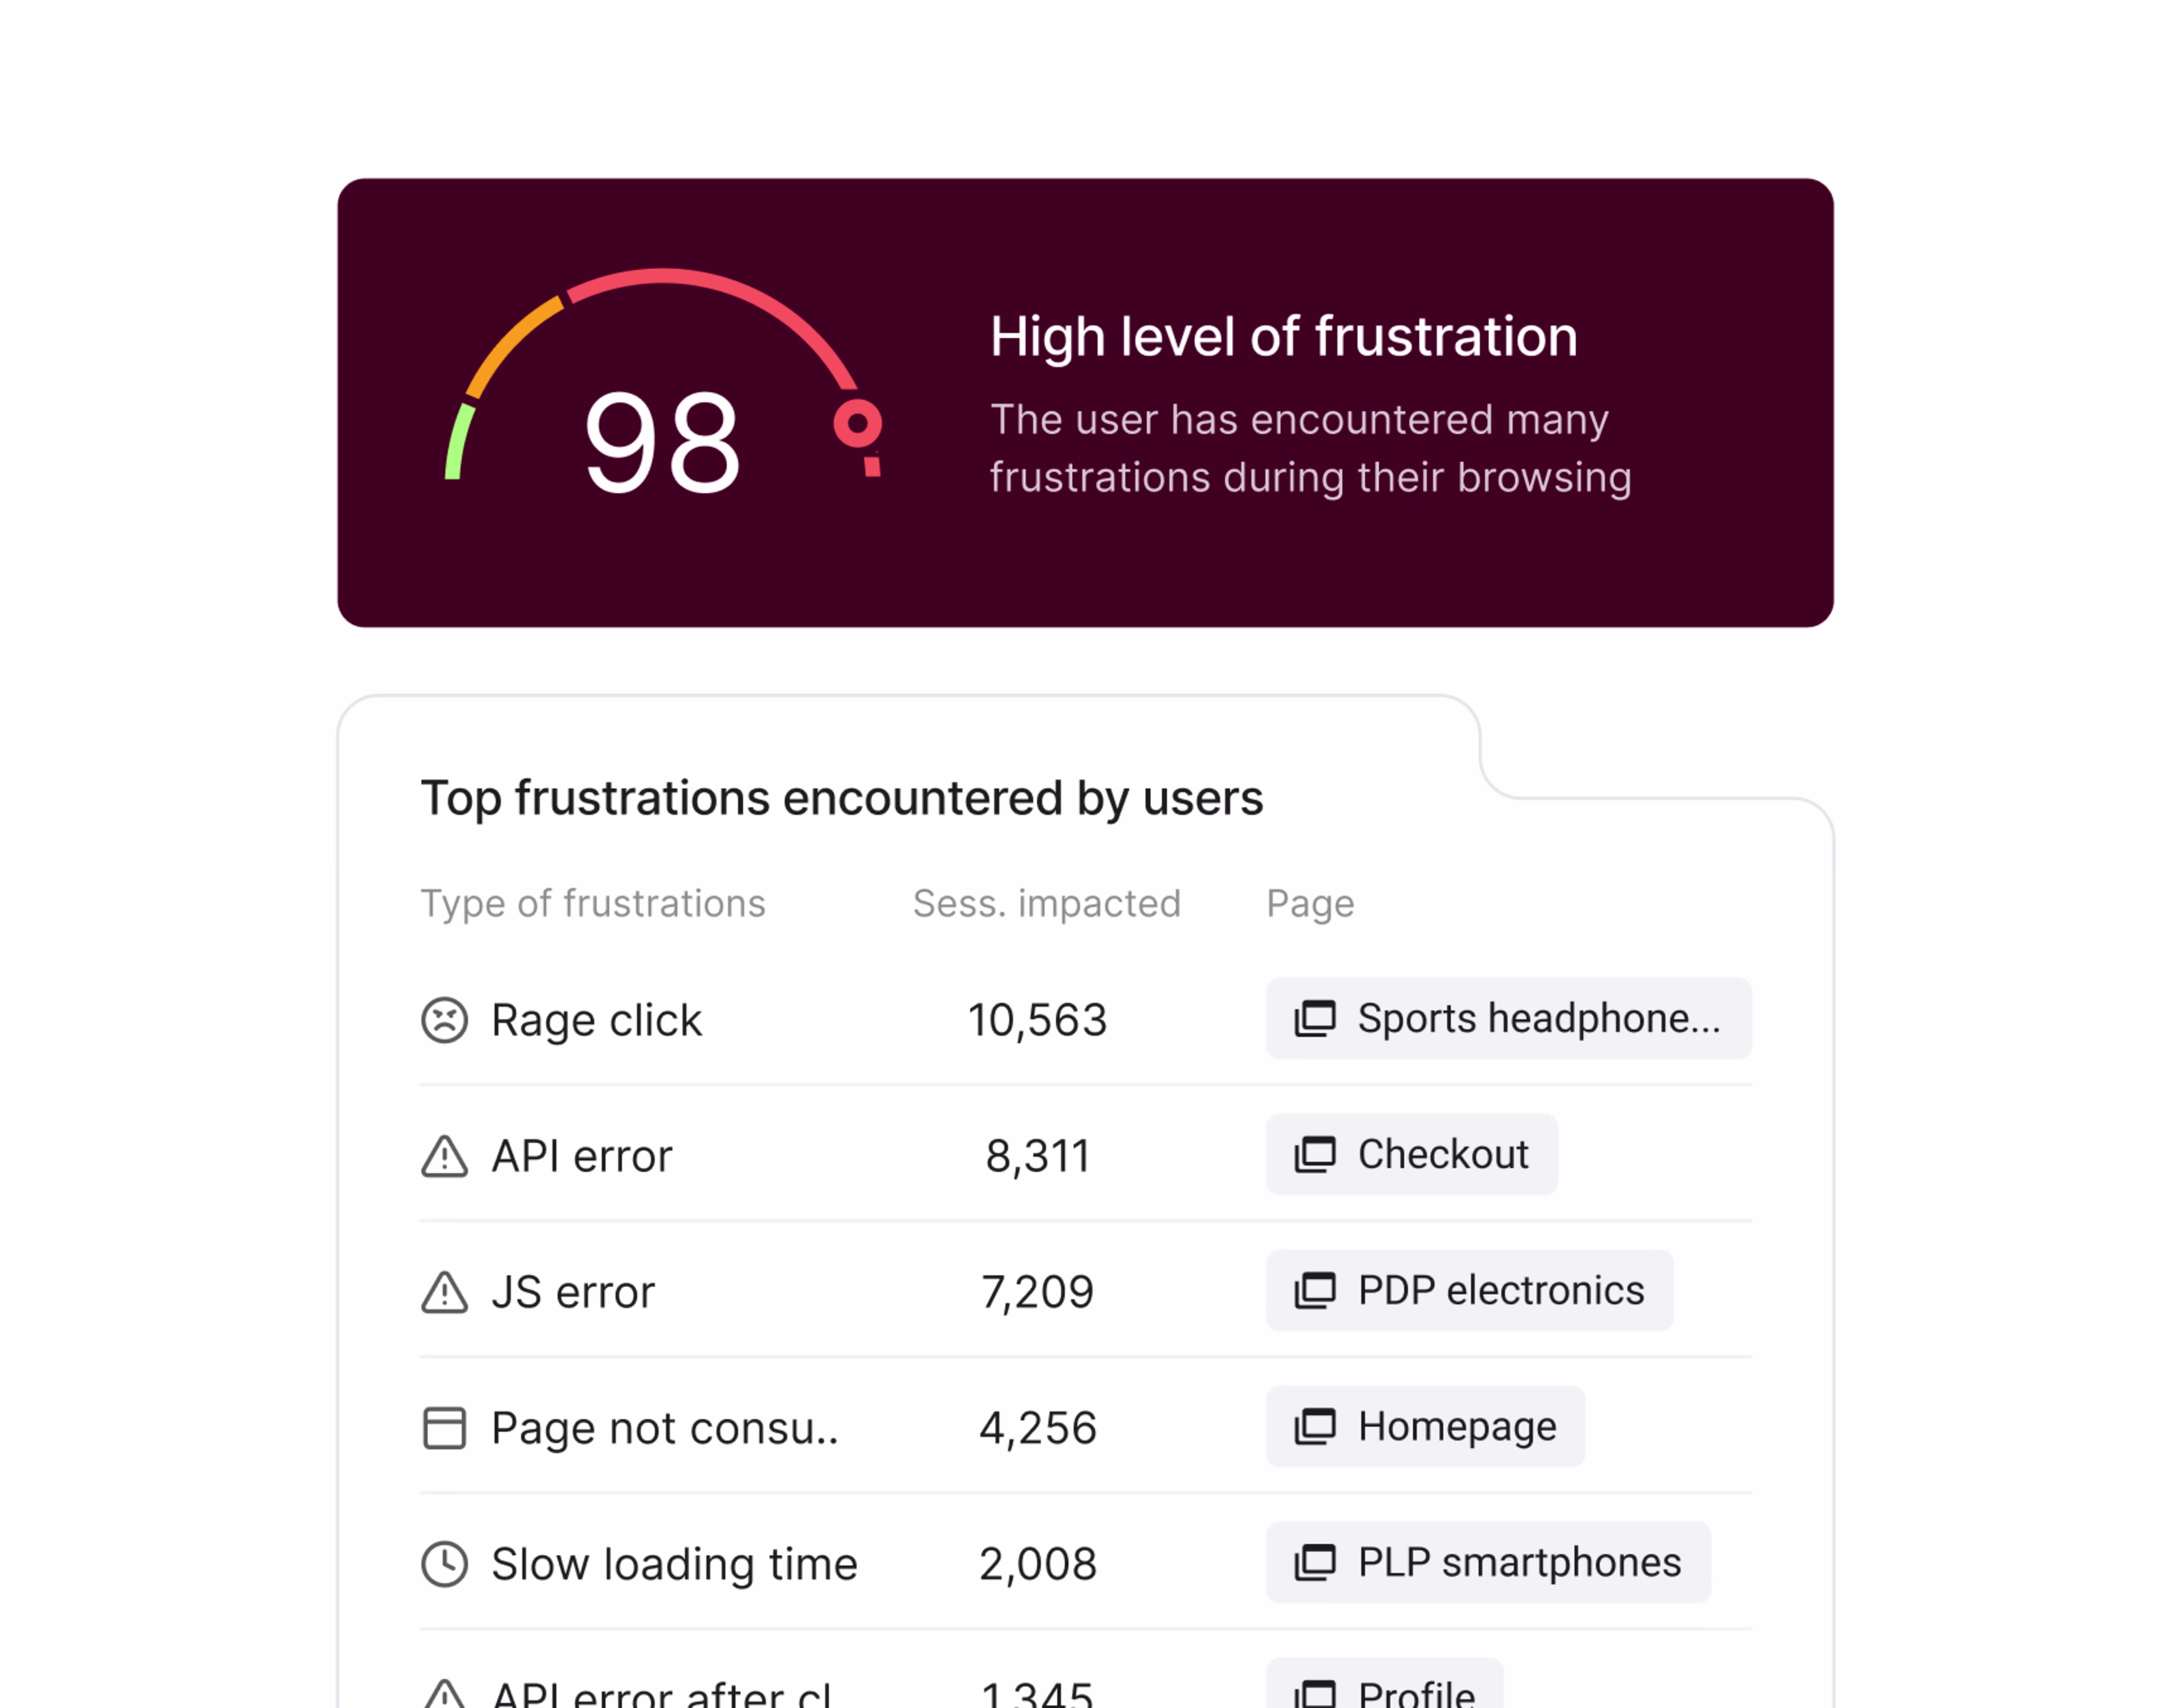
Surface frustration points fast: Contentsquare’s frustration score feature uses the platform’s AI, Sense, to measure how difficult a website is for users. It gives each user's experience a score from 1 to 100. To calculate the score, it automatically looks for signs of frustration, like:
Rage clicks: when someone repeatedly clicks the same spot
Loading delays: when a page or element is slow to load
Form struggles: when a user has trouble filling out a form
Excessive hovers: when a user hovers their mouse over a spot repeatedly, looking for a link
Technical errors: JavaScript and API errors that break functionality
A higher score means the user is more frustrated. This helps you quickly find the biggest problems on your site so you can fix them.
Find technical issues behind the frustration: Contentsquare's Error Analysis capability works alongside the frustration score to identify technical problems causing user struggles. It automatically detects JavaScript errors, API failures, and broken functionality then shows you which errors are actually impacting user behavior and conversions. This means you can prioritize fixing the technical issues that matter most to your business, not just the ones that appear most frequently in logs.
![[Visual] Error analysis](http://images.ctfassets.net/gwbpo1m641r7/6ELBPV051gA5ePLDZOiFEG/8352c504a71e140b84d4b0587b2c446c/eyJwYXRoIjoiY29udGVudHNxdWFyZVwvZmlsZVwvZHVGZlF4bWVzMjU0WGhkNXExOXcucG5nIn0_contentsquare_-5dJe5Xqp6vEwH1Gl8wqmZQXmHHT4auNG_.png?w=3840&q=100&fit=fill&fm=avif)
You can use both tools across different capabilities within the Contentsquare platform, such as Session Replays, to see exactly how technical problems translate into user frustration and lost bookings.
After 16 days, this small fix saved us £1.2K. This amounts to an annual saving of over £27k, showing the benefits of resolving an error which could easily have gone unnoticed for much longer.
Catch conversion-harming errors: Set up real-time alerts to easily find JavaScript, API, and custom errors affecting your conversions and revenue. From there, jump directly into related Session Replays to see what users saw, prioritize fixes, and create tickets with confidence.
![[Visual] errors](http://images.ctfassets.net/gwbpo1m641r7/60G8fySCZX0Sv9H7i4o6yM/72ea6c32d82a2705bbaa954eaedf1886/errors.png?w=1920&q=100&fit=fill&fm=avif)
4. Deepening user understanding with AI
To truly excel, you need to connect what your users do with what they say. By leveraging AI and direct feedback, you can uncover the why behind user behavior, anticipate needs, and proactively optimize for conversion.
AI-powered insights: Sense, Contentsquare's AI agent, transforms your data analysis. You can simply Chat with Sense in natural language, and it’ll surface insights in minutes, even recommending what to look into next.
It connects data from across products, devices, and sessions, providing clear recommendations. Sense can diagnose checkout drop-offs, understand Net Promoter® Score dips, chart behavior patterns in app versions, and fuel product decisions with AI-backed insights.
Sense can:
Generate surveys instantly: Sense helps you create surveys fast.Type your goal in natural language and watch it create appropriate survey questions specifically for your goal, significantly reducing creation time.
Fast-track user feedback analysis: Sense can summarize up to 2,000 survey responses into an in-depth report, spotting trends, categorizing by sentiment, and prioritizing what to focus on. This allows you to gain insights from feedback much more efficiently.
Capture feedback at critical moments: use Voice-of-Customer (VoC) features like exit-intent surveys to ask users why they’re leaving, or deploy NPS® surveys to measure customer loyalty and happiness after key interactions. You can seamlessly connect survey responses to Session Replays to get more context and understand the exact experience a user is referring to.
![[Visual] Net promoter score 64](http://images.ctfassets.net/gwbpo1m641r7/6JlD9s1Cx2CnpXsRYI4vLP/9963a1e5e87a4150c827cc5c032d34aa/image2.png?w=3840&q=100&fit=fill&fm=avif)
Unlock deeper data connections: With Contentsquare’s Data Connect capability, you can automatically export behavioral, performance, and error data to your own data warehouse. This allows you to blend Contentsquare insights with data from other tools, fueling external machine learning models for advanced analytics like churn prediction and personalization. This ensures you have a comprehensive, unified view of customer behavior over time and across devices.
Your next move: Transform digital journeys
Increasing conversions on Travel & Hospitality sites is an ongoing journey of attracting the right traffic, keeping visitors engaged, reducing frustration, and understanding their needs to foster loyalty. Contentsquare's all-in-one experience intelligence platform empowers you to achieve this. From immersive visualizations to AI-powered insights, Contentsquare provides the tools to deepen your understanding of discerning travelers and turn those insights into tangible business outcomes.
![[Visual] Contentsquare's Content Team](http://images.ctfassets.net/gwbpo1m641r7/3IVEUbRzFIoC9mf5EJ2qHY/f25ccd2131dfd63f5c63b5b92cc4ba20/Copy_of_Copy_of_BLOG-icp-8117438.jpeg?w=1920&q=100&fit=fill&fm=avif)