![[Visual] [Guide] Customer retention - Saas Stock image](http://images.ctfassets.net/gwbpo1m641r7/2Lmp9XhnD3Za2Q7fDglUJB/635404b1e617e2aa950703f719c0f0fa/Woman_with_Curly_Hair_Using_Tablet_on_Couch_Indoors.jpg?w=3840&q=100&fit=fill&fm=avif)
Building a successful SaaS product isn’t just about acquiring users; it’s about keeping them.
The path to higher customer retention starts with 2 critical milestones: activation and adoption. These are the moments when users first experience your product’s value and begin to incorporate it into their routine.
In this article, we break down the most important activation and adoption metrics, explain how they drive retention, and show you practical strategies to optimize them all.
Whether you’re struggling with onboarding or feature engagement, by the end, you’ll have a clear strategy to keep users coming back for more and, ultimately, grow your SaaS business.
Summary
For SaaS businesses, activation and adoption are crucial because they’re windows into how users experience your product; activation gets users in the door, and adoption keeps them there. Getting users to discover your product’s value and consistently return to use it means driving retention, which then helps improve some of your most important SaaS KPIs: monthly recurring revenue (MRR), annual recurring revenue (ARR), and customer acquisition cost (CAC). The more users activate and adopt your product, the more likely they are to stick around, renew subscriptions, and—if you’re lucky—become advocates. Here’s how to use activation and adoption metrics to improve customer retention:
Grow your SaaS business with activation metrics: your activation rate, time to first value, and onboarding completion rate define how fast users get value from your product
Optimize activation: fix activation bottlenecks like complicated onboarding flows and watch your metrics soar
Keep users engaged with adoption metrics: your adoption rate and feature usage frequency show you exactly how consistently users return and interact with your product
Optimize adoption: make your product stickier and help users build a habit out of using your product
Plan your next steps: 5 actionable ways of using Contentsquare to get users to experience value faster and drive deeper engagement
3 key activation metrics to grow your SaaS business
Activation is that moment when everything clicks for the user—their ‘aha!’ moment. It’s when they first realize that your product isn’t just another tool, but something that’s going to solve a real problem for them. Maybe they’ve just completed their first task, sent their first email campaign, or synced your tool with another platform. Whatever it is, this is the moment they experience value.
The first step to SaaS growth is ensuring users activate—meaning they hit that critical point where your product solves their immediate problem. Delays or poor user experience (UX) will drive them away, but smooth, fast activation hooks them in.
Activation metrics measure how quickly and efficiently new users experience your product's core value. It’s all about that ‘aha!’ moment when a user understands how your software can solve their problem.
Here are the 3 most important activation metrics and how to use Contentsquare to track them, helping you turn new users into loyal customers.
Activation rate
What it is: the percentage of users who complete key actions that deliver your product's core value.
Why it matters: if a user doesn’t reach activation, they’re highly likely to churn. By improving your activation rate, you increase the odds of converting a user into a loyal customer.
How to calculate it:
Activation Rate = (Users who complete the activation event/ Total users who sign up) × 100
Example: for a project management tool, an activation event could be when a user creates their first project and invites a team member. If 500 users sign up in a month, and 250 of them complete this action, your activation rate would be
(250/500) × 100 = 50%
How Contentsquare helps: Contentsquare lets you track user behavior with experience analytics to identify exactly where in the onboarding flow users are dropping off. By pinpointing the friction points, you can optimize those areas to increase your activation rate.
A common mistake startup SaaS companies make is focusing too much on signups and not enough on activation. Yes, sign-ups are great for profitability, but without activation, they’re just empty numbers. This is why your growth team needs to look at activation rates.
Let’s take an example from the gaming industry: early on, companies were focused on downloads and registrations. But over time, they realized the only users with high lifetime value (LTV) were those who hit key activation moments—like completing a tutorial or winning their first game. In SaaS, it’s the same. Your most valuable users are the ones who hit their ‘aha!’ moment and start using your product regularly.
Contentsquare allows you to segment users based on behavior, so you can differentiate between those who sign up and those who activate. This way, you can focus your resources on users who are more likely to convert into long-term customers.
![[Visual] Contentsquare user segmentation](http://images.ctfassets.net/gwbpo1m641r7/7dMLsLtzhcM3uFGYWG9yrj/44975fedf7d176b9561cc587abf26fd3/unnamed__54___1_.png?w=1080&q=100&fit=fill&fm=avif)
Time to first value (TTFV)
What it is: the time it takes for a user to hit that ‘aha!’ moment after signing up.
Why it matters: in SaaS, speed is important. The quicker a user can see your product’s value, the less likely they are to abandon it. Having a long TTFV can result in drop-offs before users fully grasp what makes your product useful.
How to calculate it:
TTFV = Average time (in days or minutes) between user sign up and completion of the activation event
Example: if the average user takes 4 days to create their first project in a collaboration tool, and your goal is to reduce this to under 2, then this is an area to optimize.
How Contentsquare helps: Contentsquare’s Session Replay and Heatmaps give you a granular view of user behavior, showing where users hesitate or struggle during their initial interactions, helping you reduce friction and shorten your TTFV.
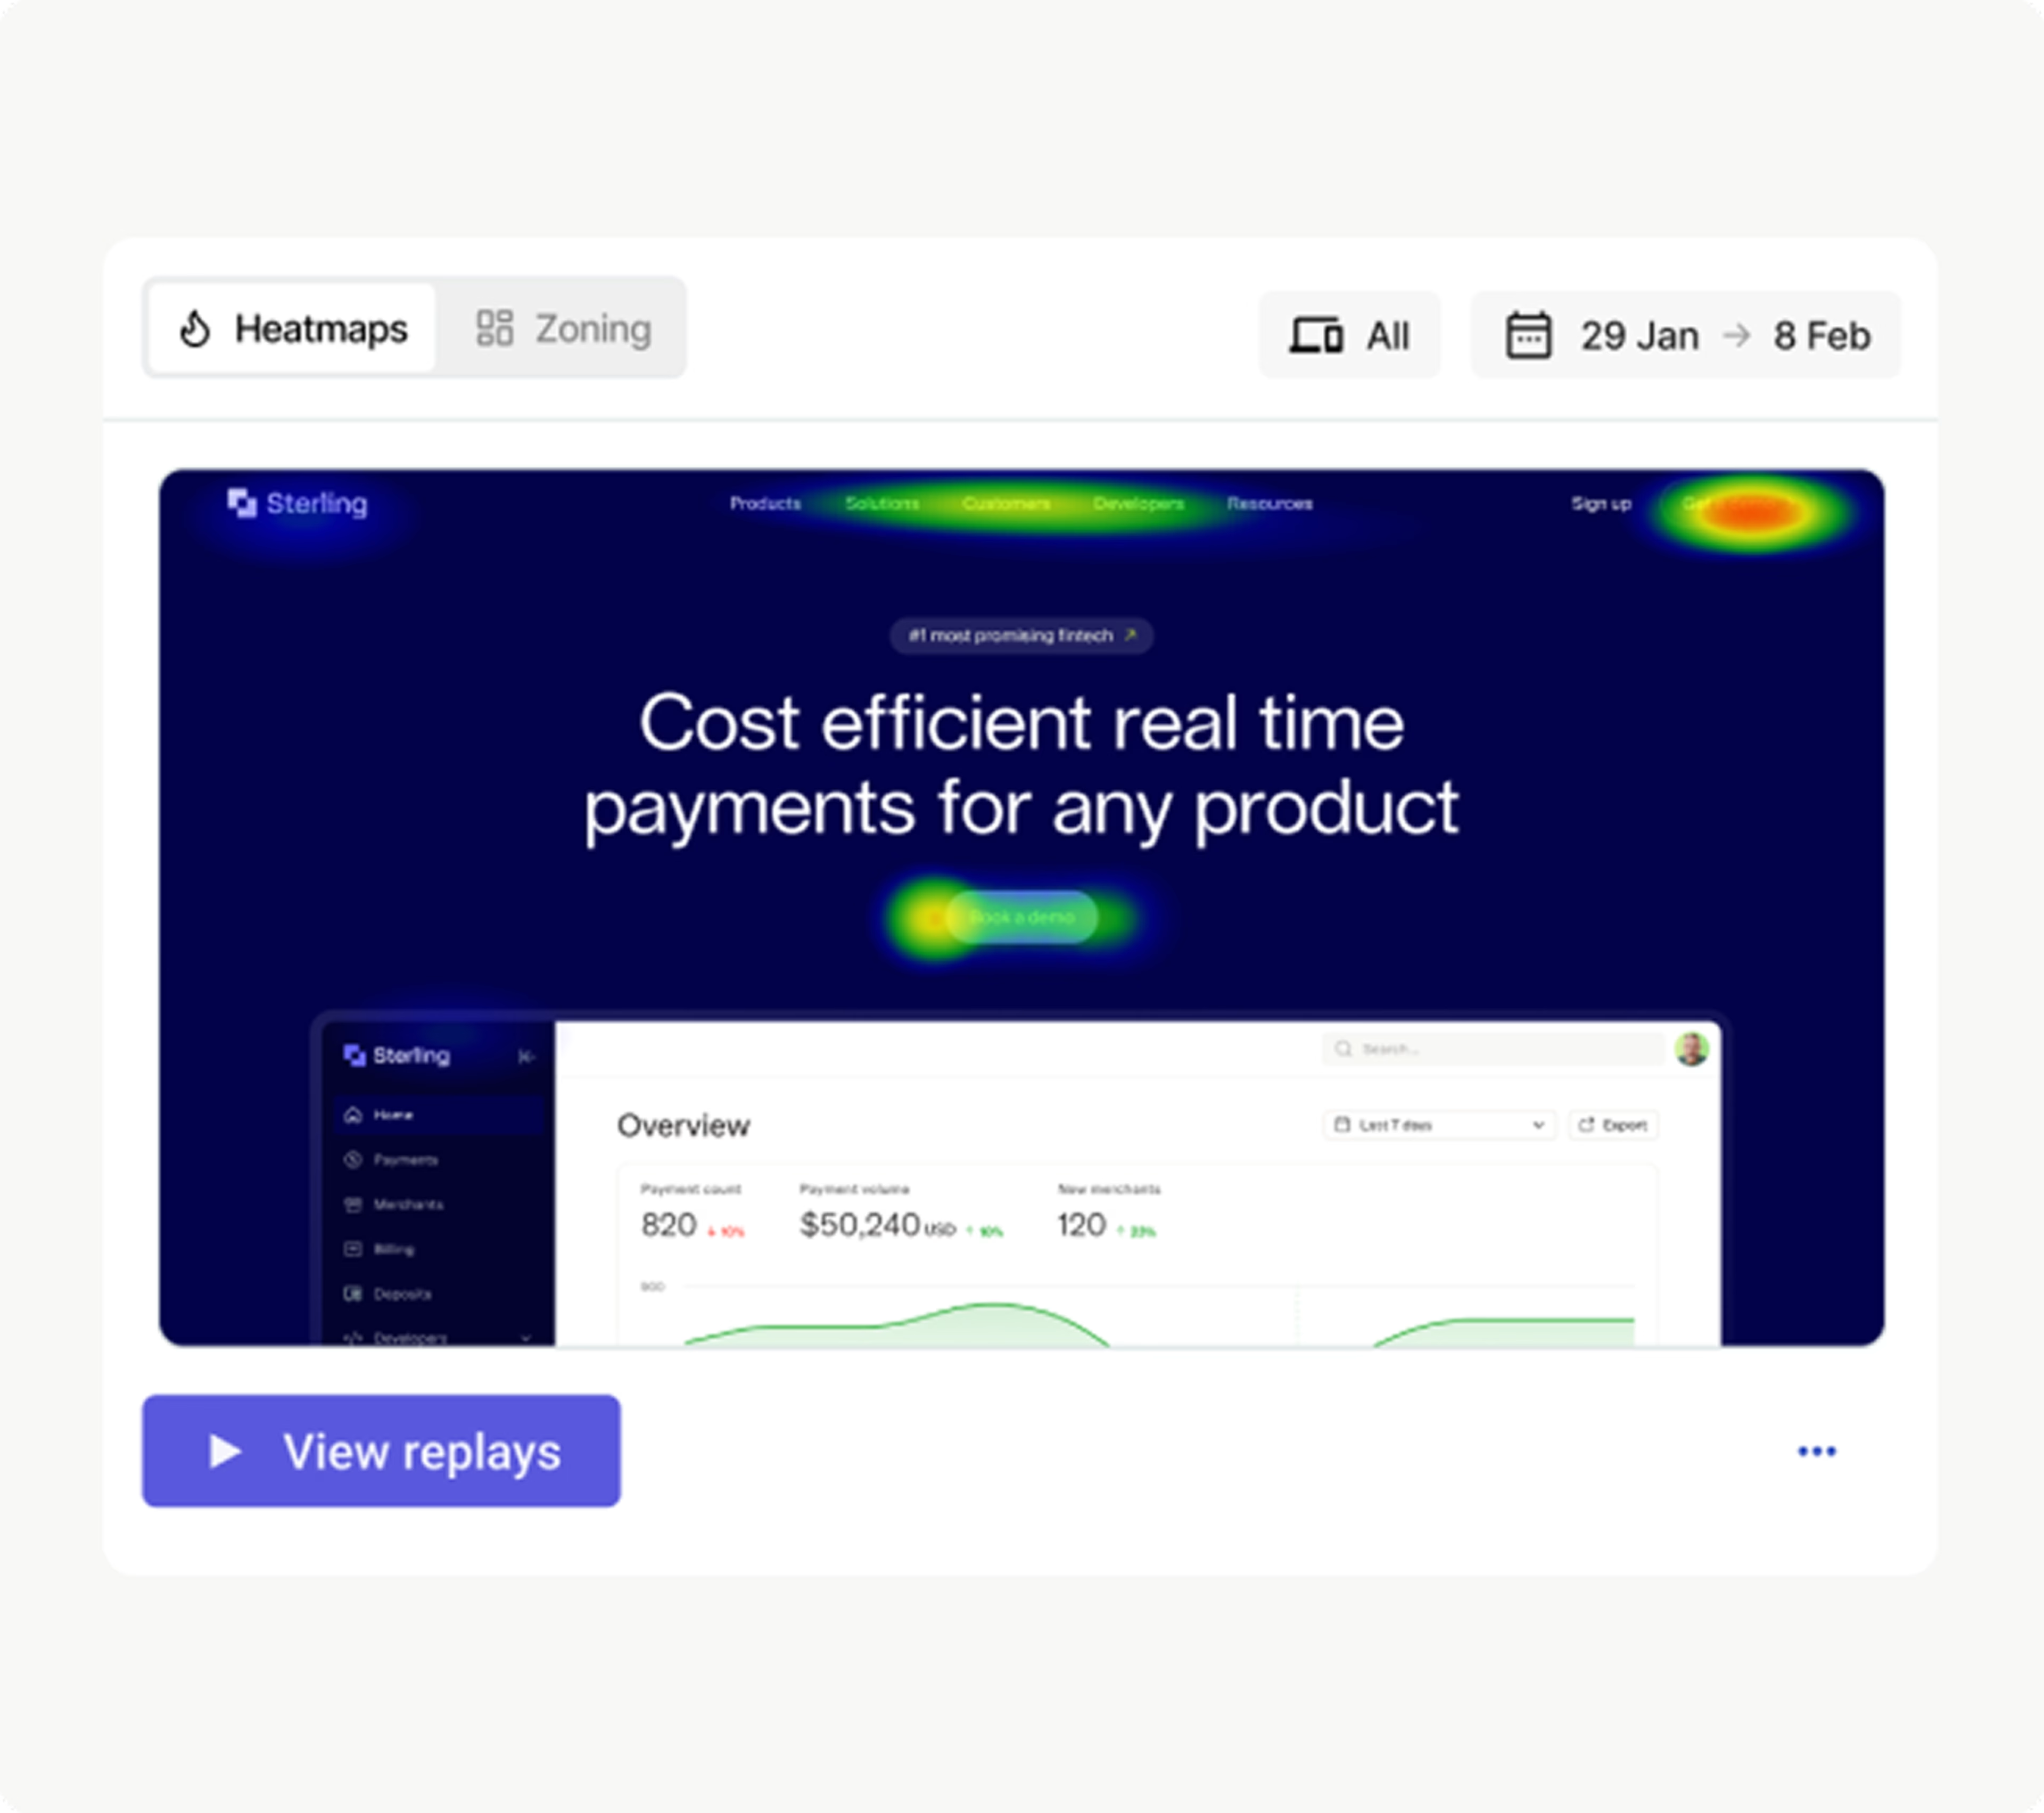
Watch See what your users did on-page with Heatmaps and then jump to related session replays to discover exactly how users behaved
Onboarding completion rate
What it is: how many users successfully complete the onboarding process and get to value quickly.
Why it matters: a strong onboarding process ensures users quickly see the value of your product, which is essential for improving both activation and long-term retention. Users who don’t complete onboarding are far more likely to churn early on.
How to calculate it:
Onboarding Completion Rate = (Users who complete onboarding/Total users who begin onboarding) × 100
Example: for a CRM tool, completing onboarding could mean setting up the first contact or integrating email. If 1,000 users start onboarding but only 600 finish, your onboarding completion rate would be
(600/1000) × 100 = 60%
How Contentsquare helps: Contentsquare’s Journey Analysis capability helps you visualize how users interact with your onboarding process. By analyzing user flows, you identify where drop-offs happen and make the necessary adjustments to bring them fully on board.
![[Customer story] alexanderwang - sense chat](http://images.ctfassets.net/gwbpo1m641r7/HqH1cqpCSnzUhkCdEBV72/96f2073d56800612fdd24485c360f24e/sensechat.webp?w=3840&q=100&fit=fill&fm=avif)
With Contentsquare’s AI, Sense, you can discover your biggest opportunities and frustrations within minutes
How to optimize activation
Once you know where your activation bottlenecks are, it’s time to iterate. You can
Refine the onboarding experience to guide users through key actions more effectively
Personalize onboarding flows to cater to different user segments, ensuring each user experiences value as quickly as possible
Test and measure small changes—from copy tweaks to user interface (UI) adjustments—to see what gets more users to experience value faster
💡Pro tip: if you’re not tracking these ‘aha!’ moments, you’re missing the opportunity to optimize them and your conversion rate.
Contentsquare helps you keep a close eye on how users interact with your product—from first click to full integration. If users are dropping off before completing critical steps, Contentsquare’s behavior analytics show you exactly where the friction is.
Use session replays and heatmaps to analyze user flows, scroll depths, and interaction behaviors. This helps you spot where confusion or frustration occurs during onboarding. Maybe there’s a confusing UI element, or perhaps a key feature isn’t highlighted enough.
Map out user journeys and pinpoint exactly where new users drop off before reaching activation. If users struggle with a button or skip a key feature, you’ll know exactly where to make improvements.
Spotting these pain points early lets you optimize your onboarding and get more users to that all-important moment of value. It’s not about making your product flashier; it’s about making it easier for users to see what’s already great about it.
![[Visual] zoning-analysis-in-Contentsquare](http://images.ctfassets.net/gwbpo1m641r7/1k0yJInevfgfOWMn7RN0EC/f5e0c306a7b58ce1a5582cf17e6a323d/zoning-analysis-in-Contentsquare.png?w=3840&q=100&fit=fill&fm=avif)
Contentsquare’s Heatmaps help you perform zoning analysis by examining different zones of a user interface
2 key adoption metrics to keep users engaged
Adoption is a long game. It’s not just about coming back once or twice—it’s about fully integrating your product into their workflow. Adoption is when users start exploring more features, using advanced tools, and, most importantly, depending on your product to get the job done.
Adoption metrics track how deeply and consistently users are engaging with your product over time. They go beyond one-time use and dive into how consistently users return and interact, helping you increase upsells.
For example, if you run a project management SaaS, your adoption metrics might show that your customer base loves your task creation feature but rarely uses your reporting tools. That insight gives you the direction to increase visibility around less-used features, or even rethink how they’re presented during onboarding.
Keep an eye on these 2 metrics to track key user behavior patterns
Adoption rate
What it is: the percentage of users actively using your product features after activation.
Why it matters: activation gets users in the door, but adoption drives deeper engagement. The more features a user adopts, the more likely they are to become habitual users. This metric directly correlates to retention, as users who adopt more features are less likely to become figures in your customer churn rate.
How to calculate it:
Adoption Rate = (Users who adopt a key feature/Total active users) × 100
Example: for a design software, adoption could be tracked by how many users start using advanced tools like collaboration or exporting. If 300 out of 1,000 active users use these advanced features, your adoption rate would be
(300/1000) × 100 = 30%
How Contentsquare helps: Product Analytics allows you to track feature adoption and see which parts of your product drive the most engagement (and which ones are being ignored.) By monitoring these metrics, you can optimize your product to encourage broader feature usage, and boost your adoption and growth rate.
Feature usage frequency
What it is: how often users engage with specific features of your product over a given period of time. This metric helps you understand which features users find valuable and which may need more visibility or improvement.
Why it matters: the more frequently users engage with your core features, the more embedded your product becomes in their daily workflow. It’s one of the most important SaaS metrics, because it signals strong product adoption and long-term retention. If paying customers aren't using key features regularly, they are more likely to churn.
How to calculate it: feature usage frequency is often calculated as the average number of times a user interacts with a specific feature over a set time period, like a week or month.
Feature usage frequency = Total interactions with feature/Number of users
Example: in a CRM software, you might track how often users create new contacts or generate reports. For example, if 500 users engage with your reporting feature 5,000 times in a month, the feature usage frequency is
5,000/500 = 10
This means each user is interacting with that feature an average of 10 times per month.
How Contentsquare helps: use product analytics dashboards to transform rows and rows of product usage data—every click, conversion, and churn event—into actionable and shareable charts, so you can focus on what matters and make informed decisions. And with out-of-the-box dashboard templates, monitoring SaaS analytics to see how often users interact with specific features gets even easier.
This data helps you make informed decisions on product updates or user education initiatives, ultimately increasing feature usage frequency and driving adoption.
Habit creation: the secret to retention
Adoption is all about building habits. Once users incorporate your product into their daily workflow, they become habitual users, increasing the likelihood of renewals.
For SaaS companies, it’s all about making your product sticky. The trick is to identify the key actions that lead to habit formation and guide users toward them. This could mean
Helping them discover new features with different marketing strategies, like email promotions
Sending personalized tips
Offering just-in-time support when they need it
Platforms like Contentsquare give you the power to track the behaviors that lead to habit creation. For example, if you’re managing a cybersecurity platform, customer journey data might point you to notice users who regularly set up new security alerts are the ones who renew their subscriptions or purchase upgrades.
You can use these data-driven insights to then send targeted emails or in-app messages that prompt other users to set up those alerts, leading to better customer engagement and retention.

Contentsquare’s user flow insights help create successful journeys that drive customer retention
How to optimize adoption
To increase adoption, you need to make your product stickier. Here’s how
In-app guidance: use pop-ups, tooltips, or step-by-step tutorials to encourage users to explore more advanced features
Behavior-based prompts: trigger personalized in-app messages based on user behavior, reminding them of underused features or nudging them toward more frequent engagement
Product callbacks: these notifications or emails remind users about features they haven’t used yet or alert them to new value, such as reporting updates or feature releases.
By surfacing your product’s hidden value and pushing users toward habitual use, you ensure they continue to find reasons to come back.
The retention formula that keeps customers coming back
At the heart of every subscription business is a simple formula:
Activation + Adoption = Retention
Retention is built on delivering continuous value—the more users activate and adopt your product, the longer they’ll stick around, and the higher your retention rates and total revenue will soar.
But to keep those users around, you need to track their behavior and adapt accordingly. You don’t just want average customer data—you want insights you can act on.
Contentsquare helps you track activation and adoption metrics that directly impact your retention rates. Are users dropping off after activation but before they truly adopt the product? Or are they adopting some features but completely ignoring others that would increase their stickiness?
Contentsquare lets you visualize the entire user journey, pinpoint where things are going right—or wrong—and adjust in real time to keep users engaged. Here’s how you can put these insights into action to boost retention in your SaaS business
Monitor and analyze user behavior: use Contentsquare’s Session Replays and Heatmaps to visualize how users navigate your platform during onboarding. Identify patterns that lead to successful activation, see where users struggle, and make data-driven changes to optimize activation points.
Shorten time to first value: look at your TTFV and ask: how quickly are users experiencing value? If it’s too long, shorten the onboarding process. Simplify workflows, reduce unnecessary steps, and guide users more effectively to that initial win.
Improve end-to-end journeys: use retention analysis to see the full picture of how users engage with your product, from one device to the next. By breaking down every step of their journey, you can personalize their experience when it matters most. And with accurate tracking, you’ll know exactly what’s working to boost conversions and retention.
Personalize engagement: Contentsquare helps you segment users based on their behavior and preferences. This lets you deliver personalized in-app experiences and guides, ensuring each user finds the features that are most relevant to them.
Custom reports and alerts: it’s one thing to track metrics, but it’s another to act on them in time. Contentsquare lets you set up custom reports and alerts so you’re notified when a key metric (like activation rate or feature adoption) takes a dip. This gives you the chance to address issues before they become full-blown retention problems.

Tracking and improving activation and adoption metrics is the key to increasing retention. By optimizing both stages of the user journey—helping users get to value faster and driving deeper engagement—you take the guesswork out of delivering excellent digital experiences that keep customers coming back. The data is there. Now, let’s use it.
Start tracking these key metrics today with Contentsquare, and you’ll be on the fast track to more growth for your SaaS business.
FAQs about SaaS growth metrics
Activation is that moment when everything clicks for the user—their ‘aha!’ moment. It’s when they first realize that your product isn’t just another tool, but something that’s going to solve a real problem for them. Maybe they’ve just completed their first task, sent their first email campaign, or synced your tool with another platform. Whatever it is, this is the moment they experience value.
Adoption, on the other hand, is the long game. It’s not just about coming back once or twice—it’s about fully integrating your product into their workflow. Adoption is when users start exploring more features, using advanced tools, and, most importantly, depending on your product to get the job done.
![[Author] Madalina Pandrea](http://images.ctfassets.net/gwbpo1m641r7/1CsEcp2v6jB6JAqrI9HDBa/76e37b242f67b2f063d657169afc559d/image.png?w=3840&q=100&fit=fill&fm=avif)