![[Visual] Group in office AdobeStock 747312086](http://images.ctfassets.net/gwbpo1m641r7/6tURvmFQ1htwwzllgOiHE9/99ca95cb8bde56d61c58478d472a8f07/AdobeStock_747312086.png?w=3840&q=100&fit=fill&fm=avif)
Customer journey mapping (CJM) software is a digital tool that collects and presents quantitative and qualitative data about how users interact with your product or website so you can better understand your buyer personas and ensure a delightful user experience (UX).
The more complicated the journey, the more data you’ll need to map it out. The right mix of CJM tools gives you data from multiple customer touchpoints and channels so you can collect as much information as possible to map your journey in detail.
Customers will interact differently with your site or app depending on what part of the journey they’re in. Since journey maps include everything from awareness—when a customer first sees your ad—to onboarding and using your product, the data you rely on to guide your map will vary at each stage.
This article walks you through three types of customer journey mapping software—website and experience analytics tools, voice of the customer tools, and data visualization and mapping tools—so you understand how each fits into your different workflow stages and can choose the right ones for your business.
Website and experience analytics tools for customer journey mapping
Analytics tools give you insight into who your customers are and how they behave on your website.
Traditional website analytics tools give you quantitative data, including traffic and demographic metrics like bounces and bounce rate, new and returning users, and goal conversion rates.
Behavior and experience analytics tools give you qualitative insights into how users actually experience your website and how they behave during their customer journey. These tools help you pinpoint where users spend time on individual pages, which buttons they click (or don’t), and where they exit from the funnel, so you can improve the user experience.
While traditional analytics tools tell you about the customer’s journey to your website, experience analytics tools show where their attention goes after they’ve arrived.
Quantitative and qualitative analytics tools work together to help you identify usability issues in your customer journey and highlight opportunities to improve the customer experience.
Here are two popular analytics tools used by marketing and UX professionals to help you kickstart your customer journey map.
1. Contentsquare
Contentsquare (hi there! 👋) is an all-in-one digital experience platform that provides insights into user behavior. It combines Experience Analytics, Experience Monitoring, Product Analytics, and Voice of Customer tools to give you a comprehensive overview of how users interact with your site at every stage of their journey—and how you can improve their experience.
Tools like Journeys reconstruct the path users take on your site, while Heatmaps and Session Replay show you how they behave along the way: where they click and scroll, where they get stuck, and the actions they take as they navigate from page to page.
Get aggregated visualizations of user engagement with heatmaps to reveal which page elements capture attention and which ones get overlooked (or worse, cause frustration)—then zoom in with session replays to watch exactly what happened.
![[Visual] Session player](http://images.ctfassets.net/gwbpo1m641r7/1eHjusC4SvD8W8zPa99nU5/c0092f4d1cb0246c0495c039f86e2885/image7__8_.png?w=3840&q=100&fit=fill&fm=avif)
Watch session replays to see how users navigate your site from beginning to end
We make much more informed decisions than we used to. With Contentsquare, you can get a good sense of what the customers are doing in a few clicks of a button. Bar brain implants in all of our consumers I don’t think there’s any way we could get a better understanding of it.
2. Google Analytics 4
Google Analytics 4 is a web analytics tool that tracks and measures website traffic metrics, like bounce and exit rates, goal conversions, sources of traffic, and user demographics.
GA4 tells you how much traffic your website gets, where it comes from, and which channels convert best. You can also see what your most popular landing pages are and where people are exiting from your website.
Pro tip: Google Analytics tells you what’s happening on your site, but it doesn’t tell you why. To really build empathy and create experiences users love, follow up on juicy insights (like high bounce rates) with session replays to understand the root cause behind the numbers.
Voice of customer tools for user feedback
Voice of customer (VoC) tools help you understand your customer needs by capturing what they really think about your business or product, in their own words.
Learning what your customers have to say about their experience helps you get raw, authentic feedback about how they perceive your brand and product at every stage of the journey, giving you deeper insight into customer emotions and motivations that drive their decision-making.
Here are three customer feedback tools to help you understand your users.
1. Contentsquare
Contentsquare (hello again! 👋) gives you insights into customer behavior with feedback tools like Surveys and Interviews, as well as User tests.
Choose from our library of survey templates or let AI generate one for you based on your research goal. Embed them on any page to ask customers what they think about your product experience, giving them the opportunity to share their unique perspectives. Speed up time to insight with AI-generated reports that highlight key findings and analyze user sentiment, so you can start making improvements right away.
![[Visual] AI-survey-report-sentiment-analysis](http://images.ctfassets.net/gwbpo1m641r7/75Drii2ysxL6V3Qrc93Z1J/7333c77f7984e06b58b551677ead63eb/AI-survey-report-sentiment-analysis.jpeg?w=3840&q=100&fit=fill&fm=avif)
Use AI to quickly create, launch, and analyze surveys in Contentsquare
Want to get a little more in-depth? Conduct user interviews to get even more detailed insights and capture nuances like tone of voice and facial expressions. Invite your own participants or select the right candidates from our diverse pool to connect with members of your ideal customer profile (ICP).
Pro tip: the way you ask a question determines what kind of answer you’ll get. Open-ended questions will give you more qualitative data (and can be answered in detail), while closed-ended questions (think ‘yes/no’ questions) can help you create charts based on quantitative user research data.
Before you set up an on-site survey, know what information you want to get from your visitors—and how you’re going to use it—so you can ask questions that’ll get you the data you need.
2. Qualtrics XM
In 2021, Qualtrics acquired Clarabridge, an AI-powered feedback text analytics tool that collects what people say about your brand or business from every possible source and analyzes how they feel.
The platform puts those conversational analytics to use by uncovering topics and sentiment in customer communications, and quickly detects emotion, intent, and effort in natural language.
3. InMoment
InMoment is an experience-intelligence (IX), AI-powered feedback tool that helps you get more detailed feedback from users.
For example, if you ask your users about their experience and they say ‘Good’, InMoment prompts them further: ‘What was good?’ It also offers social monitoring that gathers meaningful feedback on what your customers are saying about you online.
Tools to visualize your customer journey
Most classic customer journey mapping tools are visual flowchart builders: the digital version of sticky notes, only these can be saved in the cloud, shared with your team, and turned into a remote-friendly collaborative workspace.
Once you’ve collected data about your users from user feedback and analytics tools you’ll have enough information to map out the user journey.
When you have a flowchart mapped out, it’ll be easier to:
Identify all customer touchpoints
See which pathways can be simplified
Find opportunities to increase engagement and build customer loyalty
Visualize which touchpoints belong to each part of the funnel
Create clearer CTAs and paths so users can navigate to the next step
Clarify and prioritize product decisions
Here are five tools to create visual and intuitive maps using customer journey software.
1. Contentsquare
Contentsquare (nice to see you again!) provides comprehensive customer journey analysis from 100% of user data to reveal common user paths, looping behaviors, and valuable journeys.
See how users progress through your site page by page, and use customer segmentation to drill into specific audience cohorts, such as users from specific channels or campaigns, to get even more granular insights. Discover which journeys lead to the best outcomes—like increased conversions and revenue)—and watch session replays to discover how you can replicate these loyalty-boosting experiences.
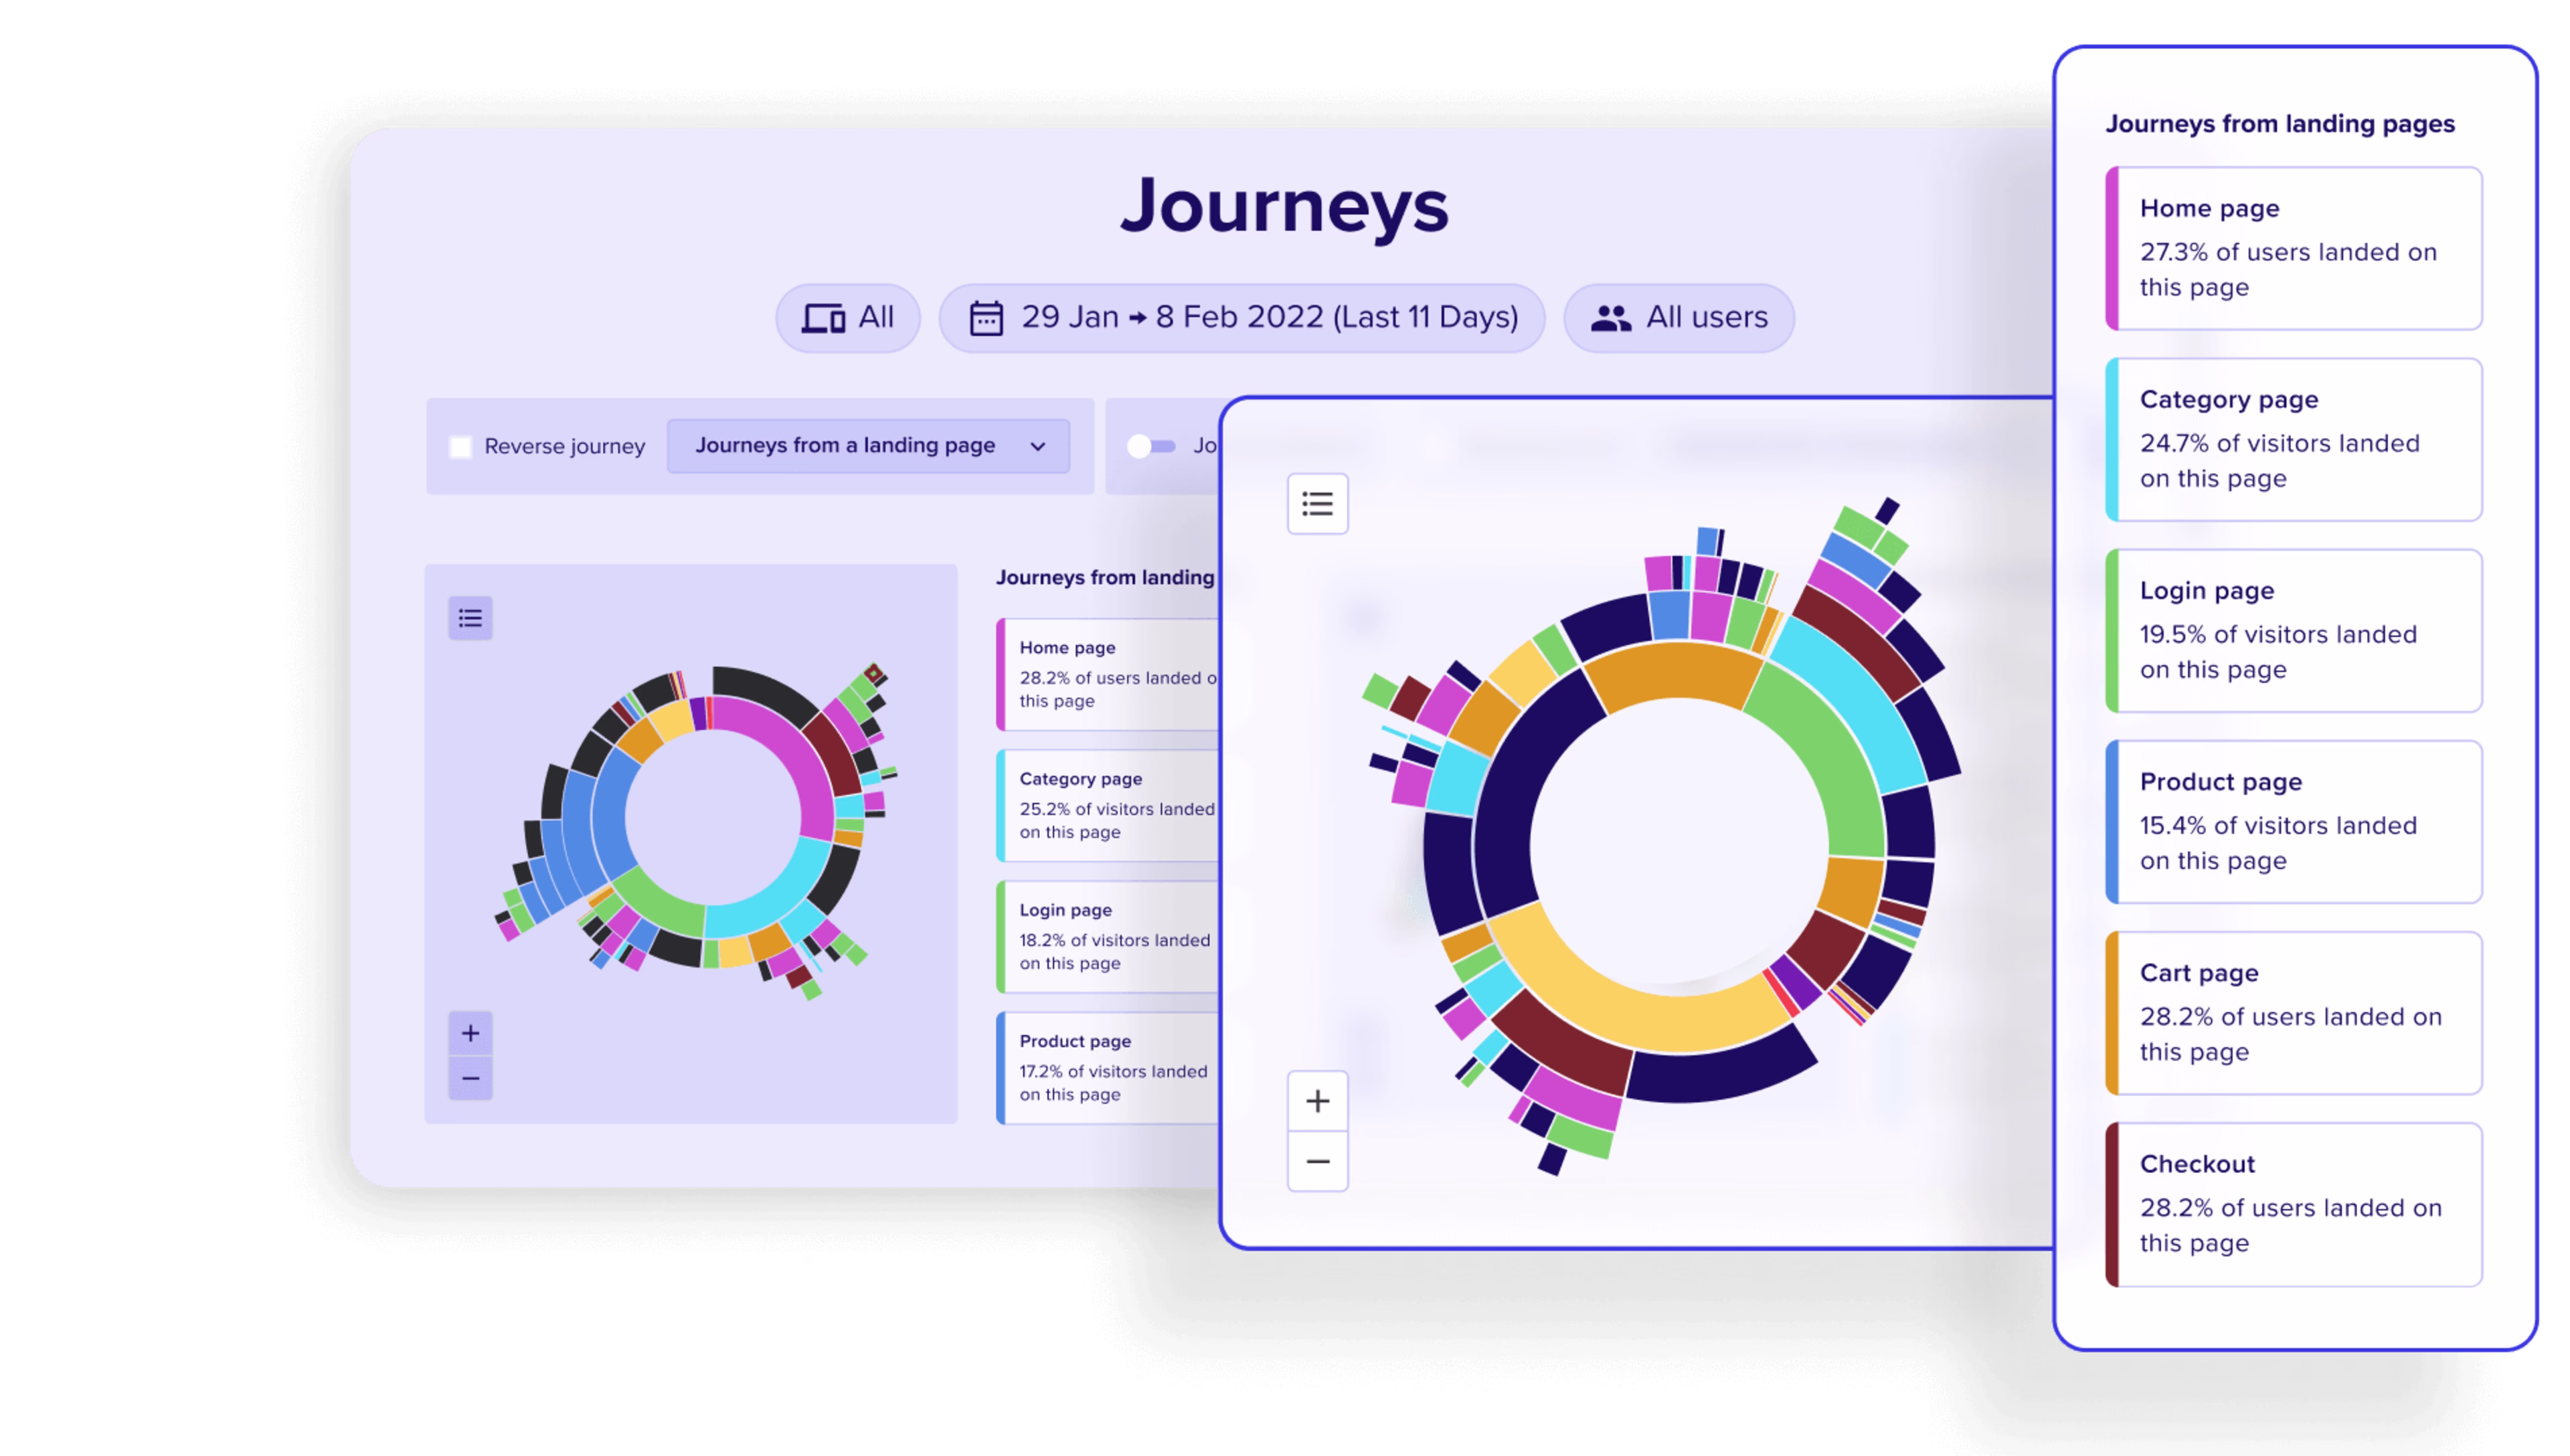
Journeys turns user data into powerful visualizations that reveal exactly which paths your customers take
With the sunburst journey analysis, you have the possibility to really dive deep into all the steps and better understand the customer journey. And Contentsquare can also help us to know which content we push—for example, on the homepage, we use Zone-Based Heatmaps to see which content is performing the best, where people click and where they do not click.
2. Miro
Miro is an online whiteboard workspace that’s great for remote teams who want to brainstorm and put their thoughts onto a shared digital whiteboard. The software lets you create a board from scratch—so you can still use your sticky note strategy, just digitally—or use one of their pre-made templates.
If you’re manually creating your customer journey map using our six-step guide, use Miro to bring heatmaps, survey responses, and other analytics data to life. This helps ensure you and your team make data-driven decisions while visualizing your journey. Use this tool the same way you’d use a whiteboard for prototyping, wireframing, diagramming, or roadmapping.
3. UXPressia
UXPressia’s main functionality is to create customer journey maps. If you need a little more than a whiteboard, UXPressia helps you create consistently good-looking CJMs for your customer personas.
This tool has a beautiful and intuitive interface, perfect for those who want to build maps that impress. You can easily visualize customer touchpoints and customize the maps to your own brand.
UXPressia is great for when you need a clean design and a tool that lets multiple stakeholders map data across different departments—very useful for real-time collaboration. This tool is also a good option if you're looking for a customer journey map template to help you get started.
4. Smaply
Smaply is a mapping tool for complex customer journeys, helping you understand channel usage and backstage processes. It lets you create a repository of customer insights, including images, PDF files, and even audio files to link all your data together and get a full overview of the customer journey.
Use this tool when you’re manually mapping out a complex customer journey and you want to keep everything in one, easy-to-navigate place.
5. Gliffy
Gliffy is a fast and easy-to-use collaborative tool that lets you draw out large diagrams. You can drag and drop shapes from their library and leave feedback comments, and it also integrates with Google Drive. It stores past map versions and tracks changes, so you can always go back to previous iterations.
Gliffy is a great option when you don’t need a fancy customer journey mapping tool, but something simple yet versatile to get your ideas ‘on paper’.
How to choose the right customer journey mapping tool
The right customer journey mapping tool depends on the complexity of your journey, your level of understanding of the journey, how steep the tool’s learning curve is, the structure of your team, and why you’re mapping the customer journey in the first place—that is, what you want to learn from it.
The most important part isn’t really the tool you pick, it’s how you use it and what you do with the insights you get. For the best results, we recommend combining qualitative and quantitative data to give you a complete picture of not just where customers go, but what’s driving them.
FAQs about customer journey mapping tools
A customer journey map—sometimes called a user journey map—is a visual representation of how customers interact with and experience your website, products, or business across multiple touchpoints.
![[Visual] Contentsquare's Content Team](http://images.ctfassets.net/gwbpo1m641r7/3IVEUbRzFIoC9mf5EJ2qHY/f25ccd2131dfd63f5c63b5b92cc4ba20/Copy_of_Copy_of_BLOG-icp-8117438.jpeg?w=1920&q=100&fit=fill&fm=avif)