![[Visual] Man at computer - stock](http://images.ctfassets.net/gwbpo1m641r7/7GloM7xPXUs1M75nfaIWtr/6566092d4d853e43c29d9df2bf791fd1/AdobeStock_540624504__1_.png?w=3840&q=100&fit=fill&fm=avif)
Marketing teams pour time and budget into creating blogs, videos, and landing pages, but often lack visibility into what actually performs—and why. Content analytics changes that by revealing how users engage with content across every touchpoint, from first interaction to conversion.
Equipped with these insights, teams can pinpoint underperforming campaigns, prioritize high-impact content formats, and attribute creative efforts to measurable business outcomes. But how do you conduct content marketing analytics? And how can you leverage the raw data into actionable outcomes that drive return on investment (ROI), engagement, and audience growth?
In this guide, 4 leading content experts share real-world content analytics strategies, tips, and insights. You’ll learn
How to measure, analyze, and report on content marketing analytics
Essential content marketing analytics tools and best practices
Real-world examples of how content marketing analytics boosts revenue, content engagement, and customer retention
How to use Contentsquare’s all-in-one platform to simplify workflows and make smarter, faster content decisions
Key insights
Numbers don’t tell the whole story: combine quantitative performance data with qualitative user insights to understand not only which content performs, but also why it resonates with specific audiences
Prioritize the full customer journey: the most valuable content insights come from analyzing how users move across your entire content ecosystem rather than evaluating individual assets in isolation
Create a continuous improvement cycle: implement a systematic process of testing, measuring, refining, and scaling content marketing efforts to maximize ROI and business impact
Understanding the value of your content is one thing. Knowing how to measure, analyze, and act on that value is another. These 7 steps walk you through a clear, strategic approach to content marketing analytics—from identifying the right metrics to scaling what works.
1. Align content marketing analytics goals with business priorities
Before you dive into strategy or analysis, take a step back. What does success actually look like for your business—and how should content support that vision?
As Sean Potter, Organic Content SEO Lead at Contentsquare, puts it, “A clear understanding of genuine business impact is central to a successful content marketing strategy. To get this, you need to understand which stakeholders to align with, and how to communicate with them.”
Whether it’s driving product adoption, generating qualified leads, or expanding brand awareness, aligning your content marketing analytics with core business priorities keeps your efforts focused, measurable, and directly tied to ROI.
How to connect content decisions to strategic business impact
Involve stakeholders early on: speak with business, product, and sales teams to understand how specific types of content contribute to broader company initiatives and secure early buy-in
Use OKRs to align around impact: frame your content goals in terms of cross-functional objectives and key results (OKRs), so every team is working toward shared business outcomes—like improving customer retention or accelerating the acquisitions pipeline
Prioritize business-critical segments: dig into user segmentation to identify which cohorts are most aligned with current business priorities—like enterprise buyers vs. returning customers—and ensure your content goals target those customers
![[Visual] Segmentation segments](http://images.ctfassets.net/gwbpo1m641r7/6AicsoldoxudeD1oF786iJ/ae111191cd248700358a8d2cfe339ee7/Segmentation.png?w=3840&q=100&fit=fill&fm=avif)
Use Contentsquare to segment users and spotlight high-value cohorts—then shape your content goals around what drives the business forward
2. Identify and track your key content marketing metrics
Once your goals are set, the next step is deciding how to measure progress. That means choosing KPIs that reflect true content impact—not just surface-level engagement—and putting an analytics infrastructure in place to track them over time.
And remember: numbers alone won’t tell the full story. “I use both qualitative and quantitative data to build my organic content and SEO strategies. Without both sides…you’re left with an incomplete picture of the user experience,” says Sean.
On the quantitative side, historical analytics let me understand at a deep level which topics, themes, and formats are most successful for driving business impact. But [qualitative insights like] customer research, surveys, and session replays let me better understand why some of the numbers look the way they do.
How to choose the right data and insights to measure
Benchmark against your industry: use Contentsquare’s Benchmarks capability to compare your KPIs to peers in your industry and pinpoint areas where your pages are outperforming—or falling behind
Get a dedicated dashboard: use a content marketing software solution to set up an analytics dashboard and track key metrics, identify performance gaps, and spot opportunities to improve content
Track primary and secondary conversions: capture high-value actions (like demo requests or purchases) alongside early intent signals (like pricing page visits or white paper downloads) to get a fuller picture of how content supports your marketing funnel
💡Pro tip: not sure which metrics to track? Use this quick-reference table to help you choose the right metrics based on what you're trying to achieve and where you’re at in the funnel.
Funnel stage | Metric category | Example metrics | What the metrics help you achieve |
|---|---|---|---|
Awareness | Brand visibility | Social shares, traffic growth, brand mentions | Evaluate brand reach, content virality, and audience perception |
Awareness | SEO performance | Keyword rankings, organic traffic, backlinks | Improve visibility in search engines and attract qualified organic visitors |
Consideration | User behavior | Bounce rate, avg. time on page, scroll depth | Identify content quality, audience engagement, and opportunities for improvement |
Decision | Conversion | Click-through rates (CTR), leads generated, conversion rates | Measure effectiveness in driving desired actions and contributing directly to ROI |
Loyalty | Customer retention | Repeat visits, return user rate, content shares, CSAT, NPS | Track how content supports retention, satisfaction, and advocacy after conversion |
3. Review content performance across the user journey
With your metrics framework in place, it’s time to take a detailed look at how your content is actually performing. This baseline audit reveals how real users engage across your content ecosystem—showing you what’s working, what’s underperforming, and what needs a rethink.
"No attribution model is perfect, since we know each conversion can have so many touchpoints,” says Sean, adding, "It makes sense to see broader user engagement and how people move from initial touchpoint to conversion."
That thought leadership piece everyone praised internally? It might be a ghost town for actual website visitors. Meanwhile, that ‘quick update’ blog you nearly skipped could be silently driving 30% of your conversions.
This step ensures your analytics approach is grounded in data and real user insights—rather than opinions—so you can prioritize resources where they'll drive the greatest impact.
How to audit the content experience from entry to conversion
Trace common content journeys: use journey analysis tools to uncover how users navigate through your content, revealing which pieces are pulling traffic in and which may be causing drop-offs before conversion
Compare page performance: use page comparison tools to evaluate KPIs across multiple pages, side by side, identifying underperforming content and strategic opportunities for improvement
Focus on high-impact site elements: use heatmaps to see conversion and revenue attribution for individual page elements—like calls to action (CTAs) or banners—so you can optimize parts of the page that matter most for improving conversions
🔍 See it in action: how Early Settler turned low-performing content into a $50K win
When furniture and homeware store Early Settler launched their Black Friday homepage, they thought their prominently placed ‘Shop Catalogue’ tile would drive the most revenue.
But once they audited content performance using Contentsquare’s Heatmaps and Impact Quantification capabilities, they discovered users were barely interacting with the page—despite its prime position. Instead, content buried lower on the page, such as the Black Friday Favourites carousel, was quietly outperforming everything else in terms of engagement and conversions.
With this data, the team restructured their homepage to spotlight the most attractive and impactful content, resulting in a $50K uplift in just over a month.
![[Visual] heatmaps-zoning-elements](http://images.ctfassets.net/gwbpo1m641r7/3DqJkn0v2NqzqliOf9X4WI/0e17fdec33256700832ec903dc6dd449/image.png?w=3840&q=100&fit=fill&fm=avif)
Contentsquare’s Heatmaps capability shows how different web pages and page elements impact conversion, revenue, and subscriptions
4. Map content performance to audience intent
Once you’ve reviewed performance data, the next step is to analyze why a certain piece of content performs better—and for whom. That means analyzing how different types of content perform at different funnel stages, and for different audience segments—so you can align the right format, messaging, and intent.
As Nea Björkqvist, Global Content Lead at Contentsquare explains:
In B2B, ebooks can be great lead-generation assets for engaging new audiences and potential prospects. Customer stories or case studies might work better as one-pagers or slide decks for sales teams to share directly with prospects further down the funnel or existing customers for upsells.
How to see why content performs—and for which audiences
Match content types to funnel stages: use Contentsquare’s Funnel Analysis feature to compare how different formats (like blogs or case studies) influence movement through the funnel, so you can validate which formats work best at each stage
Speak with users directly: conduct 1:1 user interviews to explore customer content preferences in depth. Find out what they engage with, what they ignore, and what they find genuinely valuable or frustrating.
Capture in-the-moment feedback: use voice of customer (VoC) tools like user feedback widgets or surveys to understand how users feel about specific content experiences. That way, you can validate whether it met user needs, answered their questions, or left them wanting more.
😎 Expert insight: regional differences may change what ‘good’ content looks like
High-performing content in one region might miss the mark elsewhere. That doesn’t mean the content is bad or ineffective—it may just need localizing for tone, format, or cultural relevance to resonate with your target audience.
“Localization is key when it comes to ensuring content is successful across markets,” explains Nea. “Although your marketing campaign may be the same, the content still needs to be adapted to meet the needs of the specific market.
Thomas Busson, Senior Content Marketing Manager (SEO) at Contentsquare, adds:
We adapt the copy, tone, examples, and even formats to resonate with local audiences. For instance, a French-centric case study might not carry the same weight in Japan, so we create region-specific versions with local customer or partner stories or data when possible.
5. Prioritize content improvement initiatives
With a clear understanding of how your content performs and engages your audience, it's time to make data-driven decisions about where to focus your content creation and optimization efforts.
Not all content opportunities are created equal: some will deliver significant ROI with minimal effort, while others might require substantial resources for modest gains. The key is to prioritize improvements that balance effort, impact, and business value—so your roadmap is both actionable and aligned with your goals.
How to decide which content fixes drive the greatest value
Consider business urgency: prioritize fixes not just by user behavior, but also by upcoming launches, campaigns, or product pushes—so your improvements support what’s happening across the business
Identify mobile-specific content gaps: mobile accounts for almost 70% of digital traffic. Use mobile analytics to identify content that underperforms on smaller screens, or formats that don’t translate well to touch interaction.
Pinpoint high-impact fixes: use Contentsquare’s Impact Quantification capability and frustration score feature to identify friction points costing you the most conversions. Use these findings to prioritize fixes that close content performance gaps.
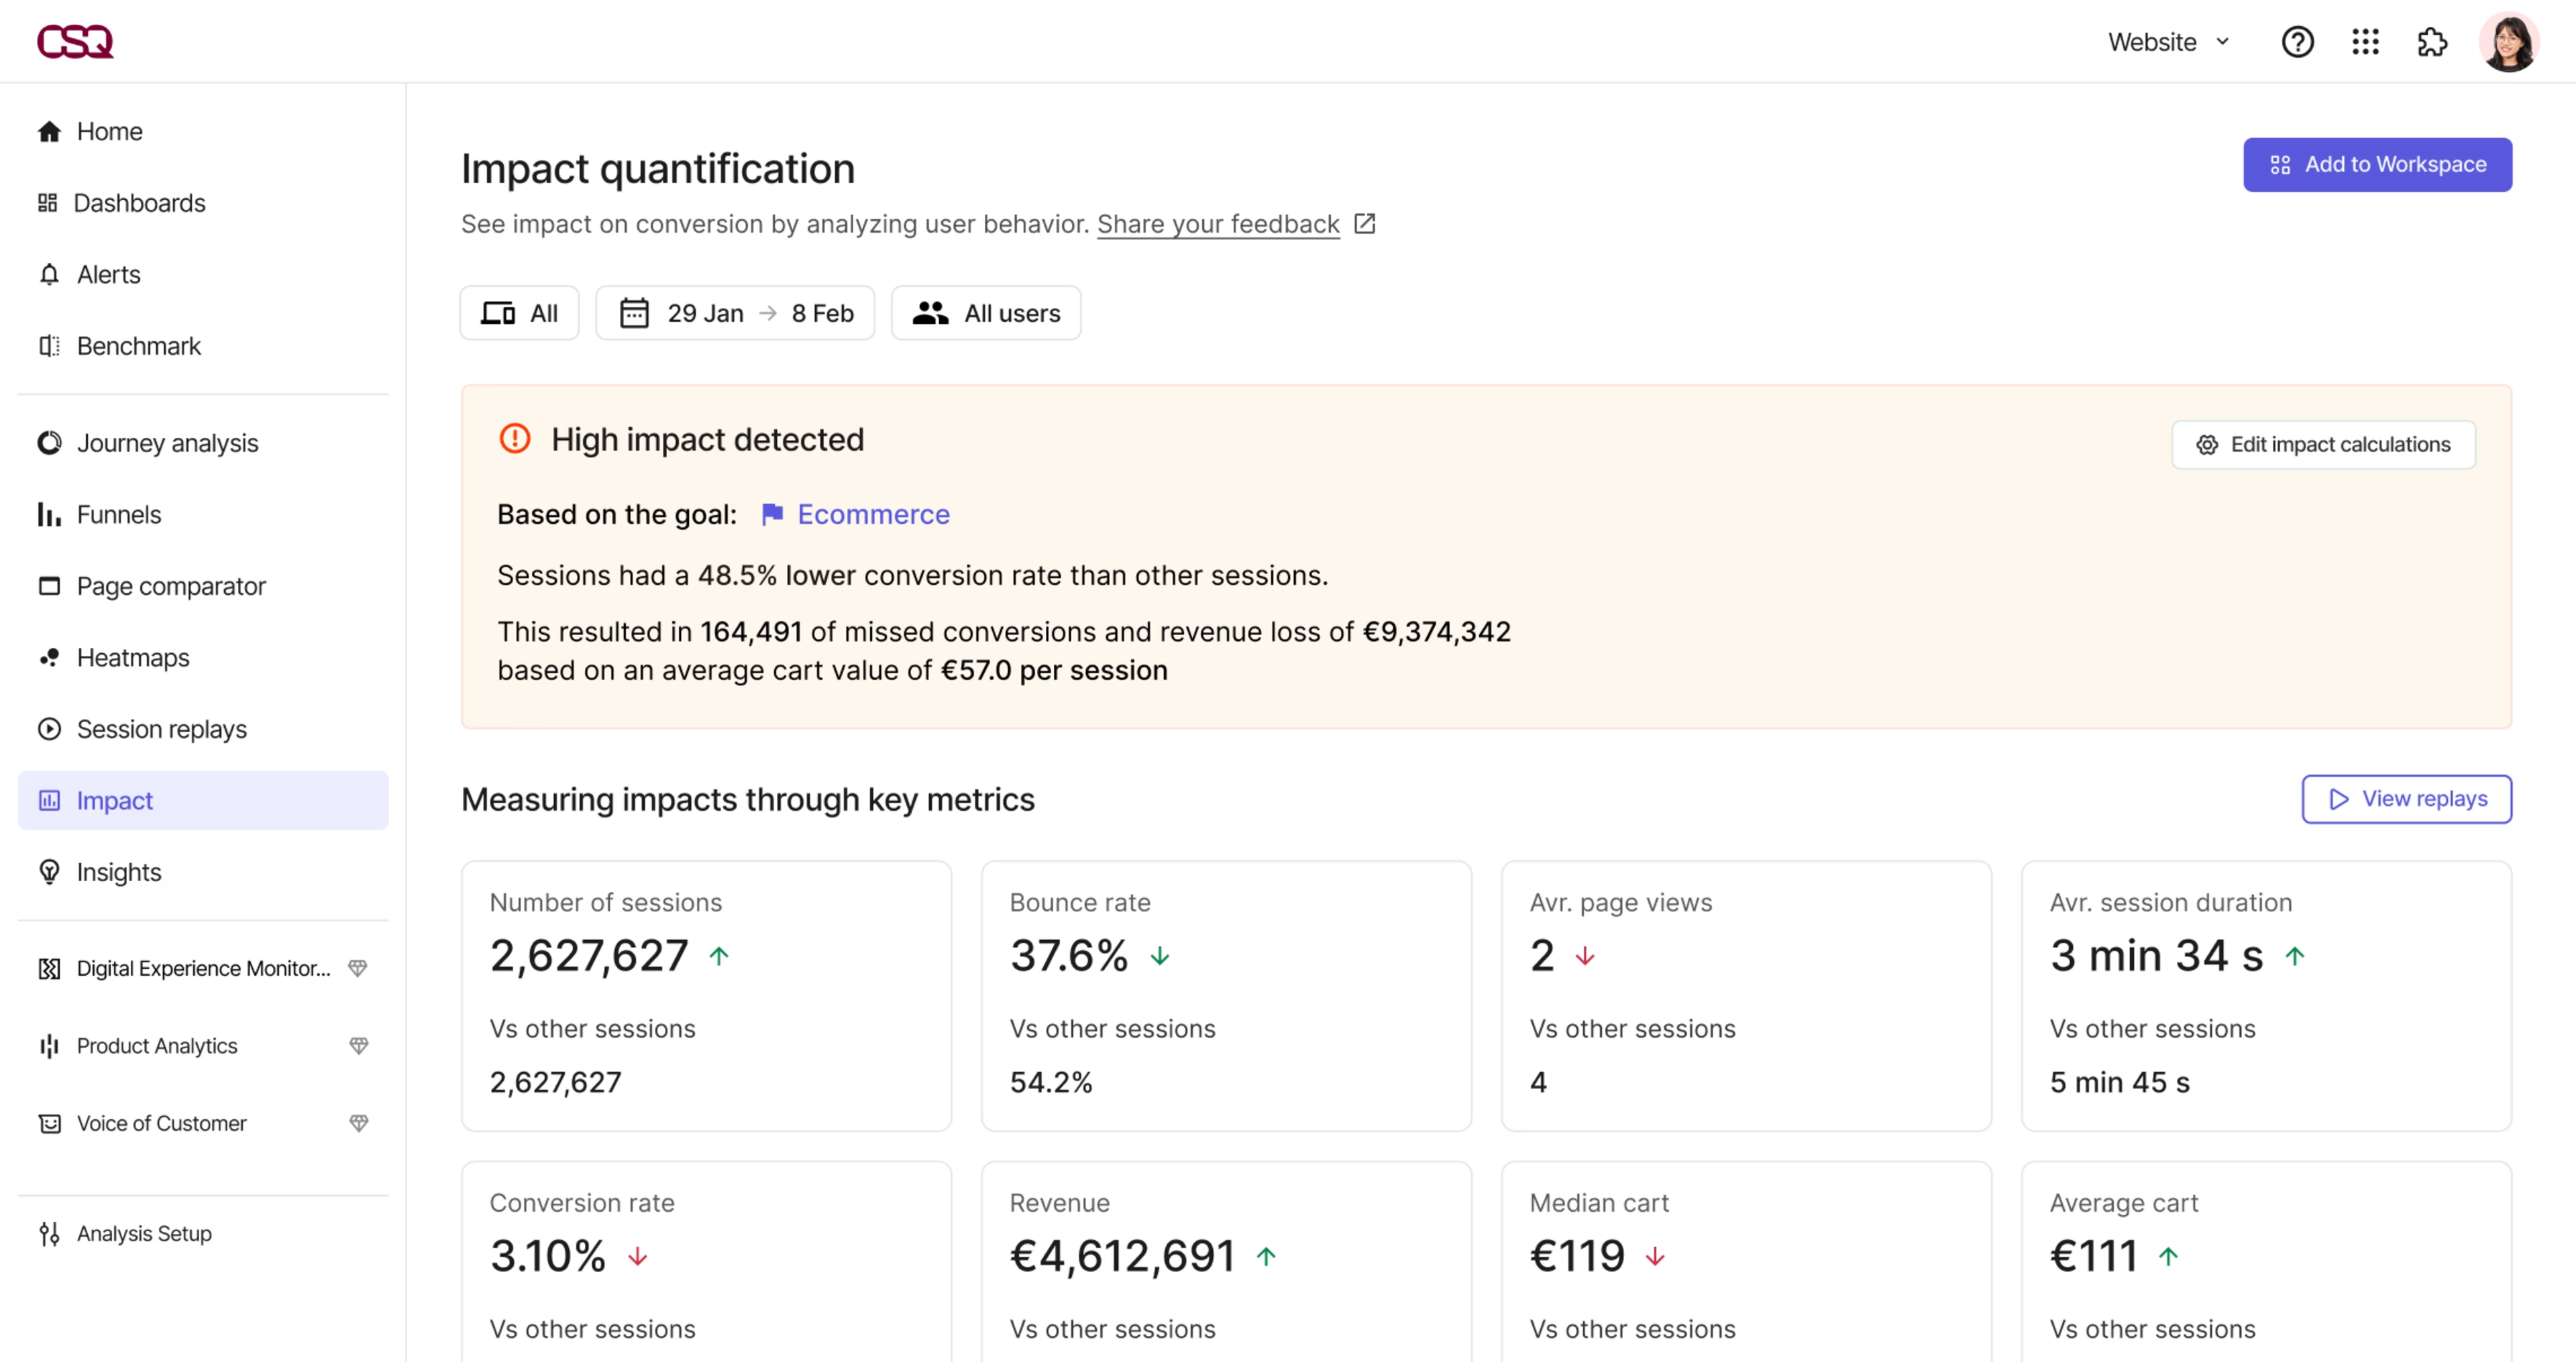
Contentsquare’s Impact Quantification capability shows how different pages and page elements impact conversion, revenue, and subscriptions
6. Test, iterate, and apply content insights
Once you’ve prioritized what to improve, you need to put those ideas to the test and refine them based on real user behavior.
Testing lets you validate changes before rolling them out at scale—so you can be confident they’re actually improving performance. It also helps catch unintended friction early, giving your team room to iterate quickly and avoid costly missteps.
How to turn new content ideas into validated improvements
Run structured A/B tests: use A/B testing tools to systematically test content variables—headlines, formats, CTAs, or visual elements—and implement winning variations
Conduct user tests: use Contentsquare to validate your ideas by watching real users interact with different types of content—like blog posts, product pages, or landing copy—and gather feedback on clarity, relevance, and tone
Lean into AI automation: use AI anomaly detection tools to automatically flag unexpected user behavior during tests, ensuring that content changes positively impact user experience and don't introduce new issues
🔍 See it in action: how Calzedonia tested what not to keep—and saved $20K
Italian fashion brand Calzedonia was spending hours each week updating homepage widgets they believed were driving value. But after reviewing engagement using Contentsquare’s Heatmaps capability, they discovered users were barely interacting with them at all.
To confirm the insight, the team conducted A/B tests, removing the underperforming widgets to see how it would affect user behavior. Engagement remained steady, while the time spent on weekly updates dropped significantly—resulting in over $20K in annual savings.
![[Visual] ab test heatmaps](http://images.ctfassets.net/gwbpo1m641r7/71Feljv3nwR0ng3PEiPGEG/c5c4f991ef679e660e08970edb2a894a/ab_test_heatmaps.png?w=3840&q=100&fit=fill&fm=avif)
Comparing heatmaps in Contentsquare gives you more valuable insights during your A/B tests
7. Monitor results and scale what works
The key to long-term content success is creating a sustainable system for monitoring results, reporting on impact, and scaling what works. This shifts content marketing analytics from one-off optimization to a repeatable, data-driven process.
“Regular reporting and refinement can help you keep meeting business goals over time,” says Sean.
Establish consistent monitoring practices to quickly spot changes in engagement metrics, validate the impact of your improvements, and identify opportunities to scale successful content patterns across your marketing ecosystem.
How to operationalize content wins for long-term growth
Set up performance monitoring: configure real-time alerts with your team's workflow tools (like Slack or Jira) so you can act quickly on changes in user behavior and content performance
Create regular reporting cadence: establish a schedule for reviewing content analytics with stakeholders to continuously highlight wins and identify new optimization opportunities
Use predictive insights: leverage AI-powered analytics to anticipate content performance trends, market shifts, and changing customer needs
😎 Expert insight: scale smarter by repurposing what already works
Once you know what’s performing, don’t let it live in a silo. Repurposing successful content across formats, teams, or campaigns is one of the most effective ways to extend value without starting from scratch.
As Steve Kelly, Content Marketing Manager (Video) at Contentsquare, explains: "We need to be, if not literally everywhere, then certainly in more places than ever before and our content needs to be in more formats than it used to be. But more platforms and more formats equate more money, effort, and time.” He adds:
As we all know, those 3 factors are finite, so we have to find ways to make the content we invest in multi-platform and multi-format. In other words, we have to repurpose, and we have to be able to do it systematically and at scale.
Drive smarter decisions with end-to-end content analytics
Content marketing teams are under more pressure than ever to prove impact, move fast, and make smart decisions at scale. With the right content marketing analytics process in place—from goal-setting and performance reviews to testing, scaling, and monitoring—you can cut through the noise and focus on what works.
Contentsquare gives you the tools to do just that, helping you understand how users engage with content across every touchpoint, so you can create better experiences, prioritize what matters, and grow with confidence.
FAQs about content marketing analytics
Content marketing analytics is the practice of measuring how users engage with your content—across channels, formats, and funnel stages—to uncover what’s working, what isn’t, and what to do next. It combines qualitative and quantitative data to give content teams real insight into audience behavior, so they can make smarter decisions about strategy, formats, and optimization priorities.
![[Visual] Contentsquare's Content Team](http://images.ctfassets.net/gwbpo1m641r7/3IVEUbRzFIoC9mf5EJ2qHY/f25ccd2131dfd63f5c63b5b92cc4ba20/Copy_of_Copy_of_BLOG-icp-8117438.jpeg?w=1920&q=100&fit=fill&fm=avif)