![[Visual] saas website best practices](http://images.ctfassets.net/gwbpo1m641r7/2mgLfquJVpOIbPCulN4e6s/6de014b3390f71cf8594c4e4f0afa4f8/saas-website-best-practices.jpg?w=1155&q=85&fit=scale&fm=avif)
Digital experience benchmarks for software businesses frequently diverge sharply from those of other industries—as confirmed by the data in our latest Digital Experience Benchmarks.
Our analysis of 2023’s digital experience data reveals that traffic to websites declined across all industries last year, with Software the third-most affected of the 10 industries we surveyed.
But even though overall traffic was down, we also saw some positive trends within that data. Specifically, while there may have been less traffic to software sites last year, those visits were more engaged than they were in 2022.
Read on for more trends—and opportunities—we identified for software businesses in our report, and learn how you can leverage these insights to improve your digital customer experience (and grow your software business) in the coming year.
1. Traffic dropped dramatically (but paid sources could help boost visit volume)
Overall, 2023 saw a decline in traffic across almost all industries surveyed, but software was hit particularly hard. Traffic dropped by –7.8%, over twice the average across all industries (–3.6%).
Direct and organic search remained Software’s two biggest channels by a landslide, even increasing their traffic share YoY, while paid traffic contributed only 13% of overall visits and 20.5% of new visits.
As a result, the channel mix is shifting even further away from paid sources, which lost 3.6 points year-over-year. Paid sources contributed -28% fewer visits overall, with drops in traffic share for paid search, paid social, and display, ads and retargeting.
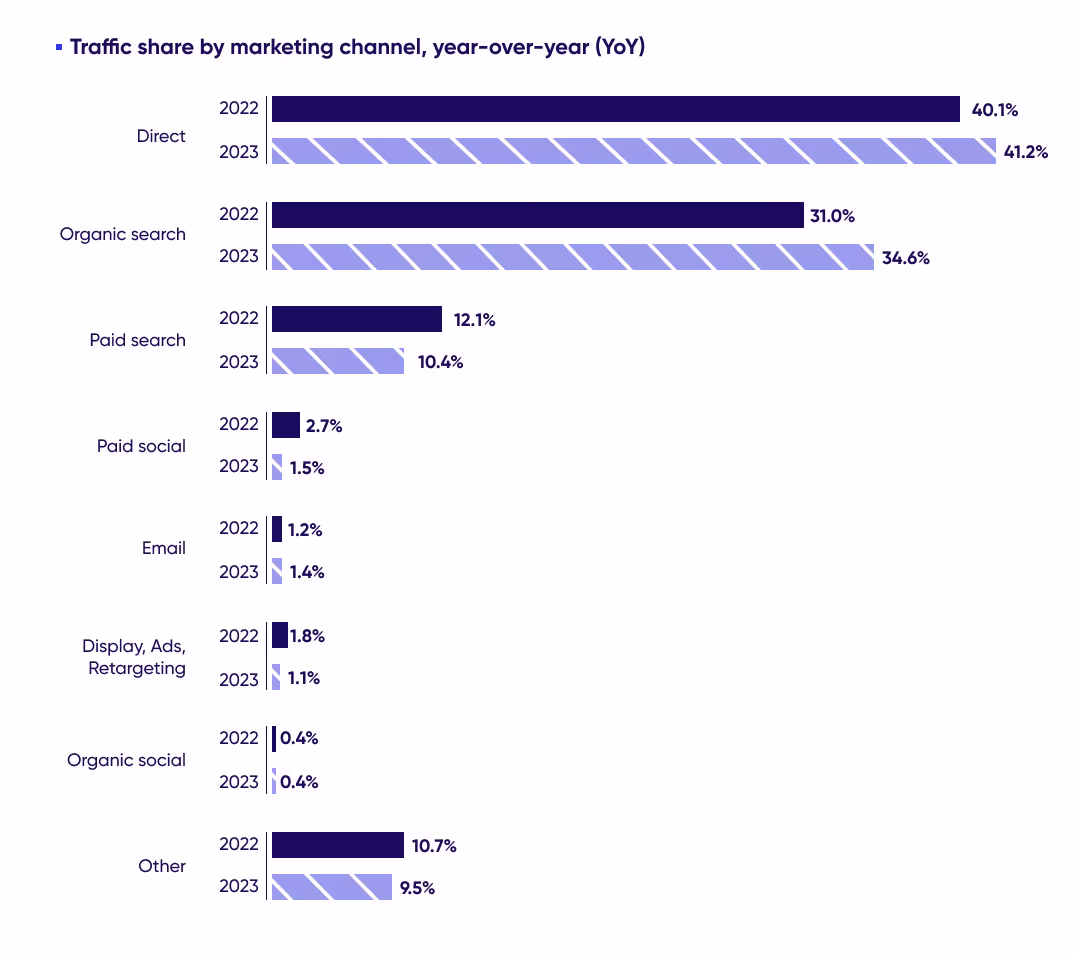
Direct and organic search are Software’s main traffic sources, and continue to grow YoY
Direct and organic search aren’t going to be overtaken any time soon, but software businesses shouldn’t underestimate the value of paid in driving visits.
Paid search is the second-highest-converting channel across all industries for the second year in a row, with a conversion rate of 2.5%, compared with 3.1% for direct and 2.1% for organic search.
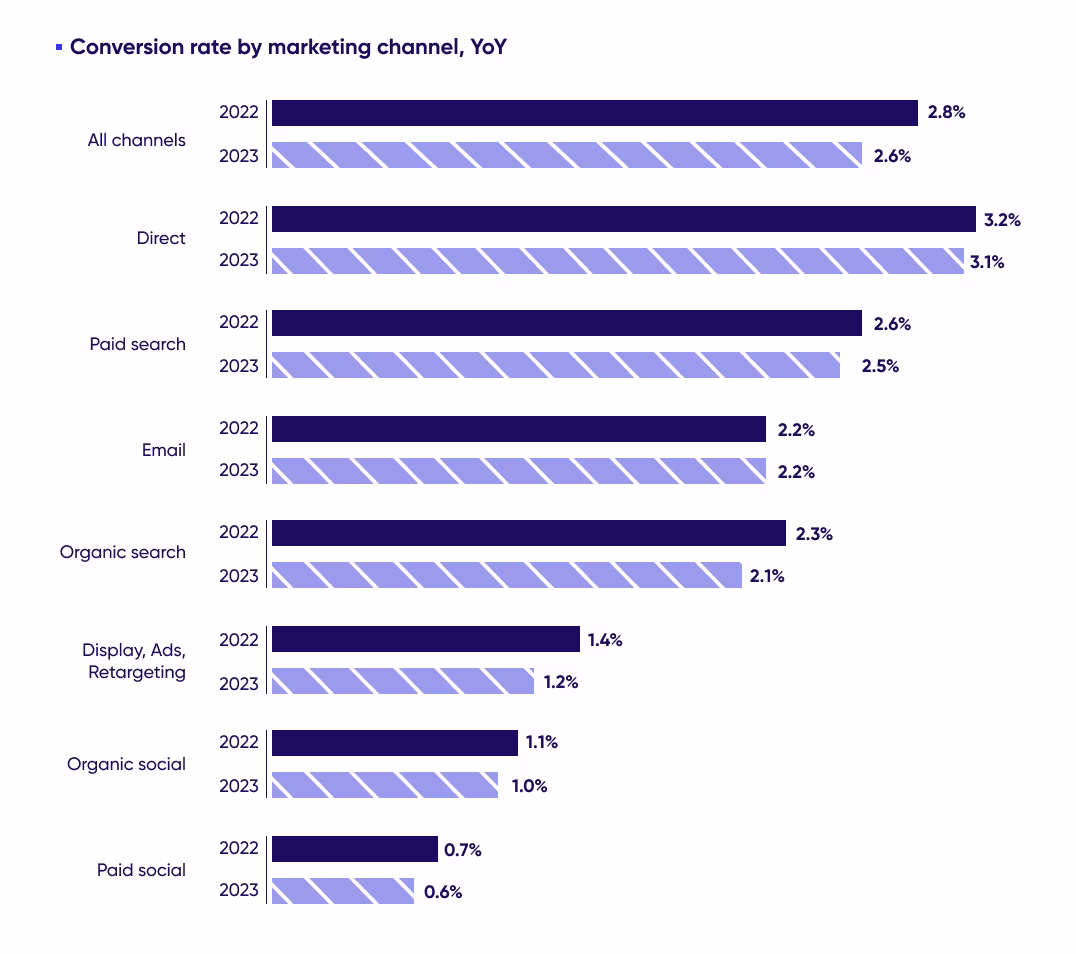
Paid search is a leading conversion channel
For software businesses specifically, bounce rates (which we’ll cover in more detail shortly) for paid search are also the lowest of all paid traffic channels, sitting at 71.2% compared with display, ads, and retargeting’s lofty 87%—so this could be a channel to explore to stay aligned with SaaS website best practices in 2024.
2. Nearly 1 in 3 visitors to software sites experienced frustration
Visitor frustration is caused by specific moments of friction during the on-site experience. When a visitor encounters multiple points of friction in a session, it can have an extremely negative impact on that experience.
Our 2024 Digital Experience Benchmarks expand on how visitor frustration can (and often does) lead to increased bounce rates, reduced engagement and less valuable visits overall.
So it should be a cause of concern for software companies that, while visitors to software sites generally experience less friction than average, frustration still impacts almost a third (32.9%) of all Software visits.
The biggest frustration factor for software site users last year was slow page loads (defined as a page load that exceeds 3 seconds), closely followed by JavaScript errors.
Poor website performance negatively impacts users and hurts SEO, so stamping out these frustration factors should be a top priority for digital teams in 2024.
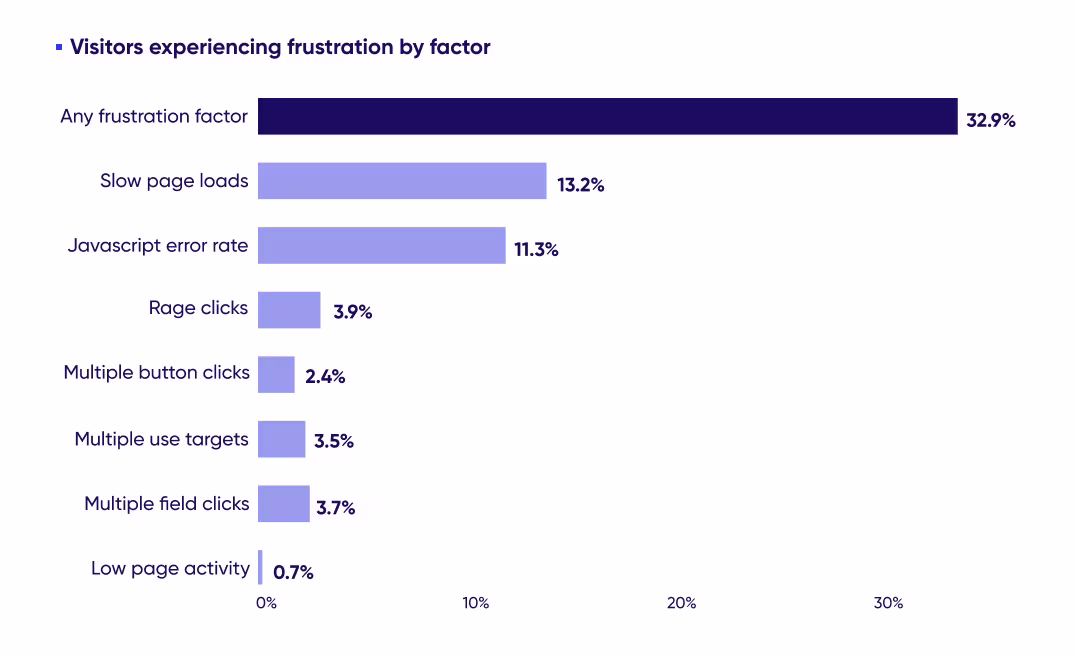
Frustration on software sites is up 19% YoY
3. Bounce rates are improving for key traffic drivers
Now for some good news: The two biggest traffic drivers in software, direct and organic search, both saw significant improvements in bounce rates last year, and as a result, Software saw a big drop in bounce rates YoY—from 68% in 2022 to 56% in 2023.
This improvement means that sessions are deeper than they were last year. Consumption—which combines pages viewed and time spent—was up +16.8% YoY for Software, signaling a big boost in user engagement.
To keep this positive change trending upward, teams should examine their most engaging pages to discover what captures and keeps users’ attention. Whether it’s clear layouts or better messaging, understanding what retains interest will enable you to optimize and replicate success across other pages.
(And don’t forget to find and fix those moments of visitor frustration mentioned above to ensure the user experience is an engaging one—not an enraging one.)
4. Desktop is still king—but mobile share is growing
Software is an outlier when it comes to device usage. While mobile devices account for over 70% of the traffic share in several B2C industries, those rates are almost reversed for software and its primarily B2B audience, with desktop driving 69.5% of traffic.
Mobile remains the minority driver of visits to software sites, but it did increase its share from 27.5% to 30.5% in 2023, showing its growing importance even in B2B.
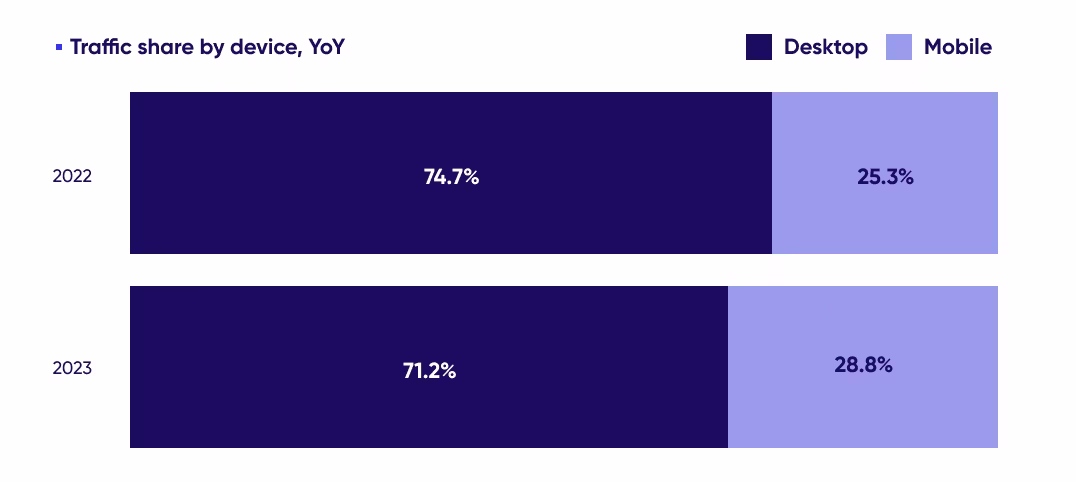
Desktop is the primary device for accessing software sites, but mobile’s traffic share is growing
Data-driven teams should dive deeper into the source of mobile traffic, considering key metrics and using digital experience analytics tools to understand how the user journey varies between desktop and mobile.
These insights will reveal whether you should design for full-screen experiences by default and use standard mobile responsive templates, or if it’s worth investing in a dedicated mobile experience—so you can manage your resources most effectively and get the best ROI.
5. Mobile accounted for less traffic, but saw deeper engagement
Session depth is defined by how many pages a typical visitor views, and how long they spend in session and on pages.
Even though desktop sessions are more popular for software sites, mobile sessions are twice as deep as desktop.
Mobile visits deliver more page views per session (5 on mobile vs. 2.3 on desktop). Unlike other industries, where mobile sessions are on average 60% shorter, the time spent on desktop pages and mobile pages is nearly equal, too.
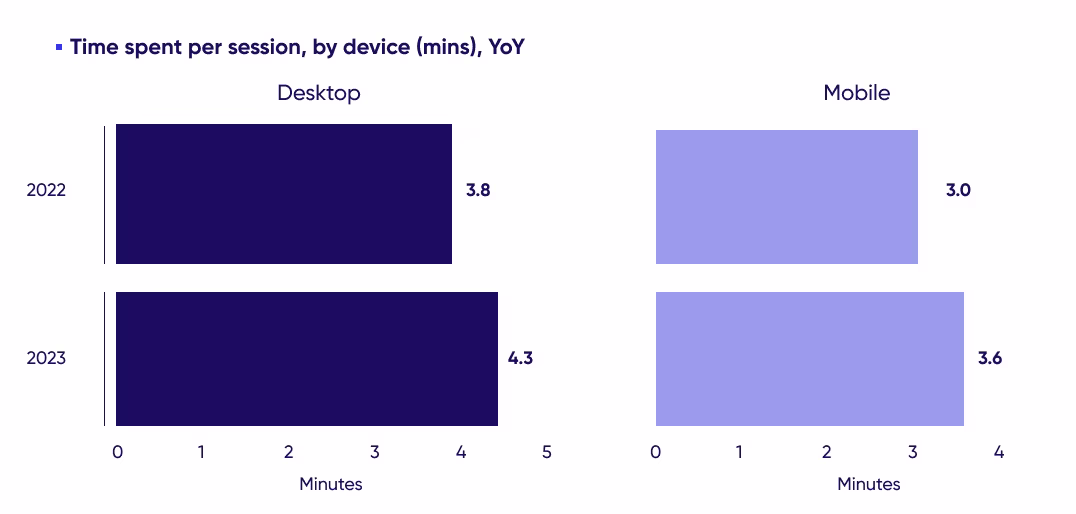
Time spent per session, by device (mins) for desktop (blue) and mobile (red)
This suggests that—while optimizing sites for desktop should remain the priority—there are opportunities for forward-thinking teams to leverage the mobile experience for software sites in impactful ways.
What makes the mobile experience so much more engaging? Digital teams designing experiences for software sites need to find out.
Examining the drivers of this consumption pattern will uncover opportunities to improve the entire journey—and connect desktop and mobile journeys for a more cohesive experience.
Discover more about the metrics that matter
To connect with primarily B2B users and deliver an optimal customer experience, digital teams working on software sites need to get granular.
And it all starts here, with the industry-specific trends and opportunities to look out for in 2024.
Access our 2024 Digital Experience Benchmarks for even more insights to guide your digital strategy and elevate your digital customer experiences this year.

Anna is a freelance content writer and strategist specializing in B2B SaaS. She's written for industry-leading companies like Contentsquare, Hotjar, Intercom, DocuSign, HubSpot, and more. When she's not writing, she spends her time reading, drawing, and hanging out with her cat.