
Key takeaway: In 2026, winning means moving beyond page views and embracing behavioral intelligence. The right CX tool doesn't just show you what happened. It reveals the why behind every click, hesitation, and exit. Combining qualitative feedback with quantitative data helps you understand customer expectations and needs before they even arise.
Struggling to turn customer interactions into growth strategies you can actually act on?
You're not alone. Most businesses collect massive amounts of customer data but lack the depth of analysis needed to translate it into better experiences. If you're guessing why conversion rates are dropping, or why shoppers abandon their carts right before checkout, it's time to stop guessing.
The right analytics platform gives you a clear view of the full customer journey. It shows you where friction lives, identifies critical pain points, what's driving loyalty, and where your biggest opportunities are hiding. Here are the 9 best customer experience analytics tools for 2026.
1. Contentsquare
While most tools tell you how many people visited a page or where they clicked, Contentsquare tells you why they clicked, where they hesitated, what frustrated them, and what it cost you in revenue. It captures behavior passively, without disrupting the user, and connects that data to business outcomes so your team always knows what to fix first.
What sets it apart is its consolidated platform. Instead of stitching together separate tools for heatmaps, replays, surveys, and error monitoring, Contentsquare brings everything together in one place, on one tag, with one login. No data silos, no switching between tools, no gaps in your understanding of the journey.
Best for: Digital, product, UX, and marketing teams at mid-market and enterprise organizations who need a complete, connected view of the customer experience
See what's happening, understand why, and know what to fix
Start with the behavior layer. Contentsquare's zone-based heatmaps show you how users engage with every element on your pages, including buttons, banners, CTAs, and product cards, so you can see at a glance which are driving revenue and which are taking up space. When you need to go deeper, session replay lets you watch real, anonymized user journeys from start to finish. Every click, scroll, hesitation, and error is captured. AI-powered summaries mean you can spot patterns across hundreds of sessions without watching each one individually.
When you find something worth investigating, journey analysis shows you the full path that led users there. Forward analysis reveals where they went after a key page. Reverse analysis shows what happened before they dropped off, whether that was a confusing navigation path, a frustrating form, or an error encountered steps earlier. And because Contentsquare automatically captures interactions with forms, no custom tagging needed, you can see exactly which fields cause hesitation, which ones users abandon last, and where the real friction is hiding.
None of that insight exists in a vacuum. Impact quantification ties every friction point you find to a business outcome, showing you the revenue, conversion, or abandonment cost of each issue. That means your team can stop debating priorities and start acting on them.
![[visual] Pendo-alternative-with-Impact-Quantification](http://images.ctfassets.net/gwbpo1m641r7/18GBqlsvAsZnAwNojAEHuG/83c8618396be54ce5c8e5104e7d05104/Pendo-alternative-with-Impact-Quantification.png?w=655&q=85&fit=scale&fm=avif)
Stay ahead of technical issues
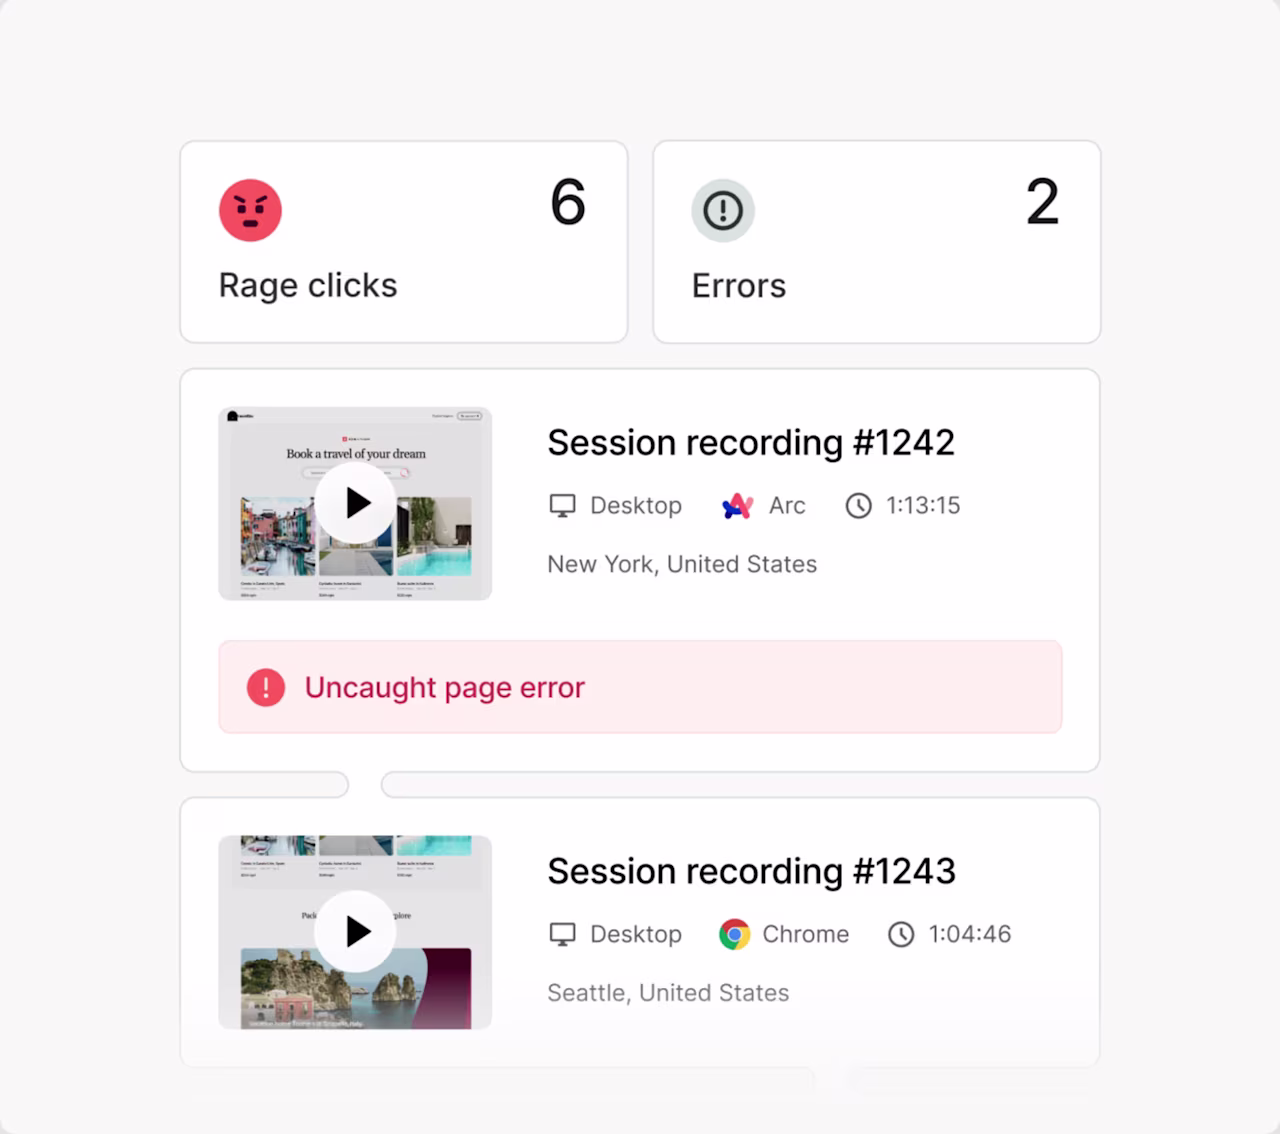
Understanding behavior is only part of the picture. Contentsquare's experience monitoring capabilities help your team catch problems before users do. Error analysis surfaces and ranks JavaScript, API, and custom errors by business impact, so you know which ones to fix first and can link directly to session replays to see what users actually experienced.
![[Visual] error analysis](http://images.ctfassets.net/gwbpo1m641r7/3MmuTJBoYbIUb3ThWkjlN9/4c56a0f64d336682060d8789d5d9051e/error_analysis.jpg?w=624&q=85&fit=scale&fm=avif)
Speed analysis keeps an eye on Core Web Vitals, so slow pages don't quietly drain your conversion rates or hurt your SEO rankings. Frustration scoring flags the pages and elements generating the most struggle, from rage clicks to erratic scrolls, while AI Alerts proactively notify your team the moment a key metric shifts unexpectedly. Integrated with Slack or Jira, your team can act fast, without checking dashboards manually.
Understand users across their whole journey
For product teams, Contentsquare goes beyond the single session. Its product analytics module lets you track how users behave across multiple sessions and devices over time, including your mobile app. You can build cohorts, create segments based on user actions or third-party data, and monitor conversion funnels to find exactly where users drop off across your most important flows.
And when you need a quick answer, AI CoPilot is there. Ask any question about your data in plain language and it runs the analysis for you automatically, shows its work, and tells you what to do next. No analyst, no setup, no waiting.
Hear from your customers, then connect it back to what they did
Numbers tell you what's happening. Feedback tells you why. Contentsquare's Voice of Customer module closes that gap directly within the platform, so you never have to reconcile data from two separate tools.
You can launch AI-powered surveys in seconds, using 40+ templates or simply typing your goal and letting the AI build the questions. Deploy them wherever in the journey you need to listen: as popovers, exit-intent triggers, embedded widgets, or always-visible feedback buttons. Responses are automatically categorized by sentiment, summarized with key insights and customer quotes, and tagged by theme, so you're never sifting through hundreds of open-text answers manually.
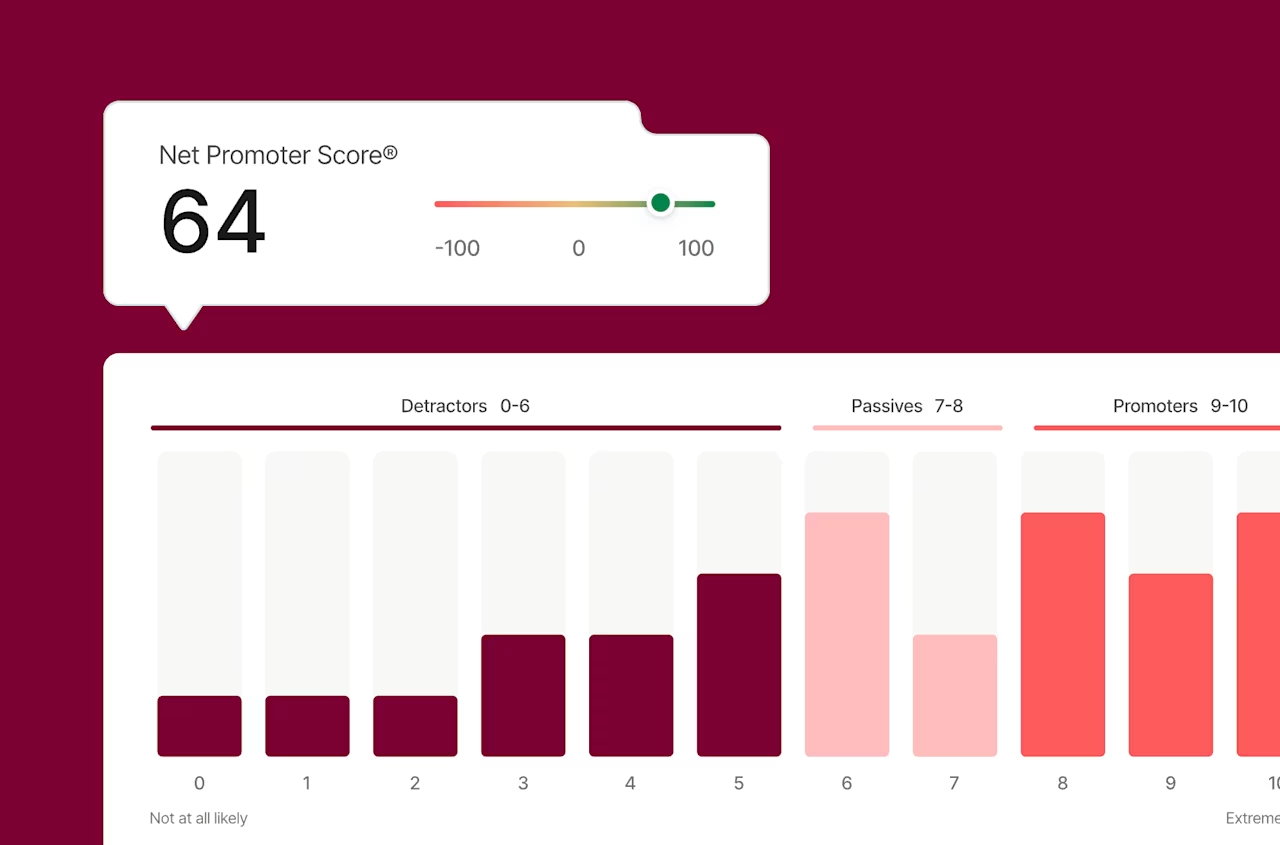
The real value comes from the connection. When NPS scores dip, you can cross-reference with heatmaps and journey data to understand the behavioral root cause. When a customer flags a confusing checkout, you can jump straight into their session replay to see exactly what they experienced.
When you need to go even deeper, user interviews and unmoderated tests are built in too, with access to a pool of 200,000+ participants from 130+ countries, and automated recruitment, scheduling, and transcription handled for you.
What makes Contentsquare different
The features matter, but the real differentiator is how they work together. Because everything lives on one platform, one tag, and one contract, there are no data gaps between what users do and what they say, no delays reconciling reports from different tools, and no blind spots between teams.
Data is captured automatically across web and mobile, with no tagging plan to maintain. It's stored flexibly, so you can run retroactive analyses and answer questions today about behavior from months ago. And when you find something worth acting on, impact quantification tells you exactly what it's costing you, so the conversation with your team moves from "we think this is a problem" to "here's what fixing it is worth."
Contentsquare integrates with 100+ tools, including Google Analytics, Adobe Analytics, Optimizely, Qualtrics, Salesforce, Slack, and Jira, and scales from free plans for smaller teams to full enterprise-grade solutions with advanced security, compliance, and data governance.
Real results: Customers report a 3% to 4% impact on website conversion rates. One financial services customer increased mortgage applications by 20%. Another reduced support calls by 92%, saving $2.7 million. A retail customer saw feature adoption jump from 3% to 99%.
2. Medallia
Medallia is built for capturing the voice of the customer across every touchpoint, from in-store to in-app, providing a true omnichannel perspective. If you need to aggregate feedback at scale, it's a strong choice.
Its strength lies in signal capture and predictive analytics. It pulls data from surveys, social listening via social media channels, contact center transcripts, and more, then uses machine learning and AI to surface patterns and predict customer behavior.
Best for: Enterprise-level feedback programs and predictive retention
Key feature: AI-powered text and video analysis helps you spot emerging trends before they become problems
Why it matters: Medallia is designed for organizations with complex, multi-channel feedback ecosystems, particularly where the voice of the customer needs to feed into operational decisions, not just marketing
Who it's for: Large enterprises in retail, financial services, and telecoms with mature CX programs
3. Qualtrics XM
Qualtrics is the gold standard for Experience Management (XM) and holistic customer experience management. It connects customer, employee, and brand experience into a single platform, helping teams see how those three dimensions influence each other.
It's especially strong for research-heavy teams who need sophisticated survey logic, statistical modeling, and advanced segmentation to uncover deep customer insights.
Best for: Organizations that need deep research capabilities alongside operational CX data
Key feature: iQ, Qualtrics' predictive intelligence engine, automatically models the key drivers of customer loyalty so you know where to focus your efforts
Why it matters: Qualtrics bridges the gap between listening and acting. It doesn't just collect feedback. It helps teams prioritize the changes most likely to improve outcomes across the business
Who it's for: Research, HR, and CX teams in enterprise organizations who need rigorous data modeling alongside experience insights
4. Mixpanel
Mixpanel is built around event-based tracking. It gives product teams a granular view of how users navigate through an app or product, and where they drop off.
Unlike page-view analytics, Mixpanel tracks specific actions so you can measure the exact behaviors that lead to conversion, retention, or churn.
Best for: Product teams focused on conversion optimization, retention analysis, and A/B testing
Key feature: Conversion funnels can be built in seconds, pinpointing the exact step where users disengage
Why it matters: Mixpanel is particularly effective when you need to tie behavior to outcomes. Its cohort analysis tools let you track whether product changes are actually improving retention over time, not just in the short term
Who it's for: SaaS and mobile product teams who want to make data-driven decisions about their roadmap
5. Glassbox
Glassbox specializes in session replay and struggle detection. It records every movement, click, and scroll so your team can see the experience through a customer's eyes.
Its focus on technical error detection makes it a strong choice for teams where bugs or broken flows are directly affecting revenue.
Best for: Identifying technical issues and UX flaws in real time
Key feature: The Cash-at-Risk dashboard quantifies how much revenue is being lost due to specific technical errors, making it easier to prioritize fixes with engineering teams
Why it matters: Glassbox connects the technical and the experiential. When a customer hits an error, you can see exactly what happened, how many users were affected, and what it cost you
Who it's for: E-commerce and financial services teams where site reliability and UX errors have a direct impact on revenue
6. Adobe Analytics
For data-driven organizations already operating within the Adobe ecosystem, Adobe Analytics offers deep attribution modeling and cross-channel analysis at scale.
It's one of the most powerful tools in the market for handling complex data analysis and high-volume datasets, particularly when you need to understand the role of every touchpoint in a customer's journey.
Best for: Advanced attribution modeling and cross-channel performance analysis
Key feature: Analysis Workspace lets teams build custom, drag-and-drop reports and share insights across departments instantly
Why it matters: Adobe Analytics shines when you need to connect ad spend, email performance, and on-site behavior into a coherent picture. It works best as part of the broader Adobe Experience Cloud
Who it's for: Marketing and analytics teams in large enterprises with complex attribution needs and existing Adobe investments
7. SurveyMonkey Enterprise
SurveyMonkey Enterprise is built for teams that need to collect reliable feedback quickly, without sacrificing security or compliance.
It's a flexible tool. Deploy surveys at key moments in the journey, target specific segments, and pull results directly into your CRM or data warehouse.
Best for: Agile teams that need fast, targeted feedback from specific customer segments
Key feature: Native integrations with tools like HubSpot and Zendesk let you trigger surveys automatically based on customer actions, such as a completed purchase or a recent support ticket
Why it matters: SurveyMonkey Enterprise makes it easy to close the loop between what customers do and what they say. Its lower complexity makes it a practical choice for teams that need feedback insights without a dedicated research function
Who it's for: Customer success, marketing, and product teams at mid-market companies who need a reliable, scalable survey tool
8. Tealeaf by Acoustic
Tealeaf is a veteran in the session replay space, known for its ability to handle high-volume, complex environments. It's particularly well-suited to organizations with strict data security and compliance requirements.
Best for: Large-scale e-commerce sites and financial institutions where data security is a priority
Key feature: Struggle Analytics flags users who are repeating actions or encountering errors, making it easier to identify confusing flows across millions of sessions
Why it matters: For regulated industries, Tealeaf offers data residency and security controls that newer tools don't always match. Its depth of session data is also useful for legal and compliance teams who need to reconstruct user journeys
Who it's for: Enterprise teams in banking, insurance, and large retail, especially those with existing Acoustic or IBM infrastructure
9. Gainsight
Gainsight is the industry leader for customer success in SaaS and B2B. Unlike the other tools on this list, its focus is almost entirely on the post-purchase journey.
It helps customer success managers track health, identify churn risk, and spot upsell opportunities to improve customer satisfaction, all from a single platform.
Best for: Reducing customer churn and growing net revenue retention
Key feature: Customer Health Scores aggregate usage data, CSAT, NPS, and feedback into a single, actionable number that tells your team exactly where to focus
Why it matters: Most CX tools focus on acquisition and conversion. Gainsight fills the gap by making the ongoing customer relationship manageable at scale. For SaaS businesses, where retention is the growth engine, that's a critical capability
Who it's for: Customer success and account management teams at B2B SaaS companies
How to choose the right CX analytics platform
Choosing a CX tool isn't just about features. It's about your team's specific goals, the gaps in your current understanding, and which blind spots are costing you the most right now.
The best place to start is a single, honest question: What is the biggest thing we don't know about our customers?
Your answer will point you toward the right category of tool, and the right tool within it.
Step 1: Be clear on your primary goal
Different tools are built for different problems. Before you evaluate platforms, define what you're trying to solve.
You're losing conversions and don't know why. Look for a platform with behavioral analytics, journey analysis, and session replay. Contentsquare and Glassbox are strong here.
You need to understand customer sentiment at scale. A feedback-first platform like Medallia or Qualtrics will serve you better.
Your product team needs to track feature adoption and retention. Mixpanel or Contentsquare's Product Analytics module are built for this.
You're managing a SaaS customer base and need to reduce churn. Gainsight is the dedicated solution.
You need everything in one place. A consolidated platform like Contentsquare covers behavioral analytics, monitoring, product analytics, and voice of customer without stitching together multiple tools.
Step 2: Audit your existing tech stack
The best tool is the one that works with what you already have. Before signing a contract, check:
Does it integrate natively with your CRM, data warehouse, or marketing automation platform?
Can it ingest third-party data (like campaign attribution or A/B test results) to enrich its analysis?
Does it export data in a format your data team can use (for example, SQL-ready exports to your cloud warehouse)?
The more connected your analytics stack, the more value each individual tool delivers. A platform like Contentsquare, with 100+ certified integrations including Google Analytics, Optimizely, Qualtrics, Salesforce, Slack, and Jira, makes it easier to connect behavioral data with the rest of your workflow.
Step 3: Think about data governance and implementation cost
How your data is captured matters as much as what you capture.
Tagged implementations for data collection require your team to define and maintain a tagging plan. This can take months to set up, and every site change risks breaking your tracking.
Auto-capture platforms collect behavioral and performance data automatically. They're faster to implement, cheaper to maintain, and let you answer questions retroactively, including ones you didn't think to ask at launch.
Ask vendors: Can I answer a question today about user behavior from three months ago? If the answer is no, you may be limiting your future analytical flexibility.
Step 4: Assess the real cost of fragmentation
Many teams build their analytics stack by layering point solutions: one tool for heatmaps, another for session replay, a third for surveys, and a fourth for error monitoring. The result is siloed data, disconnected workflows, and teams that draw conflicting conclusions from different sources.
A consolidated platform eliminates this. When your behavioral data, feedback data, and monitoring data all live in the same place, you get faster insights, cleaner data, and fewer vendor contracts to manage.
Step 5: Evaluate scalability, not just current fit
Your CX analytics needs will grow. The questions your team is asking in six months will be more complex than the ones they're asking today.
Look for platforms that offer:
Flexible pricing plans that grow with your data volume
Self-service tools for business users, so insights aren't locked behind a data team
AI-powered features that reduce the manual work of analysis over time
Enterprise-grade security, compliance, and data governance when you need it
Step 6: Prioritize adoption
The most sophisticated tool is useless if your team doesn't use it. Before you commit, ask yourself: Will our analysts, product managers, UX designers, and marketers all get value from this platform?
Look for:
Immersive visualizations that make behavioral data accessible to non-technical users
AI features that surface insights automatically, without requiring deep analytics expertise
Clean, intuitive interfaces that don't require weeks of training to navigate
Strong onboarding support and a customer success team that stays engaged beyond launch
Conclusion
The best CX analytics tool isn't the one with the longest feature list. It's the one that closes the gap between what your customers do and why they do it, and gives your team the clarity to act fast.
Every business on this list is solving a slightly different problem. Some need to understand why conversions are dropping. Others need to reduce churn, capture feedback at scale, or connect behavioral data across a fragmented stack. The right tool depends on where your biggest blind spots are today, and where you need to be in six months.What the best teams have in common isn't the tool they chose.
It's how they use it: connecting behavioral data with feedback, tying friction points to revenue impact, and building workflows that turn insight into action.Start with the question you can't currently answer. The right platform will help you answer it, and every question that follows.
Frequently asked questions about CX analytics tools
Customer experience analytics is the process of collecting and analyzing data about how users interact with your digital products, from clicks and scrolls to feedback and errors. It helps teams understand not just what users do, but why they do it, so they can remove friction and improve outcomes.
![[Visual] Contentsquare's Content Team](http://images.ctfassets.net/gwbpo1m641r7/3IVEUbRzFIoC9mf5EJ2qHY/f25ccd2131dfd63f5c63b5b92cc4ba20/Copy_of_Copy_of_BLOG-icp-8117438.jpeg?w=946&q=85&fit=scale&fm=avif)
We’re an international team of content experts and writers with a passion for all things customer experience (CX). From best practices to the hottest trends in digital, we’ve got it covered. Explore our guides to learn everything you need to know to create experiences that your customers will love. Happy reading!
![[Visual] What is Contentsquare - header](http://images.ctfassets.net/gwbpo1m641r7/520cmRL5dDNOrfb9OOPCSW/a770ce55ac2daeb24d9f221d5817abd6/What_is_Contentsquare_header.png?w=624&q=85&fit=scale&fm=avif)