
This article covers 10 AI platforms that help digital marketing, product, and ecommerce teams identify and remove conversion blockers—the friction points, errors, and experience gaps that stop users from completing a purchase, sign-up, or other high-value action—so you can prioritize the right fixes and connect them to measurable business outcomes.
Key insights
A conversion blocker is any element that stops users from completing an action like a purchase or sign-up—and identifying one requires more than just funnel data (the metrics showing how many users complete each step in a sequence)
The best platforms combine behavioral evidence (showing what users did) with decision acceleration (tools and features that help you prioritize what to fix first)
Real AI automation means the platform detects patterns automatically, clusters similar issues across thousands of sessions, and lets you ask questions in plain English
Prioritizing which blocker to fix first requires connecting friction signals to actual revenue impact, not just fixing whatever seems broken
Proving ROI means tracking both behavioral changes (like rage clicks dropping) and business outcomes (like conversion rates rising)
10 best AI platforms for conversion blockers
The platforms below fall into 2 complementary categories you should think about together, not as separate choices.
Behavioral evidence tools show you what users did and where they got stuck. This means session replay, heatmaps, journey views, funnel analysis, and friction signals like rage clicks (repeated rapid clicks indicating frustration) and dead clicks (clicks on non-interactive elements).
Decision acceleration tools help you act faster with less manual work. This means AI summaries, anomaly alerts, impact estimates, and automatic clustering of friction patterns.
The most effective approach combines both categories, because knowing where users drop off only helps when you also know why.
1. Contentsquare
Contentsquare is an experience intelligence platform built for teams that need to move from drop-off data to a confirmed, prioritized fix without requiring a dedicated analyst for every investigation. It covers both behavioral evidence and decision acceleration in one platform, making it practical for cross-functional teams across ecommerce, product, and digital marketing.
How to use it: Say your checkout funnel is losing users at the payment step. You'd start with funnel data to confirm the drop-off rate (the percentage of users who exit without completing) at payment. Next, you'd watch session recordings to see what users actually experienced—perhaps discovering that an error message appears briefly then disappears, confusing users about whether their card was accepted. AI-powered summaries would then cluster patterns across hundreds of sessions, revealing that most drops involve this same error pattern. Finally, impact quantification would show this blocker costs you a specific amount in lost revenue monthly, making it priority one over other backlog items.
Session replay and AI summaries
When users abandon at a specific step, you need to see what they actually experienced to understand why they left. Session replay addresses this by letting you watch recordings of real user sessions to see exactly where users hesitate, rage-tap, or abandon. Reviewing individual sessions takes too much time at scale—this is where AI-powered summaries help. AI-powered summaries are automated analyses that cluster similar patterns across multiple session recordings, identifying common friction points without manual review.
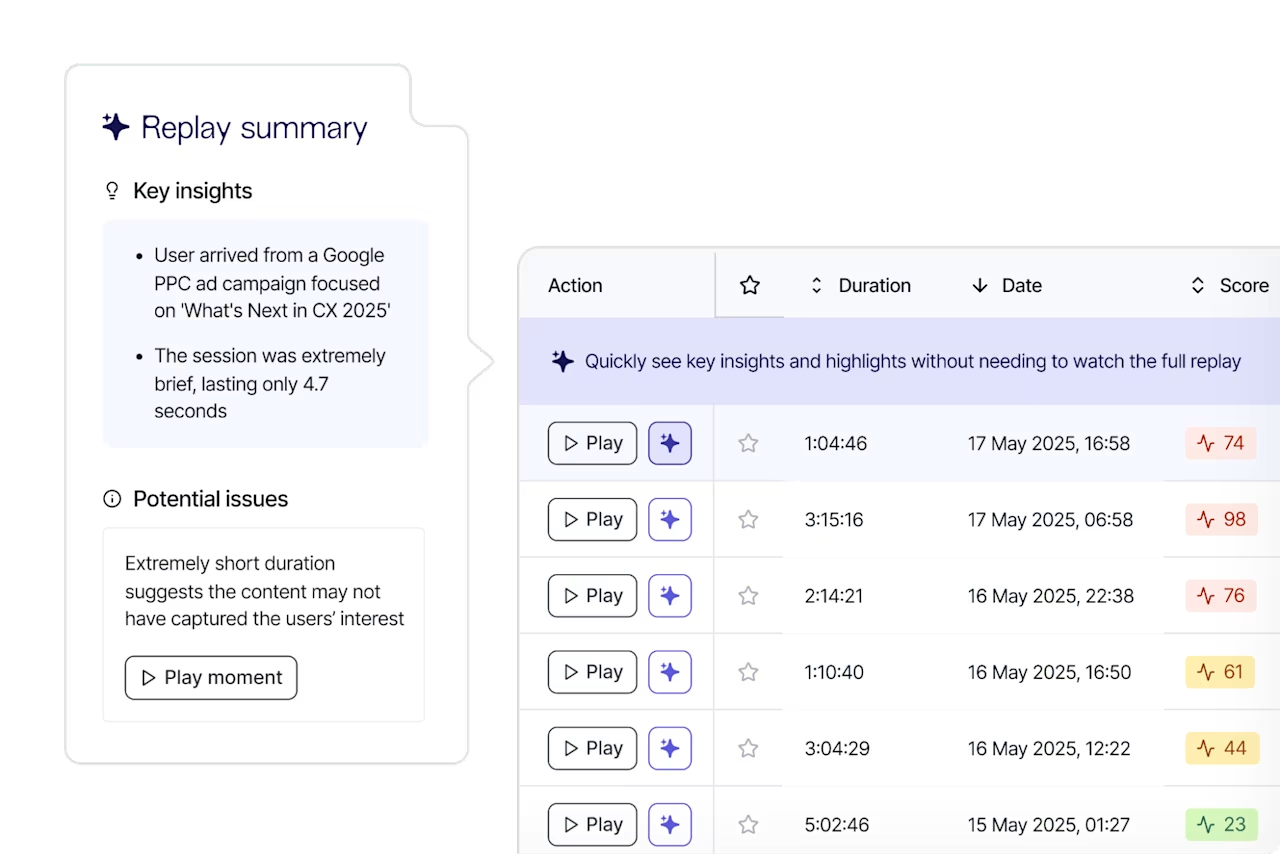
The Contentsquare platform includes session replay with AI-powered summaries that automatically identify patterns across recordings. The event stream—a chronological log of every user interaction in a session, including clicks, gestures, and errors—shows every action in order, making it possible to see not just that users struggled, but exactly what sequence of interactions led to abandonment.
Journey and funnel visibility
To fix conversion blockers, you first need to know where users are exiting in large volumes—without this, you're guessing which pages or steps to investigate. Journey analysis addresses this by showing how users move through a site or app page by page, making it possible to spot where large volumes of users exit before converting. Funnel analysis narrows this further—it isolates specific steps in a defined flow (like a checkout or sign-up sequence) so you can see exactly which step is losing users and by how much.
With Contentsquare's Journey Analysis, you can visualize how visitors progress through the site in a sunburst view—a circular visualization that shows user paths radiating from a central starting point, with each ring representing a subsequent page or step—that shows paths, bounces, and exits at each step. This bird's-eye view helps identify high-drop-off paths before drilling into session-level evidence—for example, spotting that users repeatedly visit the FAQ page mid-checkout, signaling confusion before they even reach the problem step.
![[Visual] Journey-analysis-sense](http://images.ctfassets.net/gwbpo1m641r7/3YF1vgtNFaqqWjjaxSZbgl/b37170520a1dc52508425883c909ace1/Journey-analysis-sense.png?w=1280&q=85&fit=scale&fm=avif)
Impact quantification and prioritization
Not every blocker is worth fixing immediately—you need to know which issue is costing the most in lost conversions before committing engineering or design resources. Impact quantification is a capability that connects friction signals and errors directly to conversion outcomes so you can rank fixes by business value rather than gut feel.
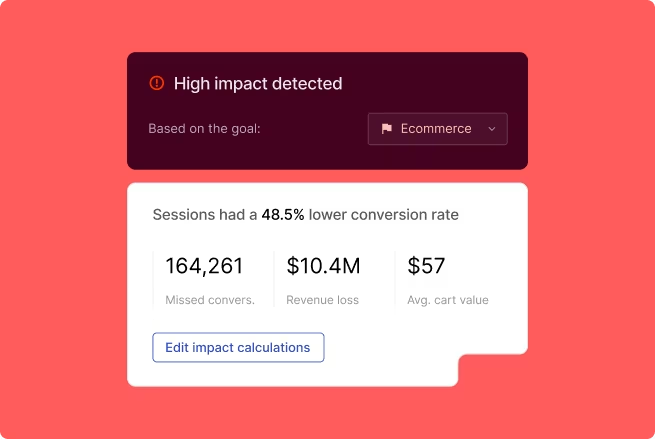
Contentsquare's Impact Quantification is a feature that calculates the revenue impact of each friction point by comparing conversion rates between users who experienced the issue and those who didn't. This transforms vague priorities into concrete business cases.
2. Fullstory
Fullstory is a behavioral data platform focused on session replay and frustration signal detection, suited to teams that want to investigate friction on specific pages or flows. It's particularly strong for teams that want to search across sessions using behavioral filters—for example, finding all sessions where a user rage-clicked on a specific element.
How to use it: Say your team suspects the email field in your sign-up form is causing drop-offs. You'd search for sessions where users clicked the email field 3 or more times, then filter for those that didn't complete sign-up. Reviewing these recordings reveals users are entering valid emails but getting an error because the field doesn't accept plus signs in addresses.
Frustration signal detection
Frustration signals are behavioral indicators that something on the page isn't working as users expect. This means rage clicks (repeated rapid clicks), dead clicks (clicks on non-interactive elements), and error clicks. Fullstory automatically captures these signals across all interactions so you can filter for them without pre-configuring event tracking.
Session search and filtering
Finding relevant sessions manually is time-consuming when you have thousands of recordings—you need a way to filter for specific user behaviors quickly. Fullstory's session search addresses this by letting you query recordings using behavioral criteria. For example, you can ask to see sessions where a user clicked the CTA 3 or more times without progressing. This reduces the time spent finding relevant sessions compared to browsing a replay list manually.
3. Quantum Metric
Quantum Metric is an enterprise-grade platform built for high-traffic digital properties that need to detect conversion (the percentage of users who complete a purchase) anomalies at scale and route confirmed issues to the right team quickly. It's particularly well-suited to organizations where product, engineering, and analytics teams need to share a single source of truth for digital performance.
How to use it: Say mobile checkout conversion suddenly drops from 3.2% to 1.8% at 2:47 PM. Quantum Metric's anomaly detection flags this within minutes, showing it affects only iOS users on version 15.2 or higher. The platform quantifies this as lost revenue per hour and provides session recordings showing a new iOS update causes the payment button to become unresponsive.
Anomaly detection and alerting
Anomaly detection monitors conversion metrics continuously and flags deviations from expected patterns—so you don't have to manually check dashboards to notice a problem. This is especially valuable for high-volume flows where a small conversion drop can mean significant revenue loss.
Revenue impact estimation
Quantum Metric connects technical issues and UX friction directly to estimated revenue impact, giving you a business case for prioritizing a fix rather than relying on qualitative judgment alone.
4. Glassbox
Glassbox is a session intelligence platform built for regulated industries—particularly financial services, insurance, and telco—where data privacy, compliance, and audit trails are as important as conversion insight. It captures every user interaction without sampling, which matters when you need to investigate a specific complaint or incident.
How to use it: Say a bank receives complaints about customers unable to complete loan applications. The compliance team uses the customer's reference number to retrieve their exact session from 3 days ago. The recording shows the user successfully filling 8 pages of forms, but on page 9, a timeout error appears after 30 seconds of inactivity.
Session capture for compliance-sensitive teams
Unlike tools that sample sessions, Glassbox captures every interaction—making it possible to retrieve any individual session for audit, legal, or customer service purposes. This is a key differentiator for teams operating under regulatory obligations.
Journey-level diagnosis
Glassbox maps user journeys across multi-step flows—like loan applications or account sign-ups—so compliance and CX teams can identify where users abandon and whether the cause is a technical error, a confusing step, or a trust issue.
5. Mouseflow
Mouseflow is a behavioral analytics platform that combines session replay, heatmaps, funnel analysis, and form analytics in a lightweight package designed for quick deployment. It's a strong fit for small to mid-sized teams that want to move beyond pageview metrics and start seeing exactly where users hesitate or exit—without a complex technical setup or a large analytics budget.
How to use it: Say your landing page has a high bounce rate despite strong ad performance. You generate a click heatmap showing that most interactions happen on a hero image that looks like a button but isn't clickable. Session recordings confirm users tap it repeatedly, then scroll down briefly before leaving. You also pull a form analytics report on your lead capture form, which reveals users consistently abandon at the phone number field—pointing to a specific fix rather than a full page redesign.
Heatmaps for quick friction checks
Before investing development time in a page redesign, you need a fast way to confirm whether friction actually exists on that page. Mouseflow offers six heatmap types—click, move, scroll, attention, geo, and live—giving you a multi-dimensional view of how users interact with any page. This makes it easy to spot areas where users are interacting with non-clickable elements or ignoring key calls to action (CTAs), and to validate hypotheses quickly before committing to a fix.
Form analytics
Forms are one of the highest-friction points in any conversion flow, yet standard behavioral tools often treat them as a black box. Mouseflow's form analytics reports show field-by-field drop-off rates, average time spent per field, and which fields users correct most often. This level of granularity makes it straightforward to identify whether a form abandonment problem is caused by a specific confusing field, an overly long sequence, or a validation error—turning a vague drop-off signal into an actionable diagnosis.
6. Microsoft Clarity
Microsoft Clarity is a free behavioral analytics tool that provides heatmaps, session recordings, and frustration signal reporting with no usage caps. It's best suited for teams that want a no-cost entry point into friction detection or want to supplement an existing analytics stack with behavioral data.
How to use it: Say you want to audit a high-traffic product page for friction signals before investing development time in redesigning it. You run Clarity's rage click report, which immediately highlights that a large percentage of sessions include rage clicks on the size chart link, which opens in a modal that's cut off on mobile devices.
Friction signals for fast triage
When you have limited budget for analytics tools but still need to identify friction quickly, you need a way to triage which pages have the most problems. Clarity addresses this by automatically reporting on rage clicks (repeated rapid clicks indicating frustration) and dead clicks (clicks on non-interactive elements) across all pages—giving you a fast, visual way to triage which pages most need investigation. Because it's free and has no session cap, it's practical for teams with limited tooling budgets.
7. Amplitude
Amplitude is a product analytics platform built around event-based data, making it particularly strong for teams that need to understand how users move through a product over time—across multiple sessions, not just a single visit. It's well-suited for SaaS and app teams investigating activation (when users first engage with a product's core feature), onboarding, or retention blockers.
How to use it: Say your SaaS product shows that most users complete onboarding but only a small percentage activate the core reporting feature within 7 days. You build a funnel in Amplitude from onboarding completion to feature activation, then segment by user properties. The analysis reveals users who joined via your integration partner activate at much higher rates while direct signups activate at lower rates.
Behavioral cohorts and funnel analysis
Not all users experience the same blockers—what stops mobile users might not affect desktop users, and what blocks paid traffic might not affect organic visitors. Understanding these differences is critical for targeted fixes. Amplitude's behavioral cohorts address this by letting you define a funnel—a sequence of events users should complete—and then measure how many users complete each step and where they fall off. Behavioral cohorts allow you to compare drop-off rates across different user segments (for example, users who signed up via a paid campaign versus organic search).
Paths to conversion loss
Amplitude's path analysis shows what users actually did before and after a key event—revealing whether users who didn't convert took a detour, hit a dead end, or simply left. This helps you distinguish between a UX blocker and a motivation gap.
8. Mixpanel
Mixpanel is an event-based analytics platform focused on helping product and growth teams understand user behavior at a granular level—particularly useful for identifying where specific cohorts drop out of a conversion flow. It's a strong fit for teams that need fast iteration on funnel hypotheses without heavy data engineering.
How to use it: Say your growth team notices mobile sign-ups underperform desktop significantly. You create a funnel in Mixpanel segmented by device type, revealing mobile users drop at the "verify phone number" step at much higher rates than desktop users. Further segmentation shows Android users fail verification more than iOS users.
Funnel analysis and segmentation
Mixpanel's funnel reports let you define a conversion sequence and immediately segment results by user properties—device, acquisition source, plan type, geography—to isolate which user groups are hitting a blocker and which aren't. This segmentation is what makes funnel data actionable rather than just descriptive.
9. Optimizely
Optimizely is an experimentation and feature management platform that helps you test fixes to conversion blockers rather than just identify them. It's most valuable as the "act and validate" layer in a conversion optimization workflow—best used after a behavioral analytics tool has confirmed what the blocker is.
How to use it: Say session replay revealed that users abandon your form when they see 12 required fields. You use Optimizely to test a progressive disclosure version that shows only 4 fields initially, revealing others as users progress. The A/B test (comparing the original to the redesigned version) runs for 2 weeks with a large sample of visitors.
Experimentation to validate fixes
Without a controlled experiment, it's difficult to know whether a change improved conversion or whether other factors (seasonality, traffic mix, campaigns) were responsible. Optimizely's A/B testing infrastructure makes it possible to isolate the effect of a specific fix with statistical confidence.
Feature flags for safe rollouts
Releasing a fix to all users at once is risky—if the change introduces a new problem, you've now affected everyone. Feature flags reduce this risk by letting you release a fix to a subset of users before rolling it out fully—reducing the risk of introducing a new blocker while trying to remove an existing one. This is especially useful for checkout or payment flow changes where a mistake is costly.
10. Dynatrace
Dynatrace is an application performance monitoring (APM) and observability platform that helps engineering and DevOps teams detect technical issues—slow page loads, API errors, JavaScript failures—and connect them to user experience and conversion outcomes. It's best suited for organizations where technical performance is a significant driver of conversion loss.
How to use it: Say conversion drops on product pages, but behavioral analytics shows normal user patterns. Dynatrace reveals that an API serving product recommendations now takes much longer to respond than it did last week. The platform traces this to a database query that's missing an index after a recent deployment.
Performance signals tied to conversion
Core Web Vitals are a set of Google-defined metrics measuring page loading speed, interactivity, and visual stability. These metrics are directly linked to conversion rates—users who experience slow or unstable pages are more likely to abandon. Dynatrace monitors these signals in real time across all pages and user segments, so performance regressions don't go undetected.
Error analysis for engineering teams
Dynatrace surfaces JavaScript errors (JS errors), API failures, and infrastructure issues at the code level—giving engineering teams the diagnostic detail they need to fix a blocker quickly, rather than working from a vague "something seems broken" report from a behavioral analytics tool.
How do you pick the best AI platform for conversion blockers?
Most platforms in this space claim to be "AI-powered"—but what that means in practice varies significantly. The right question isn't "does it use AI?" but "what does the AI actually do for my team?"
Consider these criteria before committing to a platform:
1. Coverage across blocker types: Can it detect UX friction, technical errors, performance issues, and content gaps, or does it specialize in just one area?
2. AI automation depth: Does the AI merely generate reports, or does it proactively surface issues you didn't know to look for?
3. Integration with your stack: Will it connect with your existing analytics, testing, and development tools to create a unified workflow?
4. Time to insight: Can non-technical team members get answers quickly, or does every investigation require an analyst?
5. Compliance and privacy: Does it meet your industry's regulatory requirements while still capturing enough detail to be useful?
What conversion blocker types should the platform detect?
A conversion blocker can take one of 4 forms: UX friction means confusing interfaces that frustrate users. Technical errors means broken functionality that prevents progress. Performance issues means slow loads that test patience. Content and clarity gaps means missing information that creates doubt.
Blocker type | What to look for in a platform |
|---|---|
UX friction | Rage click detection, dead click detection, form field drop-off analysis, scroll depth signals |
Technical errors | JavaScript error tracking, API error monitoring, error impact on conversion |
Performance issues | Core Web Vitals monitoring, page speed by segment, real user monitoring (RUM) |
Content and clarity gaps | Session replay with behavioral context, on-page feedback, exit surveys |
The Contentsquare platform exemplifies full-spectrum detection through its Error Analysis capability—a feature for tracking and categorizing JavaScript, API, and custom errors across user sessions—that tracks these errors while connecting each to conversion impact. Its Web Performance monitoring—a capability that tracks page speed and Core Web Vitals in real time—shows exactly how performance affects business outcomes.
![[Visual] examples core web vitals](http://images.ctfassets.net/gwbpo1m641r7/1vFPo3Ldz2XKO1ZL6PIVzn/aac81a0220e6ddba7338a13e587b5b33/examples-cwv.png?w=946&q=85&fit=scale&fm=avif)
What should AI automate for you?
The word "AI" is used loosely across this category—some platforms use it to mean automated anomaly alerts, others use it to mean natural language querying, and others use it to mean predictive personalization. Three specific AI functions are genuinely useful for blocker detection:
Automated detection: the platform flags friction patterns, errors, or anomalies without you having to build a report first
Insight clustering: the platform groups similar sessions or events so you can see patterns across thousands of users, not just individual cases
Natural language querying: the platform lets you ask a question in plain English and returns a relevant analysis—reducing the need for a dedicated analyst
Sense is Contentsquare's AI-powered assistant that enables natural language querying—you can ask questions in plain English and receive instant analysis across multiple data sources. Rather than requiring SQL knowledge or manual report building, Sense translates natural language into complex queries and proactively surfaces the most relevant patterns you might not have thought to look for.
How do you find conversion blockers with an AI platform?
Having a platform is only half the answer—the other half is a repeatable process for moving from "we see a drop-off" to "we know what to fix and why."
Where should you look first?
The starting point is always your highest-traffic, highest-value flows—checkout, sign-up, lead form submission, onboarding. Funnel analysis (a view of how many users complete each step in a defined sequence) makes it possible to rank flows by drop-off volume and conversion impact, so you're not guessing which flow to investigate.
Look for these patterns:
High drop-off rate at a specific step: suggests a UX or technical blocker at that point
Sudden drop versus consistent drop: a sudden change points to a recent technical issue or deployment; a consistent drop points to a structural UX problem
Mobile versus desktop divergence: a blocker that only affects one device type often points to a responsive design issue or a platform-specific error
How do you confirm the blocker?
Funnel data tells you where users drop—but not why. Confirming the blocker means gathering behavioral evidence at the specific step where users exit.
Use these 2 complementary methods:
Session replay: watch recordings filtered to sessions where users dropped at the identified step—look for hesitation, repeated interactions, or visible errors
Heatmaps: overlay click and scroll data on the page to see whether users are interacting with the right elements or getting distracted, confused, or stuck
AI-powered session summaries can reduce the time this takes—instead of watching dozens of recordings, the platform clusters common patterns and surfaces the most representative examples. With Contentsquare's Session Replay, the AI-powered summaries analyze hundreds of sessions simultaneously, identifying that most drops involve the same interaction pattern. The event stream shows every click, gesture, and error chronologically, revealing not just the final abandonment but the growing frustration that preceded it.
How do you prioritize what to fix?
After confirming a blocker, the next question is whether it's worth fixing now—because teams always have more issues than capacity.
Consider these 3 factors:
Volume: how many users are affected by this blocker per week?
Conversion impact: what is the estimated lift if the blocker is removed?
Effort to fix: is this a copy change, a design update, or an engineering sprint?
Impact quantification—a capability that connects friction signals and technical errors to conversion and revenue outcomes—helps teams make this call with data rather than instinct. The Contentsquare platform's Impact Quantification capability calculates the business value of removing each blocker by comparing conversion rates between affected and unaffected users, enabling teams to rank fixes by revenue potential and answer "which blocker costs us the most?"
How do you prove ROI after you remove conversion blockers?
Removing a blocker is only half the job—you also need to show that the fix worked and quantify the lift. This matters both for validating the change and for building internal confidence to keep investing in experience optimization.
Which metrics change when blockers are removed?
Track these 5 metrics before and after the fix:
Step completion rate: the percentage of users who complete a specific step in a funnel—an increase confirms the blocker at that step is resolved
Rage click rate: a drop in rage clicks on a specific element confirms users are no longer frustrated by it
Error rate: a reduction in JavaScript or API errors on a page confirms the technical fix was effective
Abandonment rate: a drop in abandonment at the previously blocked step confirms users are now progressing through the flow
Overall conversion rate: the ultimate downstream signal—an increase here confirms the fix had real business impact
Metrics should be measured before and after the fix using the same time window and traffic mix, to avoid confounding factors like seasonality or campaign changes.
How do you report wins to stakeholders?
Stakeholders—particularly those outside the digital team—respond better to business outcomes than behavioral metrics. Use this framework for translating blocker removal into a business narrative:
1. The problem: what was the blocker, where was it, and how many users were affected?
2. The evidence: what behavioral data confirmed it was a real blocker (not just a hypothesis)?
3. The fix: what was changed, and how was it validated?
4. The result: what changed in conversion metrics after the fix, and what does that mean in revenue terms?
AI-generated reports or automated dashboards can save time—rather than manually compiling data, you can pull a summary that shows before-and-after performance at the step level. Post-fix surveys through Contentsquare's Surveys capability—a feedback collection feature that lets you ask users questions at specific points in their journey—can capture whether users now feel the experience is easier, adding qualitative confirmation to quantitative lift data.
Frequently asked question about the best AI platforms for conversion blockers
A conversion blocker specifically prevents users from completing a high-value action like a purchase or sign-up, while a general usability issue may create friction but doesn't necessarily stop conversion. Conversion blockers have direct, measurable impact on business outcomes, making them higher priority for optimization efforts.
![[Visual] Contentsquare's Content Team](http://images.ctfassets.net/gwbpo1m641r7/3IVEUbRzFIoC9mf5EJ2qHY/f25ccd2131dfd63f5c63b5b92cc4ba20/Copy_of_Copy_of_BLOG-icp-8117438.jpeg?w=946&q=85&fit=scale&fm=avif)
We’re an international team of content experts and writers with a passion for all things customer experience (CX). From best practices to the hottest trends in digital, we’ve got it covered. Explore our guides to learn everything you need to know to create experiences that your customers will love. Happy reading!
![[Stock] Digital intelligence solutions: exploring advanced solutions for businesses — Cover Image](http://images.ctfassets.net/gwbpo1m641r7/3lq9tRa7tIui8K0IO9DmcG/ff563fd0b9cdeb461d91c2a4dbabb18c/digital-intelligence-solutions-woman-tablet-1.jpg?w=624&q=85&fit=scale&fm=avif)
![[Asset] Blog — AI-referred traffic Hero](http://images.ctfassets.net/gwbpo1m641r7/2rkGm0XqF2971lPIa2dIXL/699b4b8ff946438773996ca09e304d34/AdobeStock_920265101.png?w=624&q=85&fit=scale&fm=avif)