Heatmaps, evolved
Make revenue-driven decisions from how users click, tap, hover, scroll and where they hit frustration on any page.
Prefer to ask AI? Connect your heatmaps to ChatGPT, Claude or Copilot and get instant answers straight in your AI tool — no login, no dashboards.
Trusted and used by 1.3+ million websites and apps
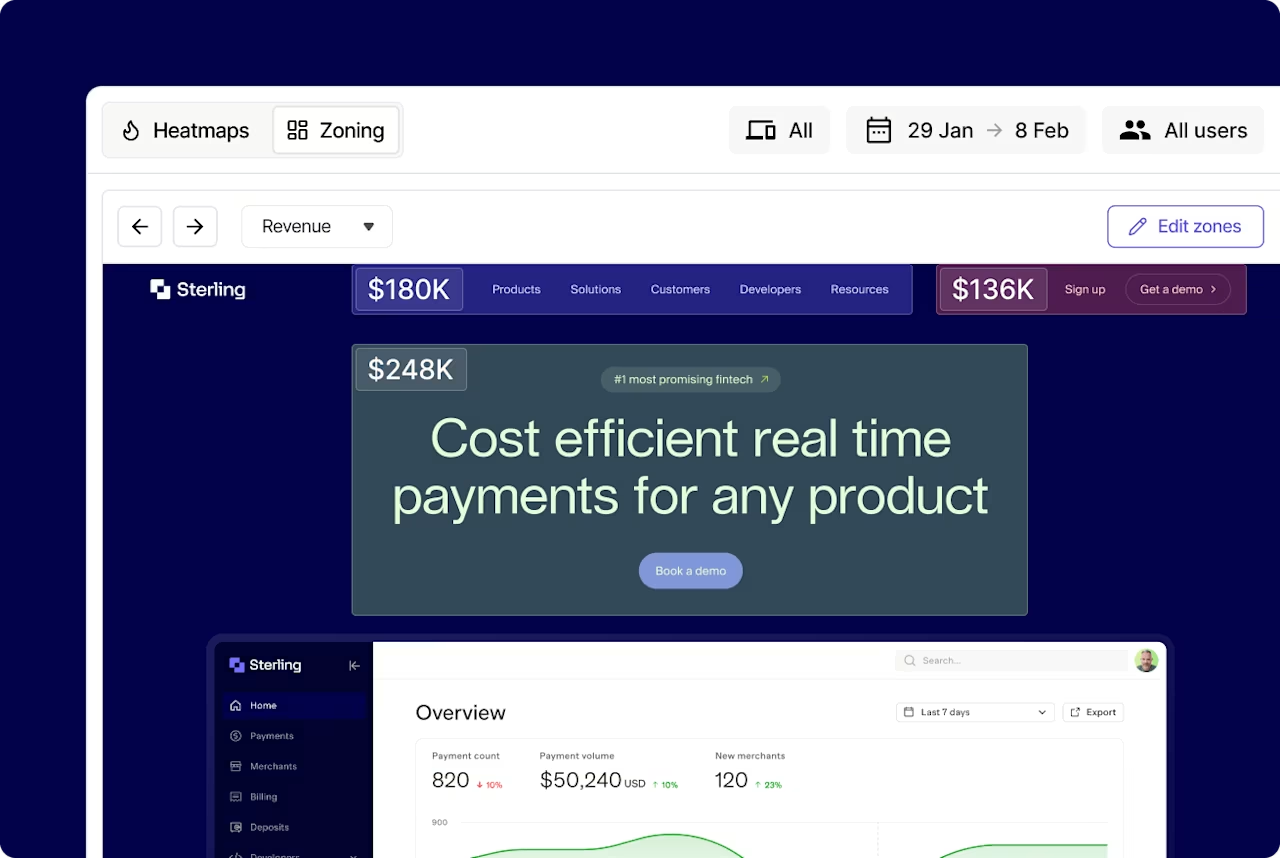

Learn where users click, tap, hover, scroll, or experience frustration on any page

See which parts of the page lead to drop-offs, conversions, or sales

Make informed decisions on how to restructure page content for more clicks and conversions
See how your content affects attention, conversions, and revenue
Visualize page element outcomes to make fast decisions
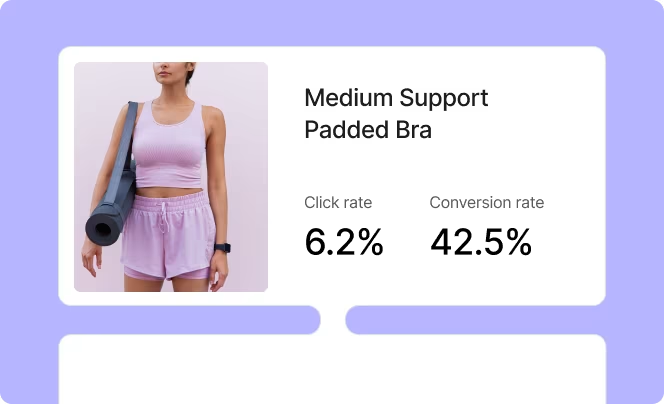
Discover the exposure, click, and conversion rate of each page element, as well as revenue attribution. Easily share your analysis with digital teams and key stakeholders, then use your findings to create successful journeys.
![[Visual] File — two-columns-feature-placeholder-1 - Zoning experience and revenue attribution](http://images.ctfassets.net/gwbpo1m641r7/5ELMCzDenXvDdRmgYUkfyO/019e4a34ebb968bbf30f10165416decb/Experience_and_revenue_attribution.png?w=1280&q=85&fit=scale&fm=avif)
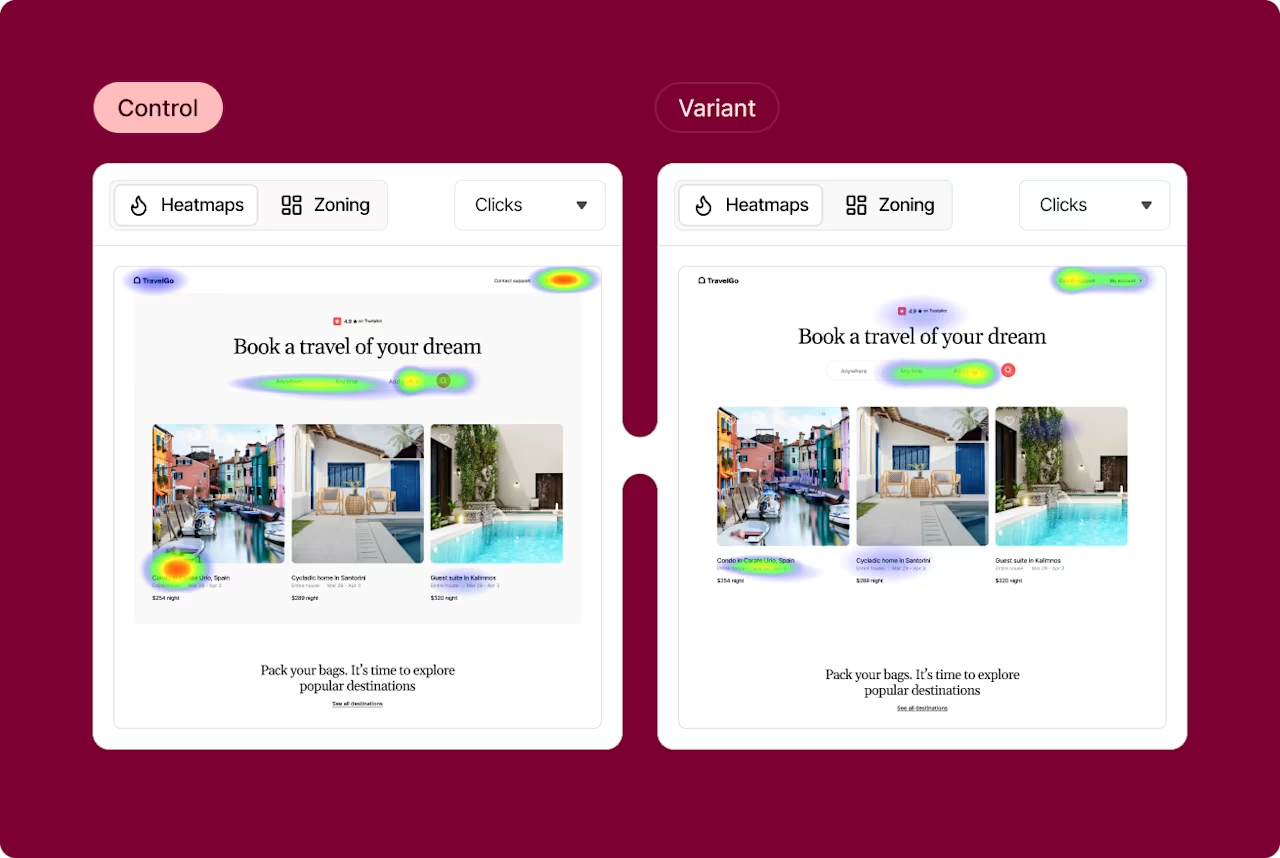
Quickly analyze A/B test performance
Understand at a glance which A/B tests performed better and why. Learn the impact of different user behaviors and optimize pages based on what brings your business the most value.
Measure and optimize form interactions
Discover where and why customers struggle to complete forms. Fine-tune forms at important points of conversion (like checkouts) to remove friction and get more customers across the finish line.

Optimize your pages based on helpful behavior insights
Find out which page elements deliver the best outcomes
Traditional heatmaps show you which page elements get the most clicks. Zone-based heatmaps go further, showing how each element contributes to goals like conversions and revenue. Find out which images and links drive your desired outcomes, then optimize customer journeys to highlight them even further.
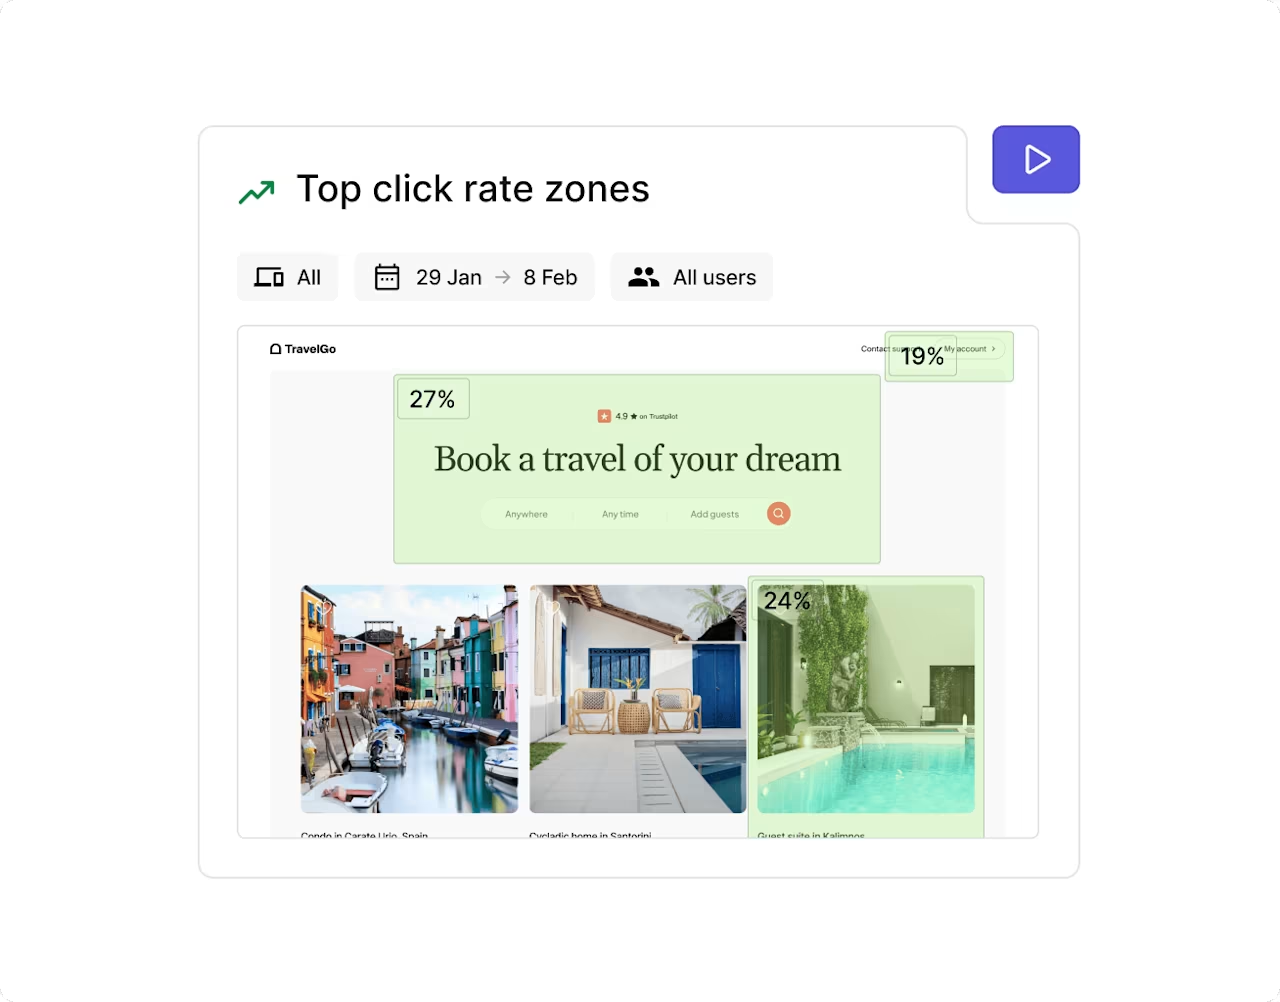
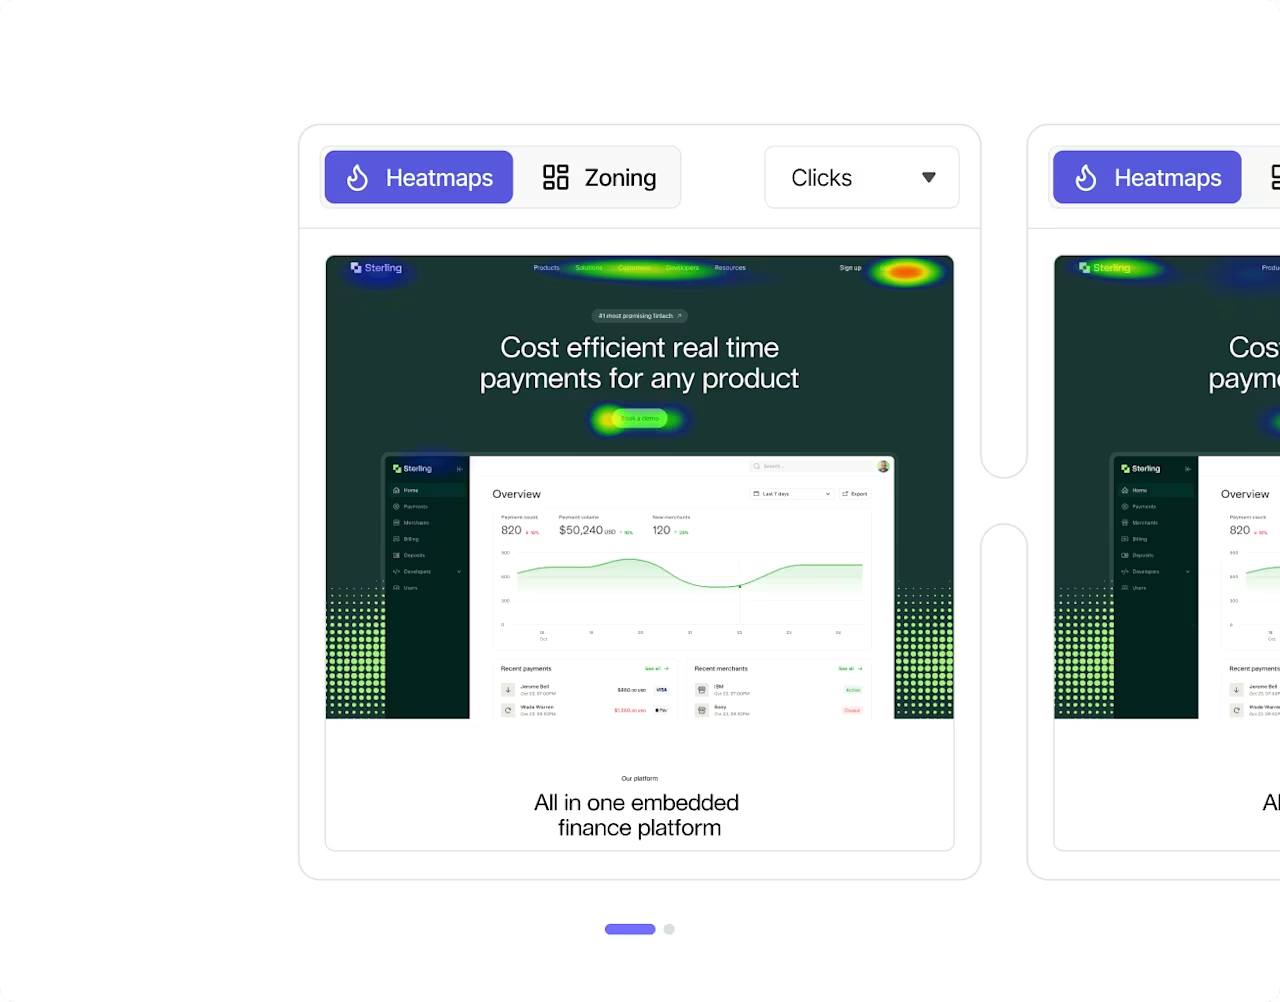
See how different page elements stack up in different scenarios
Want to learn more about your content? Try viewing different zone-based heatmaps side-by-side. Compare heatmaps from different time periods, traffic sources, and more to see how audiences performed. Or compare two heatmaps from your A/B tests to understand why one variant outperformed the other.
Understand which parts of your forms are confusing or frustrating users
Use form analysis to see helpful metrics, like how many users completed the form or dropped off. Find out which fields are often left blank, and check heatmaps to see signs of struggle. Jump to related session replays to see users navigating forms in real time (with their personal details hidden automatically by Contentsquare).

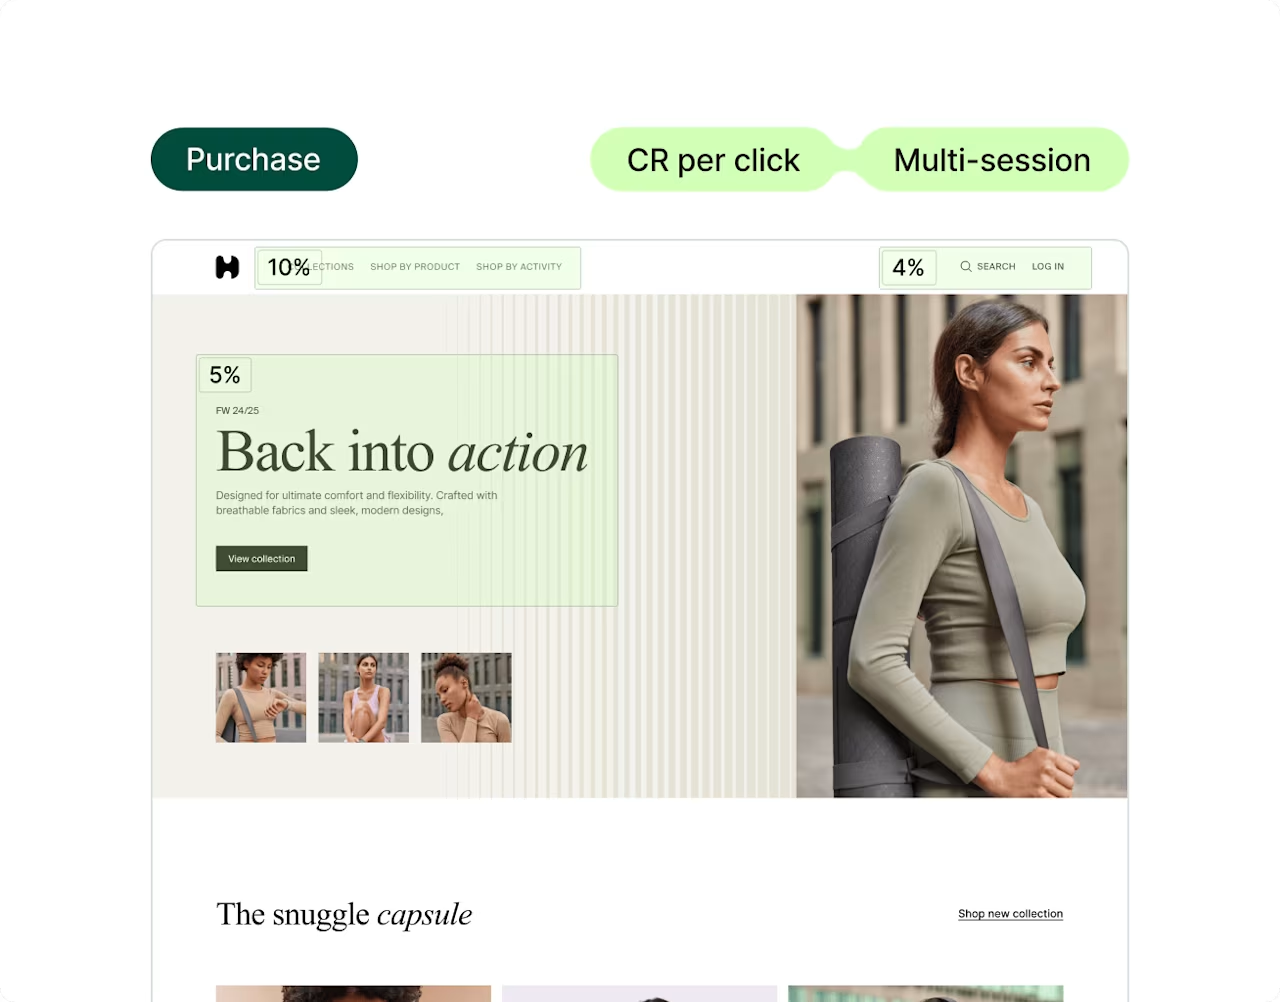
Zone-based heatmaps break down behavior from repeat visitors
See how page elements affect behavior across sessions—like when users visit multiple times before purchasing. Understand which page elements get clicked most by repeat visitors, and which ones generate the most purchases over time.

Discover more
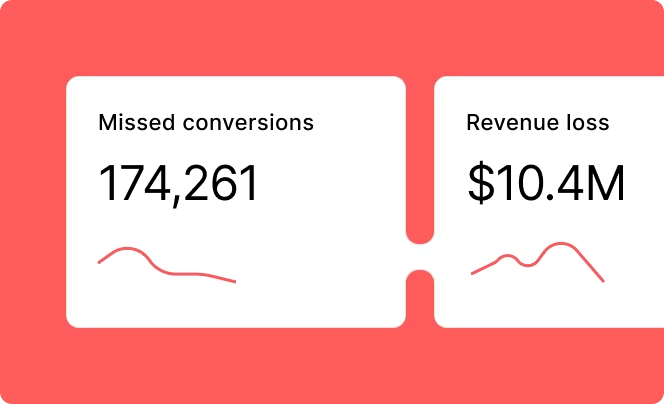
See which improvements could make the most difference to your business outcomes.
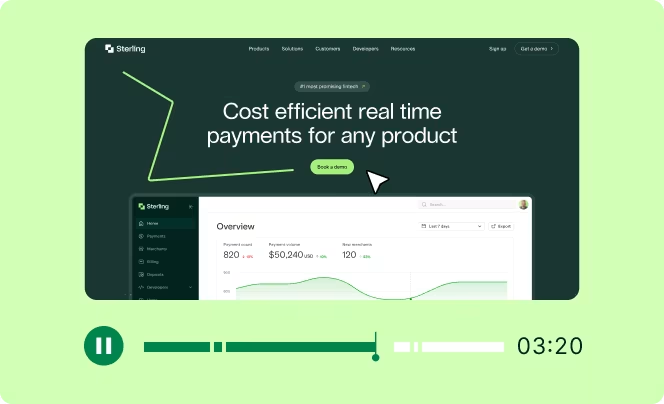
Replay key moments across any journey and quickly spot friction, errors, and behavior patterns with AI-powered summaries.
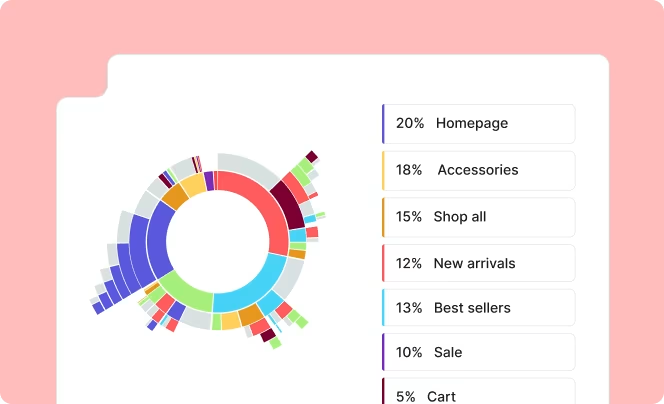
See how customers move through your site or app, where they drop off, and which paths lead to conversion and return visits.
Boost revenue from key placements by understanding the driving factors impacting your product, brand, and category sales.