![[Visual] people in office](http://images.ctfassets.net/gwbpo1m641r7/2ofuZJ2oQCigPCfbhLApn6/df2c6559a213fe2044a292cfd809a7b1/Why_you_need_to_host_an_anxiety_party__1_.png?w=3840&q=100&fit=fill&fm=avif)
Getting visitors to your website is only half the battle. Once they arrive, you need to find ways to engage users and keep them around.
Website engagement tracking helps you determine what’s working and what isn’t for users on your site. But it’s more nuanced than just monitoring a few key metrics, and can quickly feel overwhelming.
This guide gives you an overview of website engagement tracking, its benefits, and metrics worth tracking.
You’ll walk away equipped with ideas and a roadmap on how to better track your website’s engagement, so you can improve the user experience (UX) and product experience (PX), and boost your revenue.
What is website engagement tracking?
Website engagement tracking is when you collect and monitor data on how users interact with your site. To gather this insight you can pair metrics—like average time on page—with monitoring tools—like session replay tools.
This type of website tracking lets you make data-driven decisions and helps you answer questions like
What draws users to my website?
Where are my users on their customer journey?
What’s frustrating to my users?
What UX and user interface (UI) design elements increase the time visitors spend on my site?
What’s causing users to leave my site?
Getting answers to the above questions lets you dive deeper into user behavior and find ways to improve the UX and PX of your site.
For example, one indicator of a website’s success is whether people find its information interesting, helpful and/or relevant. To determine if users find your site’s information useful you might look at metrics like engagement rate, time spent on page, and pages per session.
Then, analyze session recordings of users in real-time on your site to see how they actually engage with your content so you can spot areas you may need to improve.
The benefits of website engagement tracking
The website engagement tracking process lets you get to know your users and their needs better than ever, so you can customize and optimize your web design, content, and copy to meet and exceed your company’s engagement or conversion goals.
Specific benefits include:
Better understand your users’ preferences: your goal is to make the user experience as frictionless as possible so visitors have a great experience and stay on your site. Website engagement tracking helps you determine which UI design elements—like layouts, buttons, menus, and visuals—streamline your visitors’ experience.
See what you’re doing well: analyzing metrics helps you understand what’s working—so you can leverage this information to optimize other pages on your site. For example, if page views are exceptionally high for your services page, you could look at feedback responses to see what users love, or send out a survey to ask specific follow-up questions.
Discover why users are leaving your site: you can’t know why users leave your site unless you ask. So, if your engagement rate—the percentage of people who interact with your site—is lower than usual, use exit-intent surveys to ask users why they’re leaving. Then, use heatmaps to see exactly which page elements are getting overlooked and confuse visitors.
Determine if new marketing efforts are working: compare a new marketing campaign’s engagement metrics with historical data to see how well the campaign is performing.
Long story short: tracking website engagement benefits a wide range of teams and activities. It helps your marketing teams track campaign performance, gives your sales department a better understanding of what leads need, and provides insights that let your product teams improve UX.
📈 Real results of website engagement tracking
Alex George is the founder of Mountains Wave, a marketing and web design agency, and the Head of Marketing at Hint Health, which offers membership management and billing software for healthcare companies.
In both roles, he pays close attention to website engagement metrics, and he’s seen ongoing benefits—not just for Mountains Wave and Hint, but for the customers they serve, like
A stickier product with more loyal and engaged customers
Streamlined sales and onboarding experiences
A more customer-centric business model
Alex says: “By tracking user engagement, we can see how our customers engage with our website and software at Hint, providing valuable insight and direction to our growth and product teams.”
A 5-step roadmap to effectively track website engagement
To get the most out of tracking, you have to follow an intentional, multi-step process that lets you gather engagement data, use it to understand your customers, and then improve the customer experience (CX).
Let’s look at the complete website engagement tracking process and learn how to leverage it to improve outcomes for your company and users.
1. Implement a user-centric thinking process
Getting into a user-centric mindset lays the foundation for website engagement tracking. Why? Because positive outcomes for your company always start with a positive experience for your user.
Your company will always have problems to solve—and this empathy-driven process helps you develop solutions, test, and iterate, so you can create a website that provides your users with a brilliant product experience.
Here are 3 ways to implement a user-centric thinking process within your team:
Fully understand the user journey: mapping and analyzing the customer journey helps you visualize all the touchpoints a user has as they engage with your brand and product—so you can better understand their emotions and needs along the way.
Keep an open mind to your users’ preferences and pain points: you may think you know what your users want and need—but it may be something else entirely. With a growth mindset, you’ll be prepared for the data that helps you make changes to your site and open to testing out new website engagement strategies.
Take an empathetic approach: empathy means you step into your customers’ shoes and fully imagine what they’re thinking and feeling. Approaching your customer’s experience with empathy means making website choices based on what they need versus what you want to share.
2. Build your website engagement tracking tech stack
You need 2 types of tools to track website engagement: ones that collect quantitative data and ones that collect qualitative data.
Website analytics tools like Google Analytics (GA4) or web analytics platforms like Contentsquare will collect quantitative data on your site where you can get insight like which pages people visit, how long they stay, the conversion rate of each page, and more.
Then, use website engagement tools like Contentsquare’s Heatmaps and Session Replay to dig into the context behind your qualitative data and understand why users behave the way they do.
For example, say your analytics tell you that people are leaving your homepage after only 15 seconds. You won’t know why unless you can see what users do when they land on your homepage.
Watching replays of your homepage helps you notice that people miss your calls-to-action. As a result, they aren’t clicking onto other pages within your site and leave before they can get to know your business. This extra context helps you pinpoint which changes will benefit your site the most.
💡Pro tip: using one platform for both website engagement tracking and web analytics can make your life a lot easier.
Contentsquare brings web analytics and engagement tracking together in one powerful platform—no more jumping between tools.
You can see right away when users drop off, dig into the relevant session replays and heatmaps to find out why, and make quick adjustments. It’s a simpler, faster way to understand what’s happening on your site and how to make things better for your users.

Contentsquare gives you the what and the why of website engagement at a glance
3. Determine the right metrics to track
The top website engagement metrics to track include:
Average time on page: this is the average amount of time users engage with a single page on a site. You may want to consider digging into pages with lower-than-average time, as these pages could be less engaging than others.
Average session duration: average session duration measures the length of time—in seconds— that a typical visitor spends on your site from the moment they enter to when they leave (and includes all pages within their visit).
Pageviews: a pageview happens when a user visits or re-visits a page on your site. This is different from the ‘page visits’ metric, which measures when a visitor lands on your site from an external source. Sorting pages by pageviews might help you prioritize which pages to fix first (e.g. you may want to prioritize pages with a high number of visitors to try and retain and convert that traffic).
Pages per session: this metric shows the number of pageviews divided by the number of sessions, which reveals the approximate number of pages a single user views in a session. Look at this metric to see if users are clicking around your site and engaging with your content.
Engagement rate: Google Analytics calculates the engagement rate as sessions that last for longer than 10 seconds, have a key event (a conversion), or have at least two pageviews. Pages with high engagement rates likely have good messaging and UX. Try to pinpoint why these pages perform well and apply the same strategies to pages with lower engagement rates.
Exit rate: exit rate is the total number of people who leave your site from a particular page. Pages with high exit rates may not be meeting user expectations.
Clicks and scroll depth: clicks tell you how many people click on the links within your content and scroll depth tells you how far users scroll. Both metrics help you understand whether your site is engaging, where users drop off, and which areas need better optimization.
Returning users: a high number of returning users can signal good user experience and retention. It’s also worth comparing how returning users engage with your site versus new users. Returning visitors are likely familiar with your site while new ones aren’t. And comparing the two can help you spot areas where new users get stuck.
New users: this metric helps you understand the performance of your digital marketing strategy and how many unique visitors your strategy produces. Dive deeper into this metric to see the sources of new users to better understand where people come from (i.e., social media, search engines, email newsletters, etc.) and which activities produce engaged traffic.
New contacts and subscribers: define the ROI of your site by tracking the number of leads it produces.
Remember: the metrics you track depend on your company and user goals. If you aim to drive organic traffic to your blog through an SEO content strategy, you might prefer to track new users and page views. Whereas if you’re an ecommerce company, you might prefer to track conversion rates.
4. Figure out the ‘why’ behind user behavior
Engagement tracking metrics only tell part of the story. For example, say you look at your metrics, and your site’s average time on page is 42 seconds. That information means next to nothing without context, such as
What’s your goal for average time on page?
Is that number higher or lower than last month’s? Why?
How does that number connect to your campaigns?
What’s a solid benchmark for your industry?
What can you do to continue to improve this metric?
But for website engagement tracking to be meaningful, you also have to look into the how and why of user behavior.
Capabilities like heatmaps and session replays provide valuable insights, showing you how real users interact with your site.
Say your average session duration is up, but your engagement rate is down on your pricing page. Users are exploring your site, but leaving as soon as they make it to the point of conversion. Now’s the time to look into why.
Heatmaps let you visualize where visitors are lingering on your site, so you can see which elements they might be missing. Scroll maps let you see how far down the page users get before bouncing, illuminating potential problem areas.
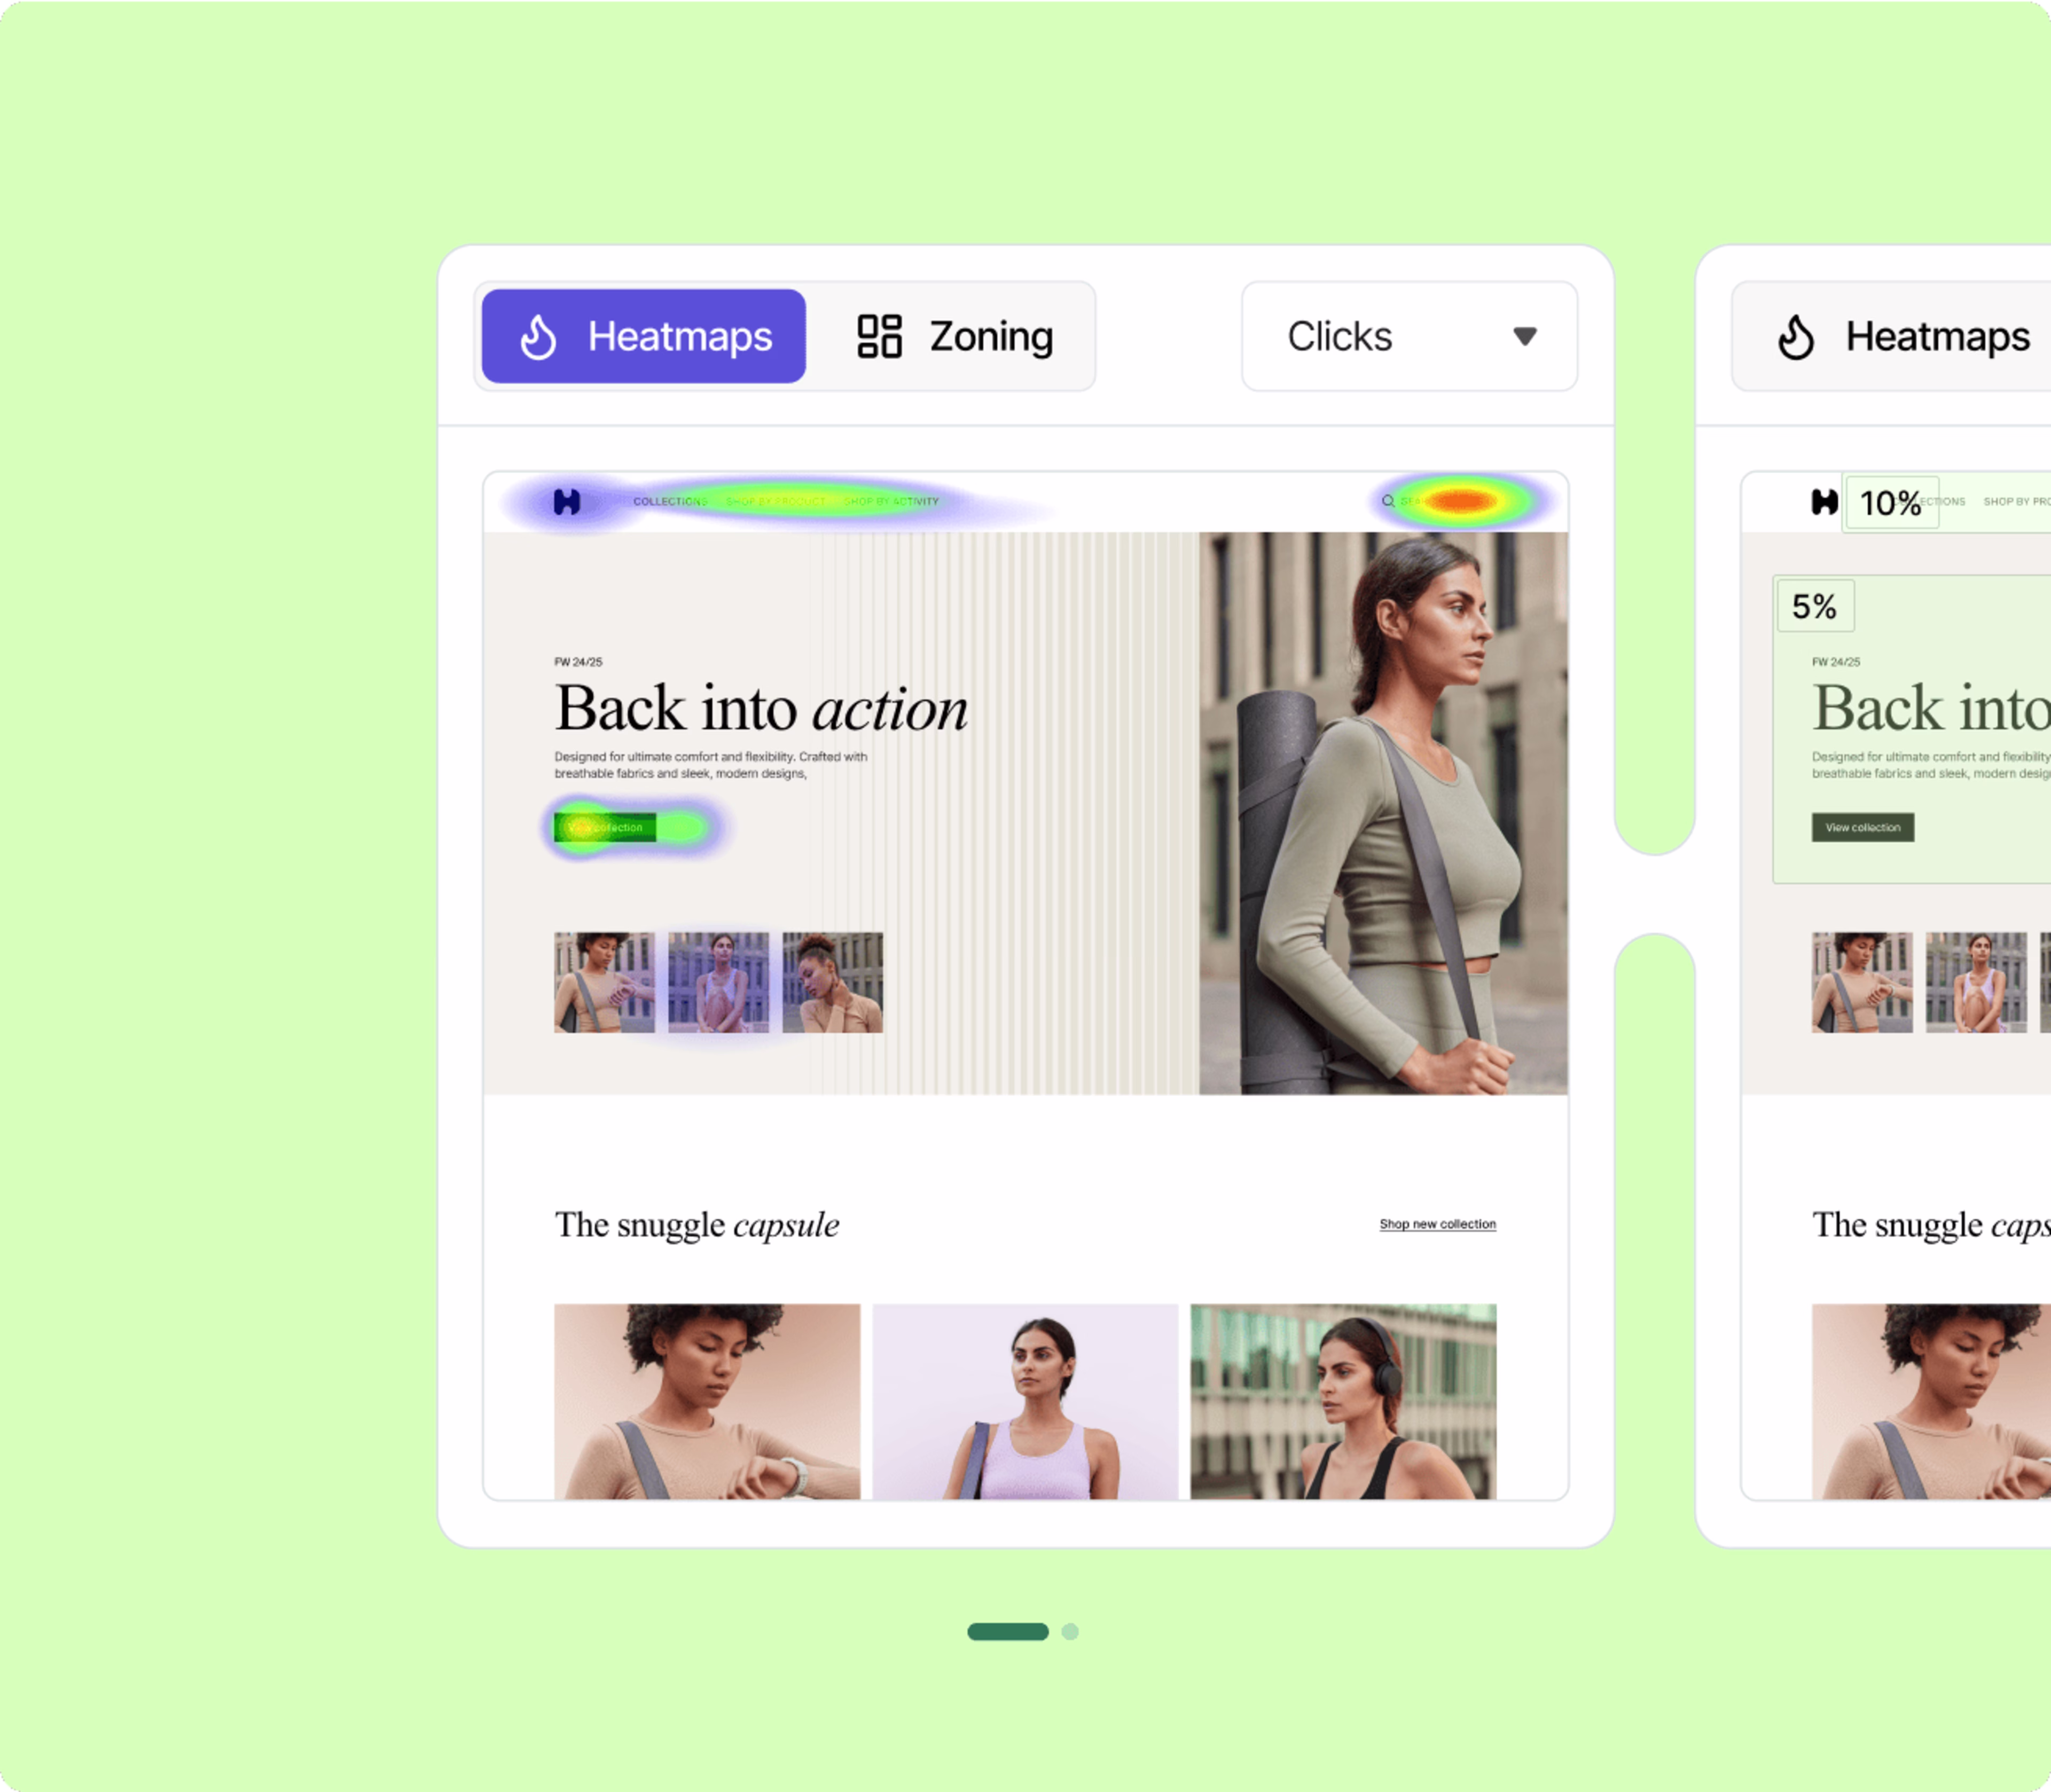
An example of a Contentsquare heatmap
And replays let you watch users as they navigate your site, so you can spot bugs that make them ‘x’ out in frustration.
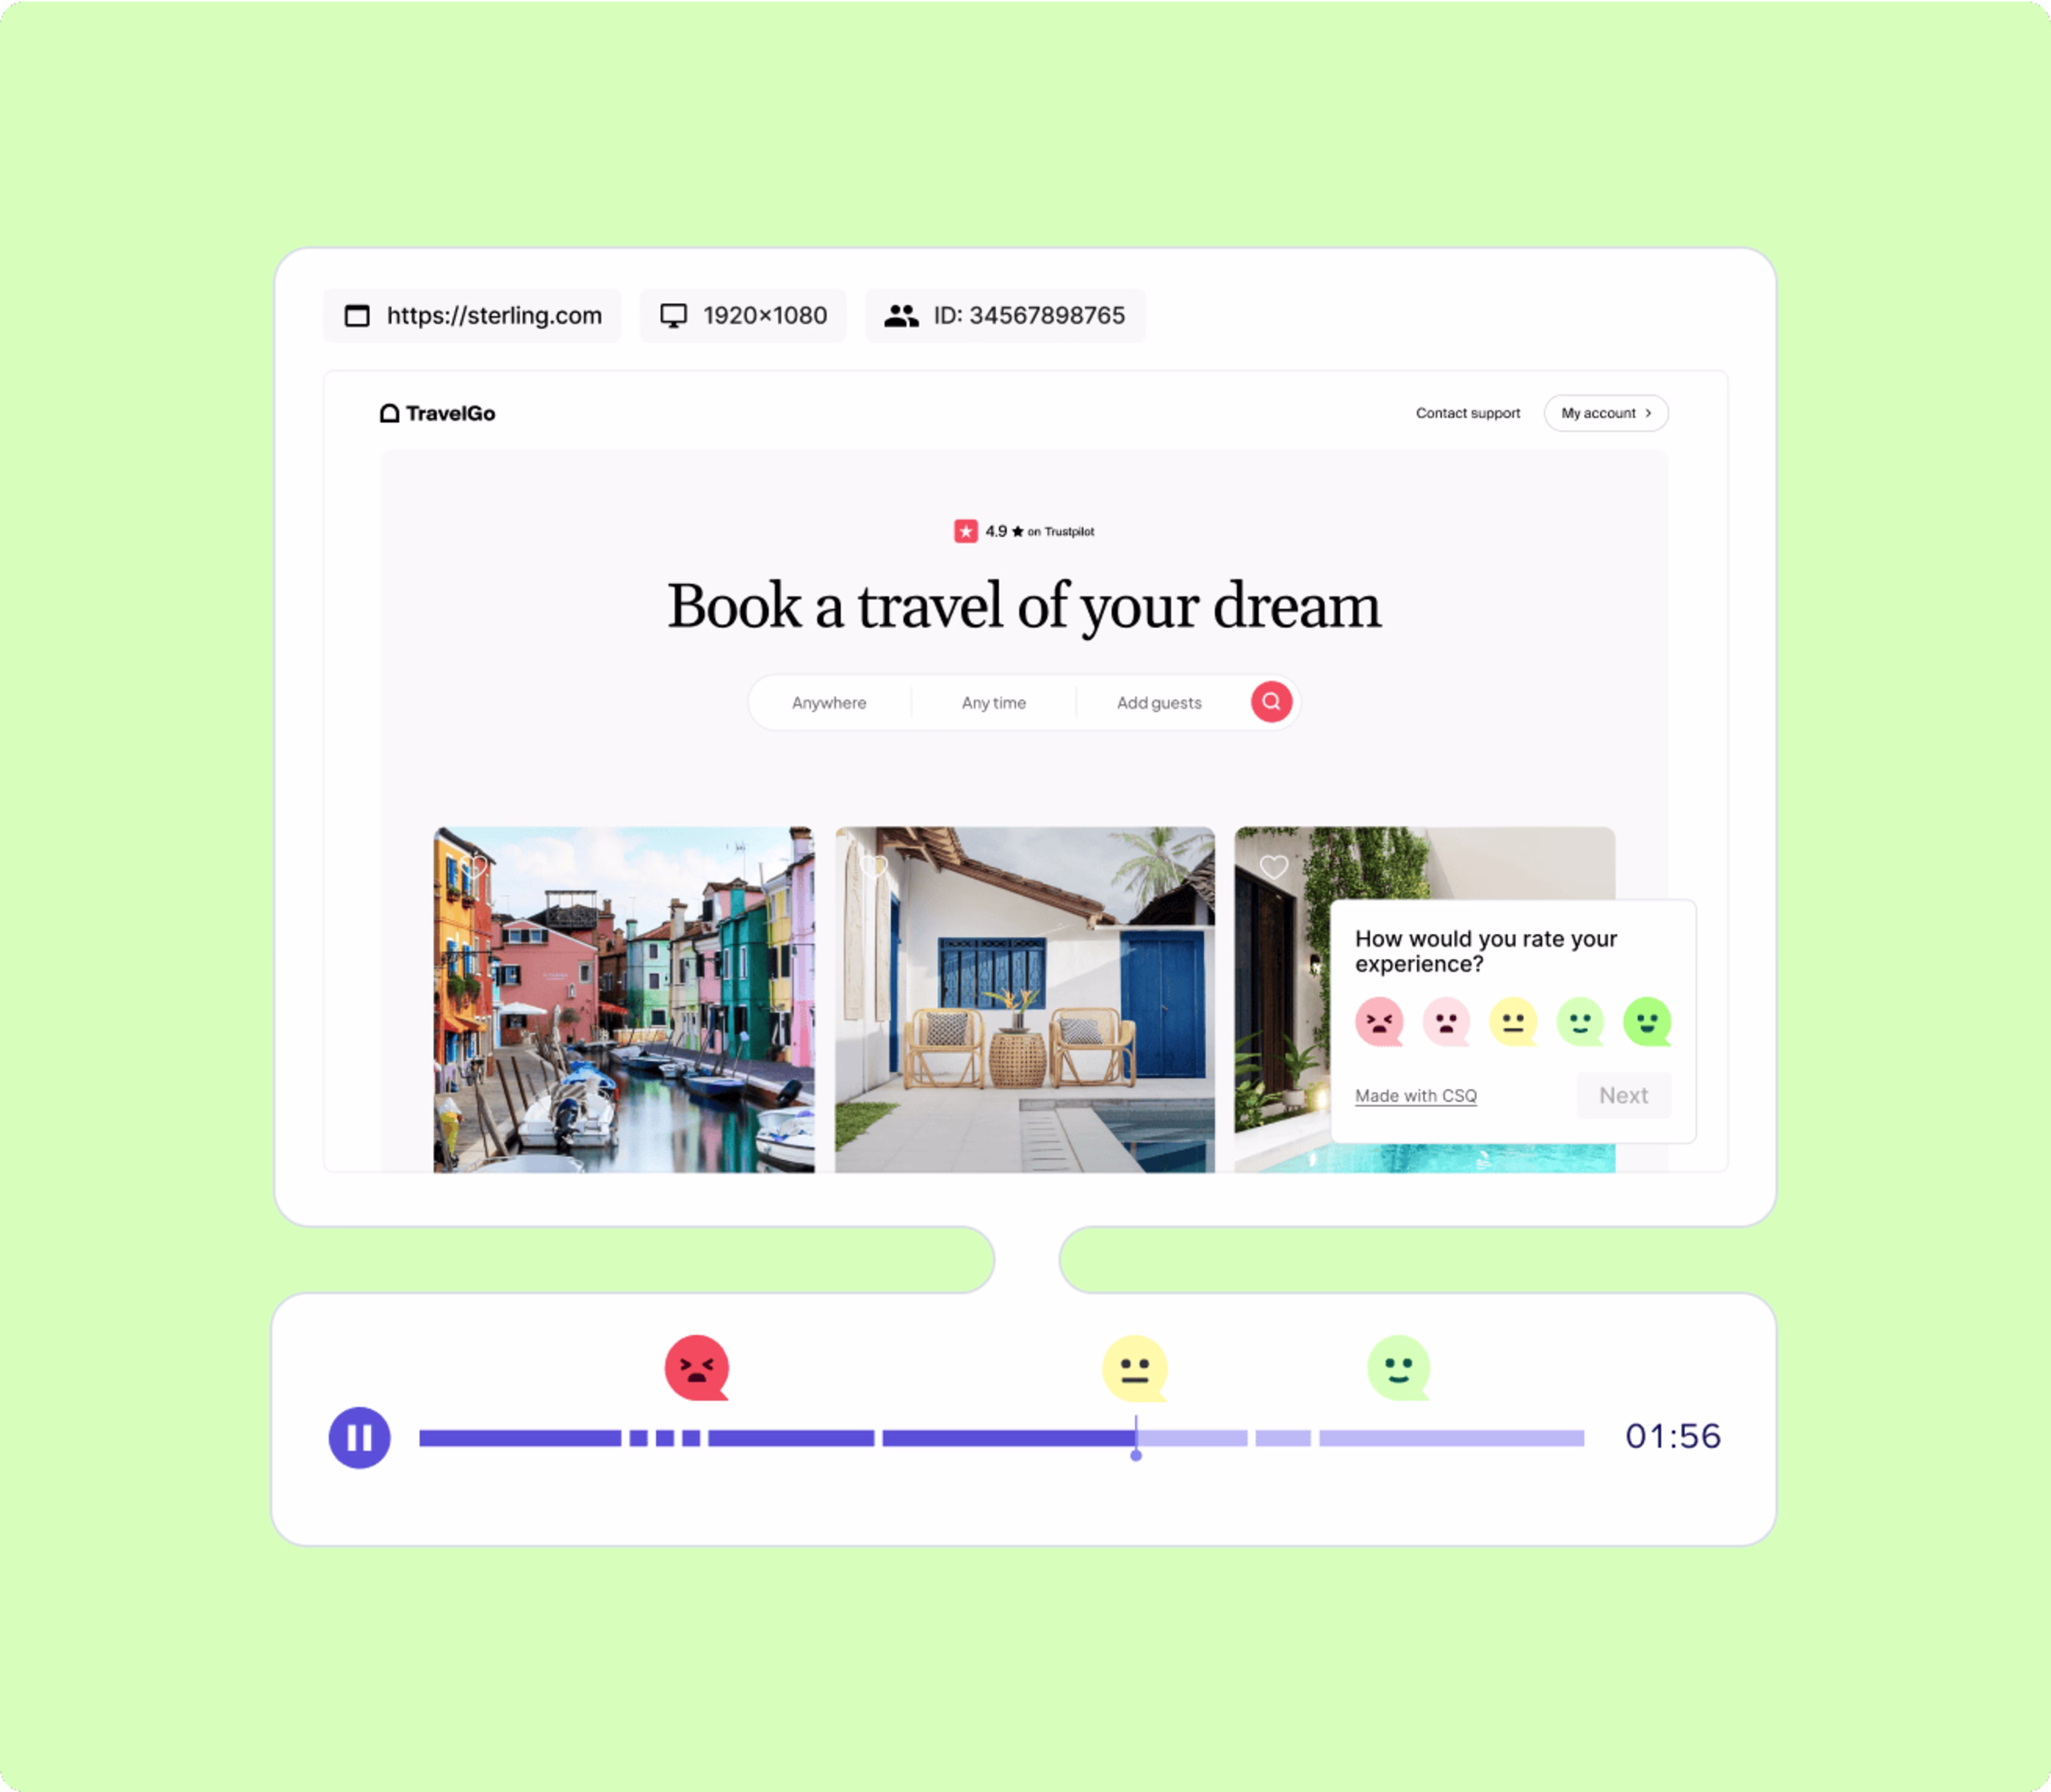
An example of a Contentsquare session replay
With these tools, you can discover what frustrates users and why they leave before converting.
Get feedback from real users
The website engagement tracking process, when done well, requires teams to ask why again and again.
Why is this metric down? Because users stop scrolling when they’re only 25% down the page.
Why do they bounce at that specific point? Hmm. 🤔
At some point down your trail of ‘whys’, you need to get information straight from the source—your users.
Contentsquare Voice of Customer (VoC) gives you 3 options to gather qualitative data from users about website engagement:
Feedback: place a feedback button on any page of your site to get a sentiment rating and additional feedback from users about their engagement on that page. Customers can tell you what they think about the page while it’s still fresh in their minds and even highlight parts of the page they like.
Surveys: if you have specific questions for your users about their interactions with your site, send them a survey. It takes the guesswork out of your website decisions by helping you narrow down your hypotheses about user behavior.
Interviews: Contentsquare makes it easy to conduct user interviews, so they can answer questions about their experience. It also helps you empathize with users on why they behave the way they do on your site—and gives you ideas on how to improve your UX and PX.
![[Visual] User interviews](http://images.ctfassets.net/gwbpo1m641r7/1NoZhe41CLZOnW11Qxm8Of/0dcc10ac191db7f29cf08df13c867782/Screenshot_2024-11-05_at_17.03.01.png?w=3840&q=100&fit=fill&fm=avif)
An example of setting up user interviews in Contentsquare
5. Plan your next steps
After tracking your website engagement—and digging deep into the whys of user behavior, it’s time to think critically about what you can do to improve your site experience.
Say you’ve learned that users are dropping off your site when they see pricing tiers, and you figure out that it’s due to the amount of copy in the chart. Now, all that’s left is to take action. Make revisions to the existing page, and run an A/B test using session replays to monitor the results, so you can see which version of your pricing page works better.
![[Visual] AB Testing and session replay](http://images.ctfassets.net/gwbpo1m641r7/3pyi6K866dXK51H98XtJnd/fa1e174cb7560d0cd9e565aca3fb9019/Experience_Analytics_-_AB_Test__1_.png?w=3840&q=100&fit=fill&fm=avif)
Session replays help you see how users respond to different web page versions in A/B testing
💡Pro tip: launch surveys after making changes to check whether your tracking efforts to improve engagement are successful. Check out Contentsquare’s ready-made survey templates for more ideas on what to ask your users.
Start boosting your website engagement today
Keep your user at the core of your website engagement tracking and decision-making process, and be prepared to test and iterate. It’s the secret to level up your website engagement, improve the user experience, and win loyal advocates for your brand.
FAQs about website engagement tracking
Website engagement tracking is the process of collecting and monitoring data on how users interact with your site. Tracking engagement helps you figure out how to improve UX and increase conversions.
![[Visual] Contentsquare's Content Team](http://images.ctfassets.net/gwbpo1m641r7/3IVEUbRzFIoC9mf5EJ2qHY/f25ccd2131dfd63f5c63b5b92cc4ba20/Copy_of_Copy_of_BLOG-icp-8117438.jpeg?w=1920&q=100&fit=fill&fm=avif)