
The best product and marketing teams rely on data to make business decisions, prioritize their roadmaps, and improve the customer experience from beginning to end. But if you’re only looking at one slice of data, you risk missing huge chunks of information—and losing out on customer-centric insights that could transform your business.
Combining product analytics with digital experience analytics gives you the full picture of behavior across your site and product, providing a 360-degree view of interactions and engagement. Read on to learn which product analytics metrics to track and why they’re so important for data-driven teams.
Product analytics is the process of capturing, organizing, and understanding critical information about the digital products you build, like websites and mobile apps. But with an almost endless array of user data to choose from, how do you know what’s important and what’s not?
Choosing the right product analytics metrics and key performance indicators (KPIs) to track helps you cut through the noise and monitor what matters to your business, giving you valuable insights about retention, churn, adoption, and usage.
Here are 10 key metrics to start tracking now—as well as some PA tips to help you really dig into the data to find actionable insights.
1. Daily active users/monthly active users (DAU/MAU)
Active users—whether daily or monthly—are those who regularly engage with your product. Using the DAU/MAU ratio, product managers and other stakeholders can see how many of your monthly users use it every day.
If we assume that users who engage more frequently with a product are getting more value from it, then a high DAU/MAU ratio means a stickier and more engaging product, while a low DAU/MAU ratio suggests poor user retention.
To calculate your DAU/MAU, first define what an ‘active user’ looks like. For example, you might define ‘active’ as a user performing an important action on your site or app, such as clicking ‘like’ on a post, making a purchase, or saving a report.
Once you’ve determined the criteria for an ‘active user’, track them by day and month using a product analytics tool like Contentsquare, then use the formula:
Ratio = (DAU/MAU) x 100
2. Sessions per user
Sessions per user measures the number of times an average user has been active on your site or product. Combine this with other session metrics, such as session duration (like how long each session typically lasts) and pages per session (like how many pages users view in each session), to understand the depth of user engagement.
To calculate sessions per user, start by defining what counts as a ‘session’. Simple logins or visits are usually not good benchmarks for measuring sessions, as these don’t measure actual engagement (just think how many open tabs you have in your browser right now that you’re not engaging with). Instead, aim to define a session as completing an action or scrolling to a certain depth.
Then, use the formula:
Sessions per user = Sessions/Total users
To get a truly accurate view of sessions and their impact, you’ll need a PA tool that can track users across sessions, devices, and domains to understand the complete user journey. Product analytics from Contentsquare connects the dots between sessions so you can
Discover how many sessions it takes for users to convert
Analyze the top events between sessions
Identify friction between steps
Compare how different events influence conversion rates
With these insights, you can see how users behave across the multi-channel, full-funnel journey—and make data-driven optimizations.
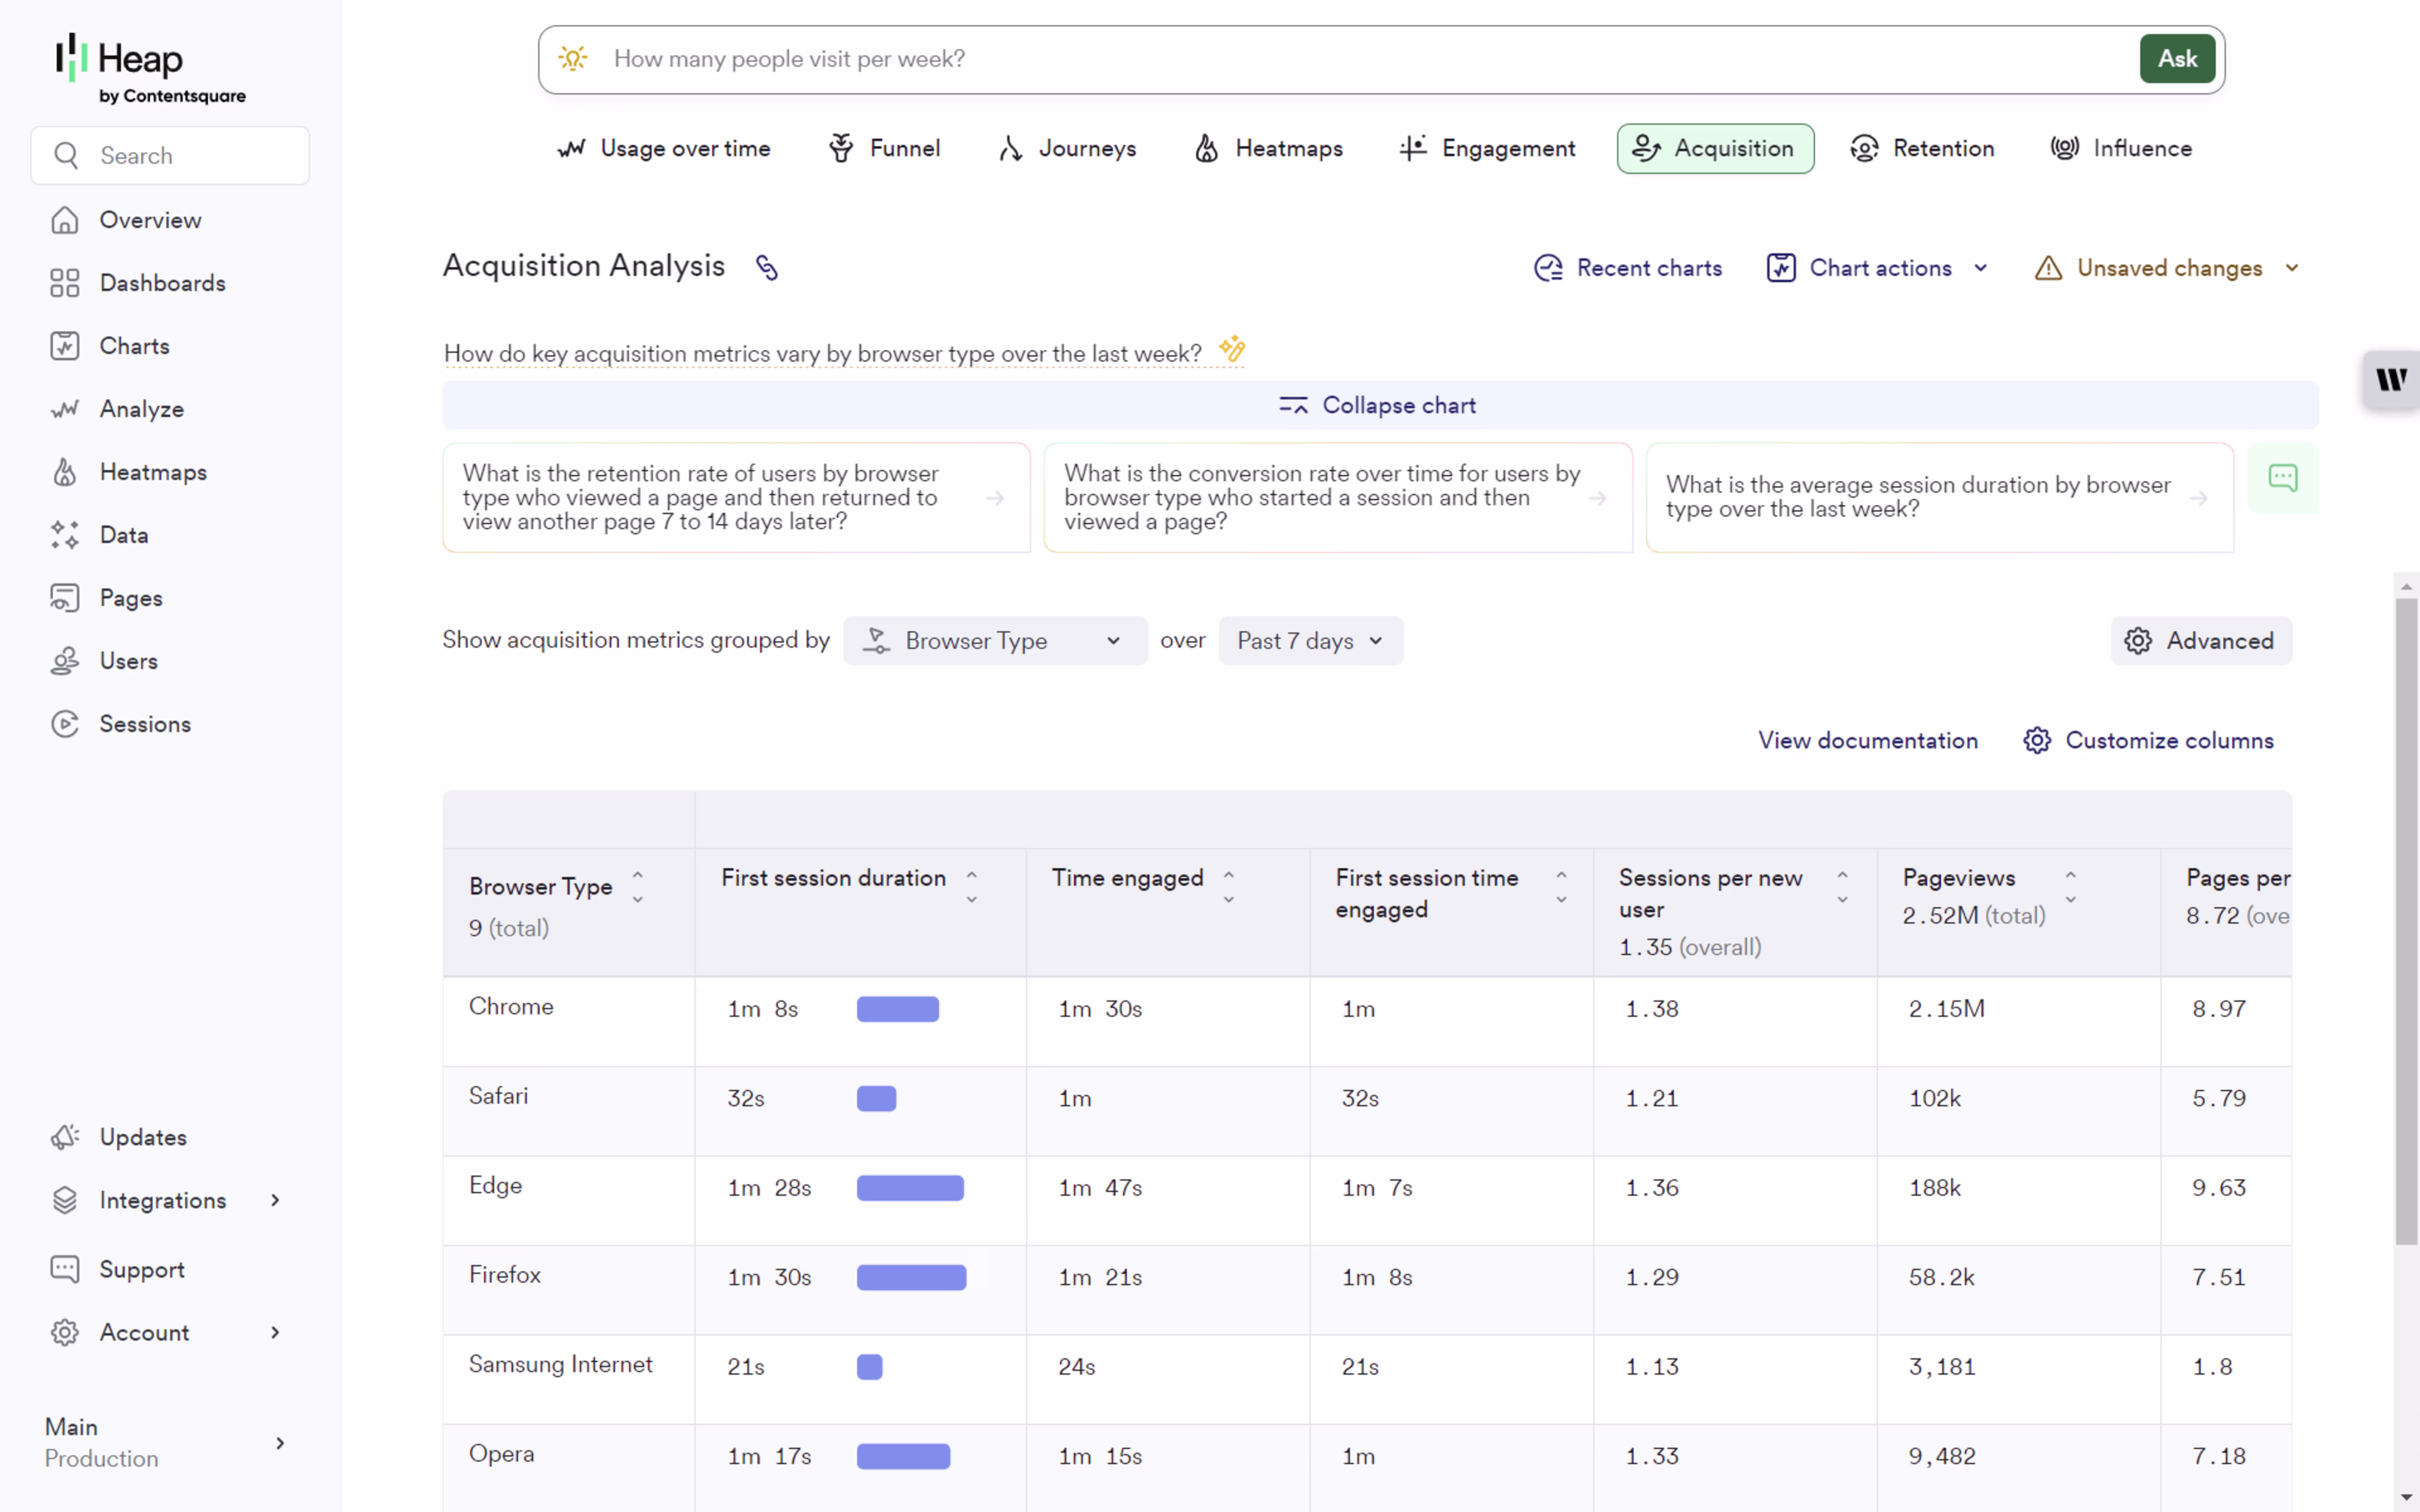
Track session metrics by browser type and device with Contentsquare, powered by Heap
💡 Pro tip: use session replay tools to get an in-depth understanding of user behavior on your site or app. Watch what users do in their session and follow every click, scroll, and hover on their journey to uncover their motivations and frustrations.
Need to drill down further? Filter your session replays based on parameters like device type, browser, location, or user segment (such as new users vs. returning users) to get even more granular insights.
Then, use your learnings to build hypotheses to increase user engagement—for example, optimize your mobile UX to keep those users coming back for more.
![[Visual] Session Replay](http://images.ctfassets.net/gwbpo1m641r7/ixsmocDmrb471y732GpId/a5d0b671a70df5f177bfe7262388623d/Screenshot_2024-11-04_at_19.22.27.png?w=3840&q=100&fit=fill&fm=avif)
Watch a session replay in Contentsquare to discover exactly how users behave on your site or app
3. Bounce rate
Bounce rate measures _dis_engagement—it tracks the percentage of sessions that immediately exited with no interactions or clicks. A high bounce rate suggests that users didn’t find what they were looking for: this could be due to irrelevant content, a misleading link that brought them to the wrong place, poor user experience (UX), or frustrating technical issues like slow page load times. (Pro tip: use an exit-intent survey to ask users why they’re leaving and quickly identify areas for improvement.)
To calculate your bounce rate:
(Number of single-page, no-click sessions)/(Total number of sessions)
4. Customer satisfaction score and Net Promoter Score®
Customer satisfaction (CSAT) and Net Promoter Score® (NPS®) might not seem like typical product metrics, but it’s always worthwhile to capture and analyze voice-of-the-customer feedback alongside more ‘traditional’ KPIs.
As a result, these metrics enrich your quantitative product analytics data with qualitative customer feedback that tells you what customers are enjoying about your product.
Customer satisfaction measures how happy customers are with your product, service, or experience (such as a customer support interaction). Track this over time to spot trends in customer sentiment and stay ahead of potential issues.
Net Promoter Score® measures how likely a user is to recommend your product or service to others on a numerical scale. Analyze the results of your NPS surveys across different customer segments to find opportunities to grow customer loyalty among those groups by addressing their unique needs.
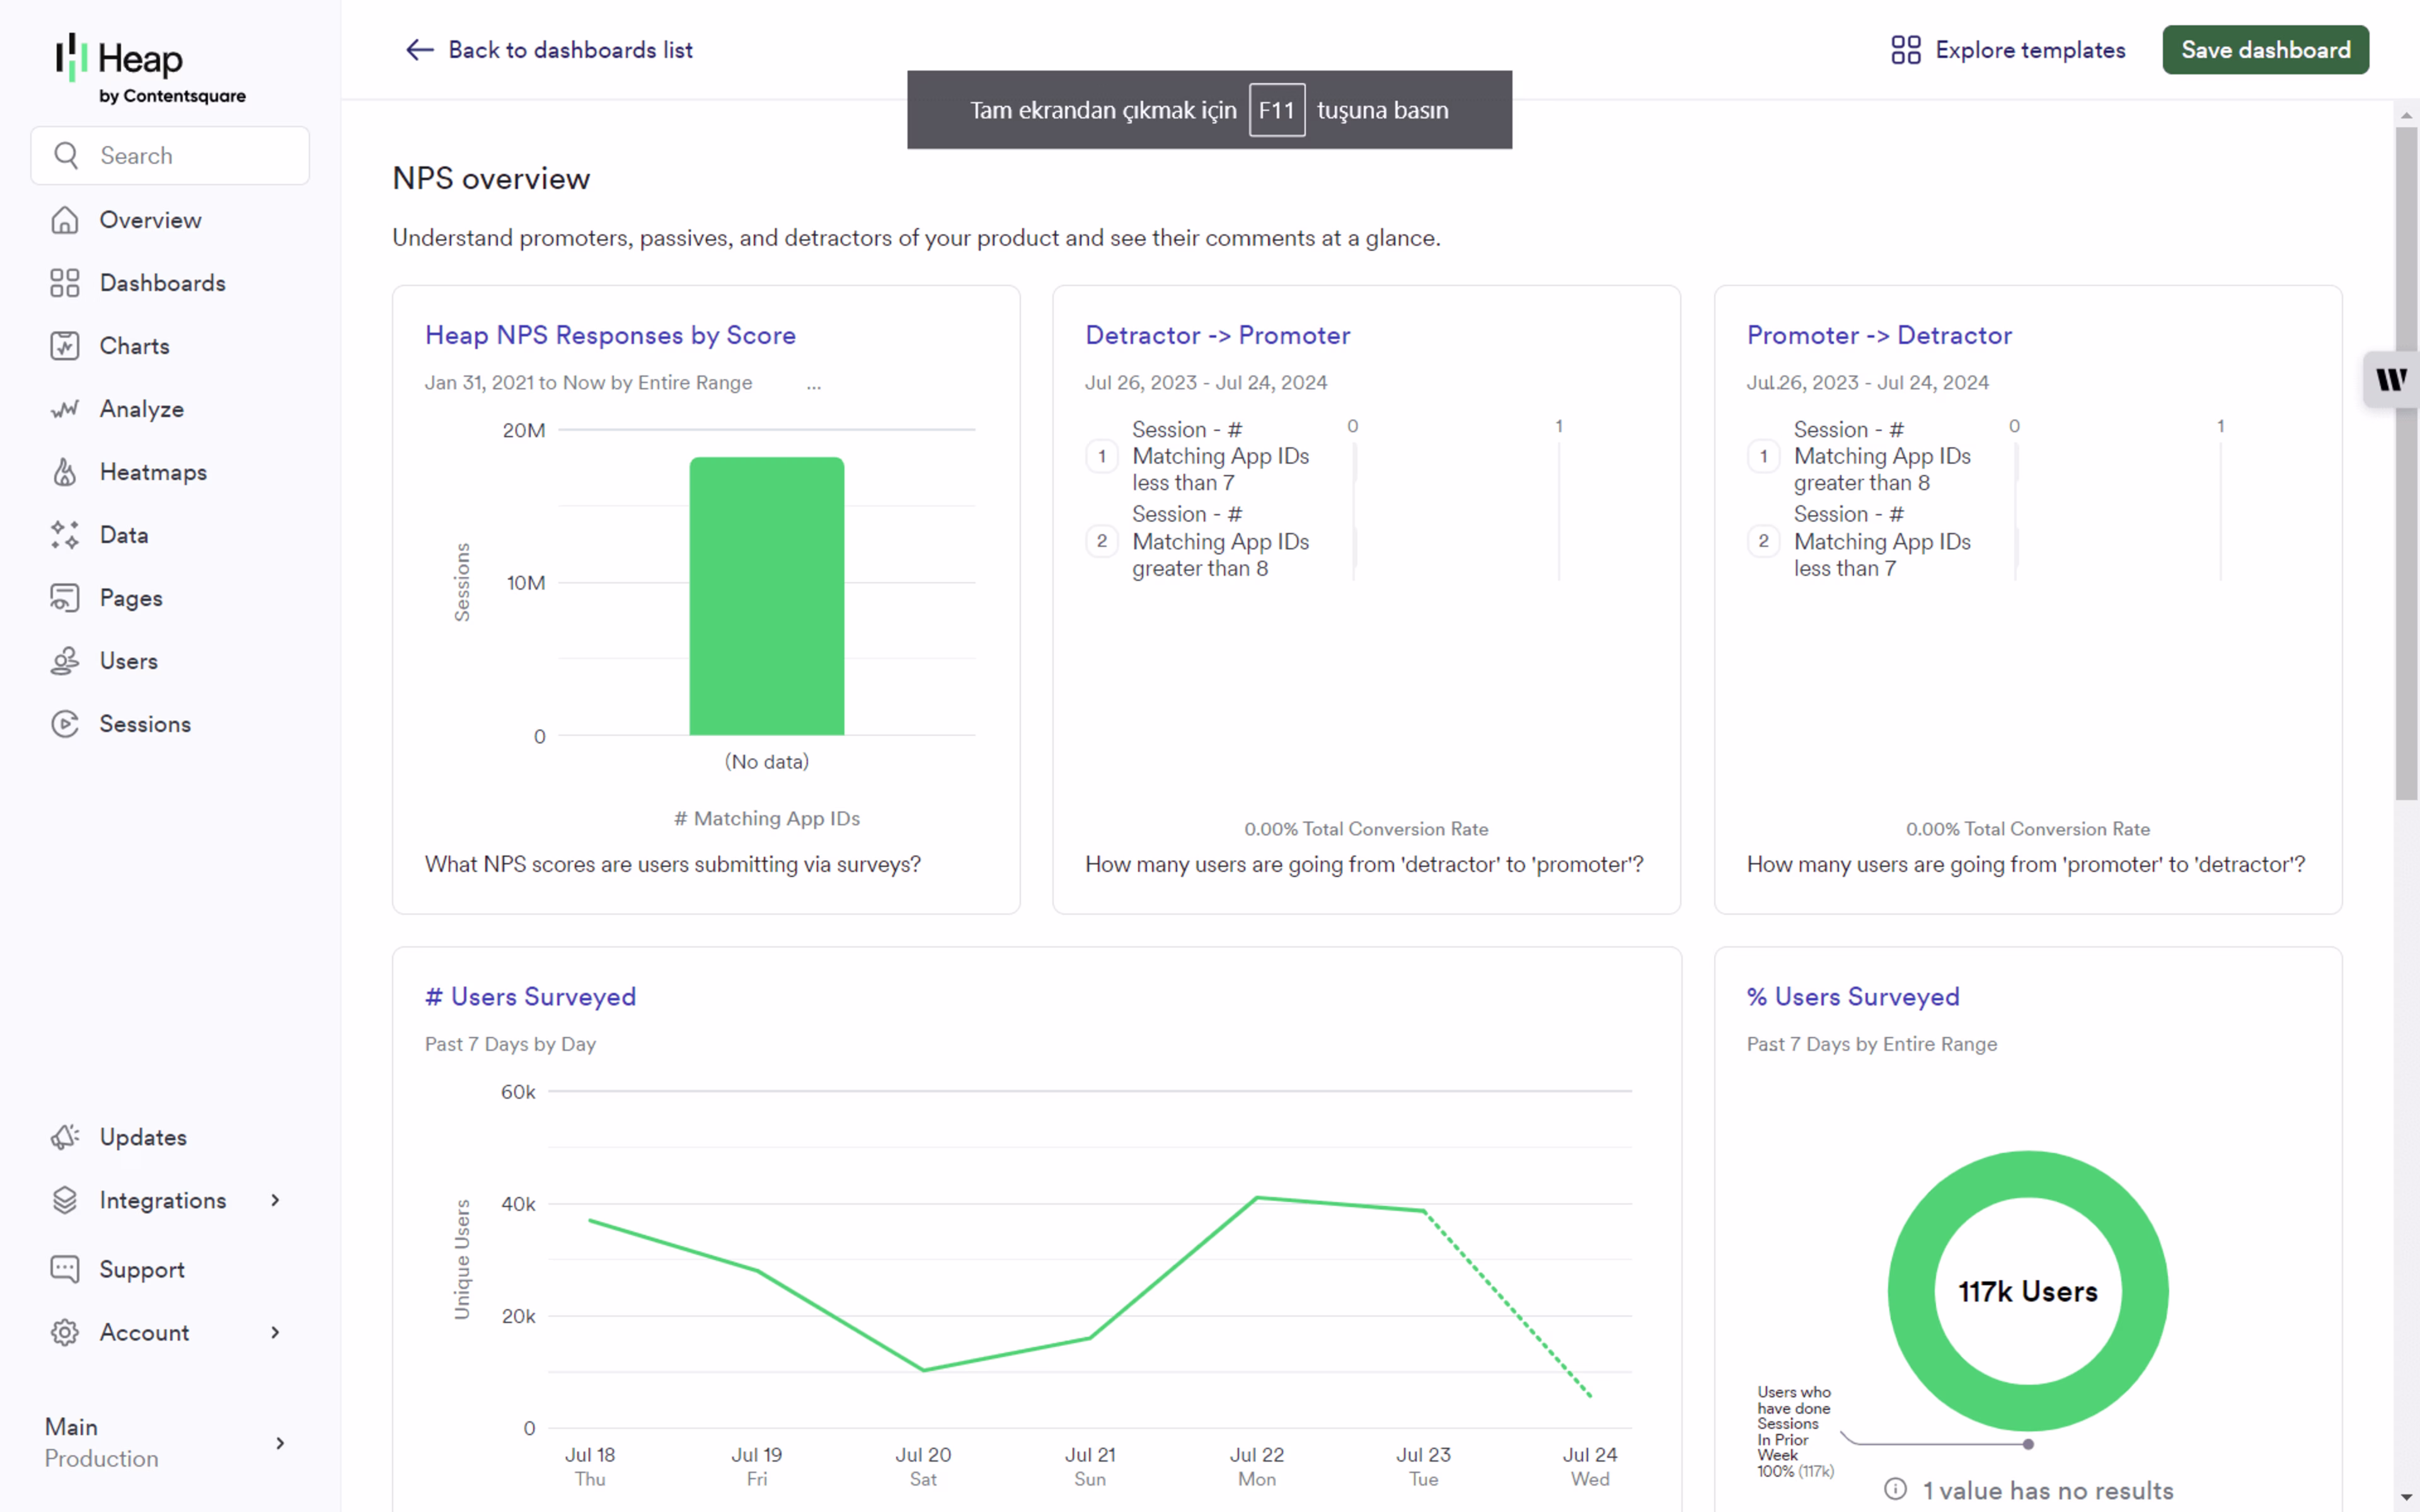
An NPS survey overview from Contentsquare
💡 Pro tip: voice**-of-the-**customer tools—like feedback and surveys—let you capture in-the-moment insights at any and every point of the customer journey.
With Contentsquare, you can add a feedback button anywhere on your site to allow customers to share their thoughts in their own words. Auto-capture screenshots to see exactly what they saw when they left the feedback, or jump straight to the related session replay for even more context.
![[Visual] sterling feedback](http://images.ctfassets.net/gwbpo1m641r7/70U8e06xYAEvTXQKTHZ2Vc/1d6106140d2cb54010a7b98374e16b52/csq.png?w=3840&q=100&fit=fill&fm=avif)
Combine feedback with other PA tools like Session Replays to understand exactly what led to poor (or great!) user experiences
Combining your metrics to understand user engagement
The four metrics above—DAU/MAU, sessions per user, bounce rate, and customer satisfaction and NPS—are all examples of user engagement metrics. There’s no one KPI for user engagement: instead, you should look at a range of metrics (like these!) to understand the breadth and depth of user interaction.
User engagement is one of the most crucial metrics for product managers and marketing teams to measure because it reveals whether your product is delivering value to users. When users deeply engage with your product and build it into their routines and workflows, they’re more likely to use it long-term, increasing retention and recurring revenue.
5. User retention
User retention tracks the number of users who return to your product repeatedly and continue to invest in it, making them one of the most valuable cohorts for your business.
Retention rates correlate highly with revenue, platform stickiness, and customer satisfaction, and can teach you a lot about user engagement and product-market fit. Retention analysis of your long-term and highly engaged users also uncovers insights about which user segments are most profitable, helping you identify retention-boosting opportunities you can use in your product strategy.
To calculate user retention rate:
Retention rate = Number of continuing users/Number of customers you started with
![[Visual] CSQ overview](http://images.ctfassets.net/gwbpo1m641r7/1Mys8Z4lOsgR3kI9BwyKIM/5c2c50495b1520af8b6f7ec64047109d/Screenshot_2024-11-05_at_16.00.31.png?w=3840&q=100&fit=fill&fm=avif)
Contentsquare’s Retention Analysis reveals the journey your most valuable customers took—and uncovers the most impactful actions you should encourage new users to take
6. Churn rate
Churn rate is the percentage of users who stop using your product. Your churn rate is essentially the opposite of your retention rate—and, like retention rate, can also indicate customer satisfaction (or lack thereof).
To calculate your churn rate, take the number of users you have at the beginning of a period and subtract the number of your users left at the end of the period. Divide the result by the number of users you had at the beginning of that period.
Churn rate = (Number of users at the beginning of a period – number of users at the end of the period)/Number of users at the beginning of a period
7. Customer acquisition cost (CAC)
Customer acquisition cost (CAC) is the average amount your company spends to acquire a new customer. CAC is useful for measuring how efficient your marketing and sales activities are, helping you gauge whether the money you spend on customer acquisition is paying off.
To calculate your CAC, divide the total cost of marketing and sales activities by the number of users who became new customers:
CAC = Total cost (marketing + sales)/Number of new customers
8. Customer lifetime value (LTV)
Customer lifetime value—also known as user lifetime value, CLTV, CLV, or LTV—is an estimation of the amount of money a customer will spend on your product during their relationship with your company.
It allows you to understand how much you should spend to acquire customers and identify the customers you should be pursuing (hint: it’s usually the customers with the highest LTV).
By creating user segments based on LTV with Contentsquare, you can launch personalized marketing campaigns aimed at customers with low, medium, and high spends. As part of your product analytics strategy, take time to explore this data: once you discover the behaviors linked with high-value customers, seek to replicate those actions with new users. For example, if you notice that customers with a high LTV engage with product reviews before purchasing, you could make product reviews more prominent on key pages.
To calculate LTV, use the formula:
CLTV = Average order value x purchase frequency x customer lifespan
A user segment cohort of people who have purchased more than 10 items at once
9. Monthly recurring revenue (MRR)
Monthly recurring revenue (MRR) is the total revenue your product brings in each month. Use this metric to predict cash flow, track your financial health, and surface revenue trends.
To calculate MRR, multiply your total number of customers by the average revenue per user (ARPU) per month:
MRR = Number of customers x ARPU per month
10. Adoption rate
Adoption rate is the percentage of users who progress beyond exploring or trialing your product and become repeat users, integrating it into their workflow on an ongoing basis.
Once again, your definition of ‘adoption’ may vary. For SaaS businesses, you might look at feature usage: for example, using a certain feature X number of times in a given period. Whichever events you use to signify adoption, ensure they’re linked to users getting value from your product.
To calculate your adoption rate, divide the number of users who have performed key adoption event(s) by the total number of users, then multiply by 100 to get your percentage:
Adoption rate = (Number of new users/Total number of users) x 100
The business benefits of tracking the right PA metrics
Understanding how people—both prospective users and paying customers—interact with your product gives data-driven marketers and customer-focused product teams powerful insights that lead to better experiences. Here’s how the right metrics help.
1. Increase customer engagement
By analyzing customers’ behavior as they explore and adopt your product, you get a first-hand view into their pain points and blockers. Use the metrics above to identify moments of friction in the user journey that prevent them from getting the most value from your product features, then experiment and optimize to create better user experiences—and keep customers engaged.
2. Improve retention (and revenue)
Use product analytics to discover what leads users to stick around or churn. Find data-driven ways to increase feature and product adoption so users reach ‘aha!’ moments faster and get more value from your product, turning them into satisfied long-term customers.
3. Attract more high-value customers
Analyze your product analytics data to understand the behavior, needs, and motivations of your highest-value customers. Create targeted segments of high LTV customers and explore key behaviors and traits associated with this cohort. Then, use your learnings to prioritize your product roadmap, plan new features, and finetune your marketing messaging to connect with more of these types of users.
Product analytics metrics vs. digital experience analytics metrics: what’s the difference?
Product analytics (PA) focuses on how users interact with a specific product, while digital experience analytics (DXA) provides a broader view of the user journey (not limiting interactions to one product).
Another subtle difference is that product analytics provides a user-focused view, and digital experience analytics provides a session-focused view. As a result, product analytics lets you track changes over time and across platforms, whereas DXA gives you a deeper understanding of how users interact on your website and app.
It’s not a case of one or the other: both are important. Together, they provide both breadth and depth, and you need both PA and DXA to get a comprehensive, holistic view of your customer and their complete journey.
Get in-depth, actionable insights with the right product analytics metrics
Incorporating product analytics metrics into your tracking and reporting gives you a granular understanding of how customers interact with, and feel about, your product. Use the insights you glean to make data-driven, customer-focused improvements—from implementing new onboarding flows that address common blockers to guiding product development—and enjoy improved retention, reduced churn, and happier, more engaged users.
FAQs about product analytics metrics
Product analytics is the process of tracking and analyzing how users interact with your product. Product teams and marketing teams use product analytics to assess the performance of the products and experiences they deliver, and identify ways to improve these for their ideal customers.
![[Visual] Contentsquare's Content Team](http://images.ctfassets.net/gwbpo1m641r7/3IVEUbRzFIoC9mf5EJ2qHY/f25ccd2131dfd63f5c63b5b92cc4ba20/Copy_of_Copy_of_BLOG-icp-8117438.jpeg?w=1920&q=100&fit=fill&fm=avif)