
Do you know how customers use your app? What resonates with them (or doesn’t), and what makes them convert, abandon or uninstall?
Enter mobile app heatmaps: a quick, visual way to see where users tap and what they ignore so you can deliver better mobile UX while increasing app engagement and conversions.
Keep reading to learn exactly what mobile app heatmaps are, why you need them, and how to set one up as part of your mobile analytics stack.
What is a mobile app heatmap?
Mobile app heatmaps aggregate every interaction a user has with your app—including swiping, scrolling, and tapping—and overlay behavior patterns in different colors.
Warmer tones (like red) show areas visitors gravitate toward and features they interact with. Colder colors (like blue) show content users scroll past, ignore, or miss.
Mobile app heatmaps, alongside other mobile analytics tools like customer journey analysis and session replays, are essential for app-first or app-only businesses like dating app Bumble.
[App customers] are different, they engage differently. It’s a completely different world of interacting and connecting with your customers.
How mobile app heatmaps work
Mobile app heatmaps are different from mobile website heatmaps because you need to install a software development kit (SDK) in each app platform (like iOS or Android). Mobile website heatmaps, by comparison, are generated by adding a JavaScript snippet to web pages.
Not all heatmap tools work on mobile apps so you’ll need to pick one that does—like Contentsquare’s Mobile App Analytics or Heap, part of the Contentsquare group.
💡Pro tip: If your mobile app offers similar functionality to your mobile website (often true for eCommerce brands), you can use insights from mobile website users to inform your mobile app strategy in the same way fashion retailer Hugo Boss does.
We have an omnichannel experience at Hugo Boss. A lot of the things we do in terms of conversion end up filtering their way down to the app eventually.
2 types of mobile app heatmaps
Depending on your choice of heatmap software, you can generate several different types of heatmaps for any mobile app screen.
Contentsquare enables you to generate all 3 of the following heatmap types (for both app and mobile website pages).
1. Tap maps
Tap maps (also known as touch heatmaps or click maps on desktop devices) show where mobile users tap their screens. They help identify friction points, such as dead taps or rage taps, where users may be tapping in frustration.
Contentsquare's tap heatmap represents frequency of user taps with a color spectrum, from red (indicating higher tap activity) to blue (indicating lower tap activity).
Each tap is recorded at its position and aggregated across all sessions that match your selected criteria.
![[Guides] [Mobile Analytics] Heatmaps - tap map image](http://images.ctfassets.net/gwbpo1m641r7/70KQ9tI5LjTi2OBcDnEwIE/f4defd93e40394b9617cf2bd47b6b61d/mobileheatmaps.png?w=3840&q=100&fit=fill&fm=avif)
2. Scroll maps
Scroll maps visualize how far down mobile pages users scroll on average. They help you quantify the number of users seeing key elements and calls to action (CTAs).
Contentsquare (unlike other analytics tools) automatically collects scroll activity, and renders it in an easily understandable scroll heatmap where red indicates maximum engagement, and blue minimal or no engagement.
You can hover over zones to see the exact scroll rate percentage.
![[Guides] Mobile Analytics - Scroll map](http://images.ctfassets.net/gwbpo1m641r7/7cZvepcbBmP2kYQmj46YBz/3cdf5bf6d34ba0eec41d4000eb44d431/mobilescrollmap.png?w=3840&q=100&fit=fill&fm=avif)
The 4 main benefits of using heatmap analytics on mobile apps
According to our 2024 Digital Experience Benchmarks report, almost 85% of mobile app users are returning customers (look out for more stats from the report below), which means optimizing mobile app usability is crucial for increasing customer retention and lifetime value.
Here are the five main benefits you’ll get from using mobile app heatmaps.
1. Improve your app’s user experience
With plenty of competitors to choose from, app bugs and usability issues are likely to lead to churn and retention issues. Mobile heatmaps help you visualize common areas of frustration—like rage taps on broken elements—so you can reduce drop-offs and build better experiences.
See it in action: Renan Medeiros, Product Owner at Sykes Holiday Cottages, used Contentsquare’s mobile app heatmaps to spot a high tap rate on a non-clickable search button.
App journey analysis showed that users who tapped the button often returned to the homepage compared to those who didn’t click, suggesting that the former cohort was trying to refine their search. The team then improved UX by A/B testing a clickable search button.
Read more about how Renan used mobile app heatmaps in our guide on mobile app optimization.
2. Increase app engagement
Mobile heatmaps show you where users are engaging with your app. Improve key app engagement metrics—like Daily Active Users (DAU) and session length—by visualizing the areas of high and low user engagement in a heatmap and using those insights to make changes.
For example, if you see that CTA buttons like ‘play this video’ or ‘sign-up for free’ show up as cold on your mobile app heatmaps, it’s probably a good idea to optimize for engagement by testing different CTA placements or messaging.
3. Optimize app conversion rates
Compared to the mobile web, app traffic is 3x more likely to convert, averaging 5.56% across industries. Use app heatmaps to capitalize on this trend by linking app browsing to buying trends and running conversion rate optimization experiments.
4. See why A/B tests win
Because heatmap data represents aggregated user behavior, it helps you understand why certain variants of your tests are more successful in a way traditional web analytics tools like Google Analytics don’t.
Use mobile app heatmaps to understand why winning variants were successful and get ideas for future redesigns.
💡Pro tip: If you’re using Contentsquare for mobile app analytics, use heatmaps to compare an A/B test variant with the control in a single screen.
How to set up and analyze a mobile app heatmap in 3 steps
Here are the main steps you need to complete to set up and analyze a mobile app heatmap—for the collection and analysis steps, we’ll assume you’re using Contentsquare to make things easier. 😉
Step 1. Choose a mobile app heatmap tool
As we mentioned above, not all heatmap tools can be installed on mobile apps. Choose a behavior analytics platform with an SDK that’s compatible with popular mobile devices and operating systems.
We recommend a couple of tools we know very well
Contentsquare: Our SDK is lightweight, simple to deploy, and compatible with major frameworks (including Native iOS and Android, Flutter, React Native, Cordova and Capacitor)
Heap: Generates automated cross-platform mobile analytics so you can track users across devices and apps
Step 2. Collect app user behavior
Once the relevant SDKs have been added to your app, Contentsquare automatically identifies page elements and anonymously collects user interactions—no manual tagging or event setup required.
(Unlike other tools, which require manual setup, Contensquare automatically captures scroll rates.)
You’ll need to wait for some data to roll in before generating a heatmap—if you’re running a popular app, this might only take a few minutes!
Remember: all data collection is retroactive to the point of installation. If you decide to analyze a new metric later down the line, the chances are that the data you need is already there, waiting for you.
Step 3. Analyze and compare heatmaps
Now it’s time for the data visualization stage.
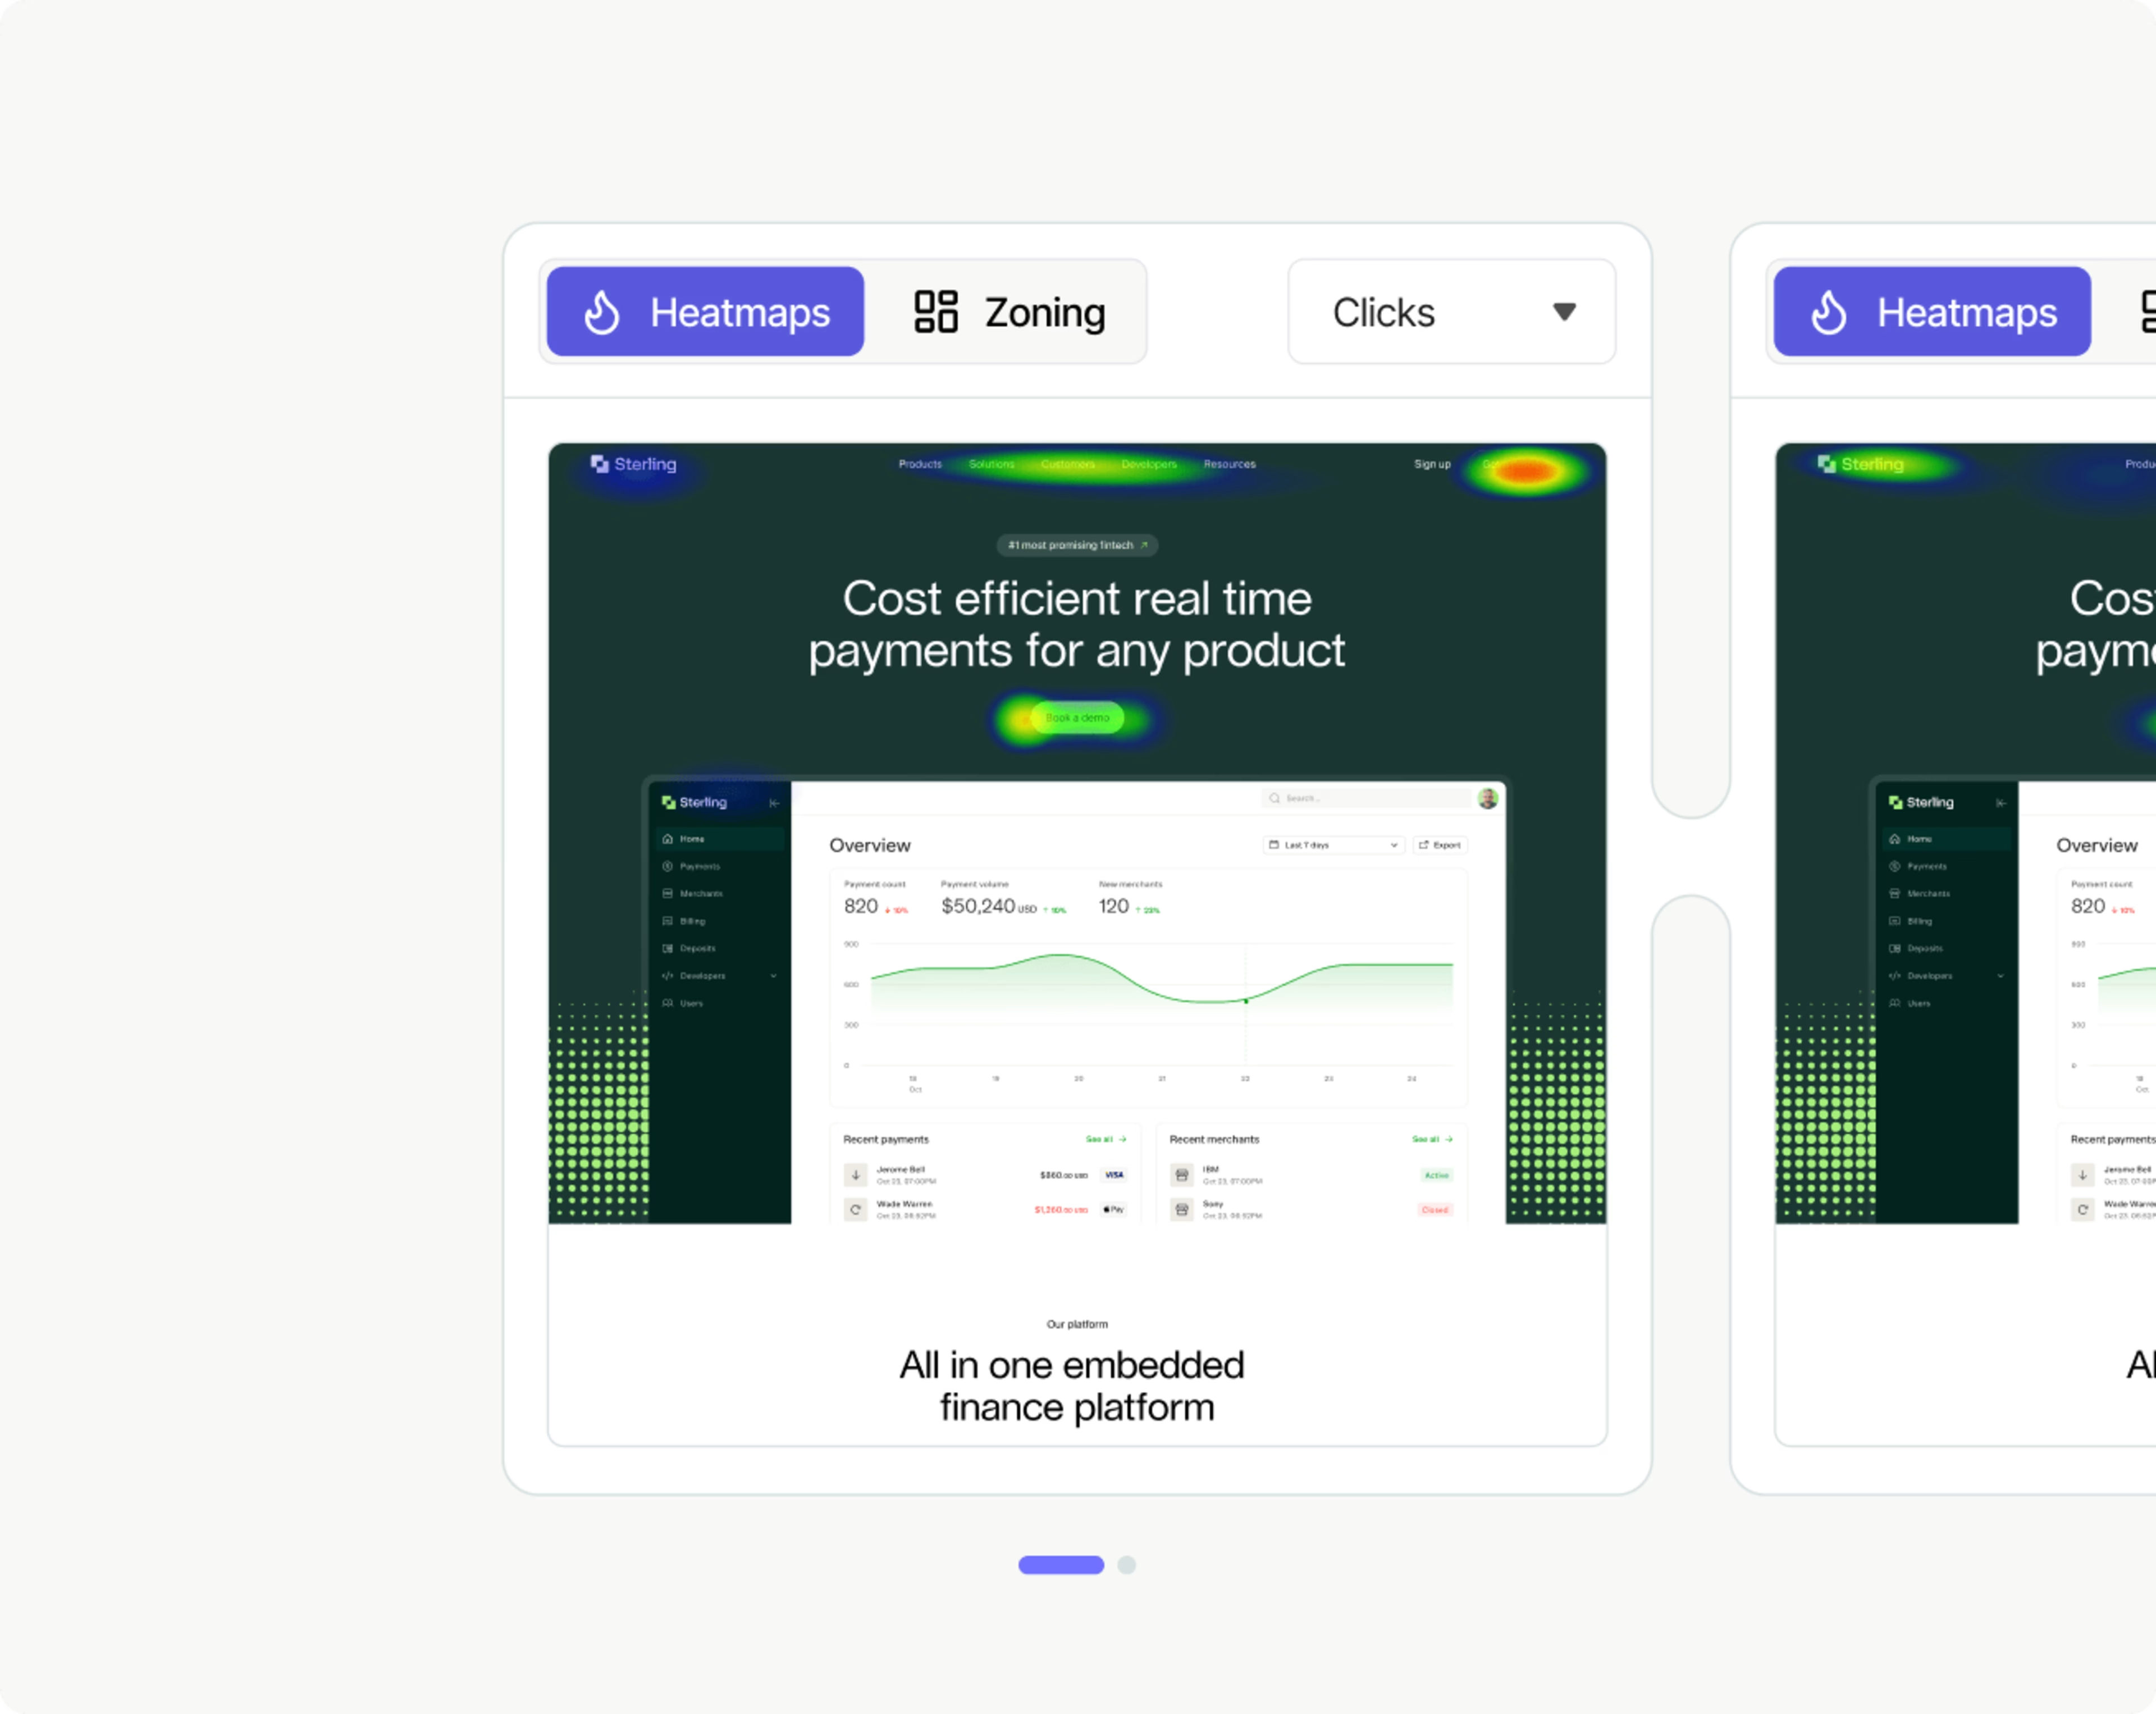
To compare two app heatmaps side by side, click the ‘Compare’ button at the top right. You can compare anything, from different app versions (e.g. revenue per tap for Android vs. iPhone) to different devices (e.g. conversion rate for mobile vs. desktop).
![[Guides] Mobile Analytics - heatmap comparison](http://images.ctfassets.net/gwbpo1m641r7/5e4Y5vfAq5WKxdVenXsvcM/006c883df9224a2fca2263d7d9a10bd0/Screenshot_2025-11-07_at_15.22.49__1_.png?w=3840&q=100&fit=fill&fm=avif)
Next steps: Leverage mobile analytics beyond heatmaps
On their own, heatmaps are a simple, visual way to view and compare aggregated mobile app behavior. They look great in a presentation and will fast-track your optimization ideas and stakeholder buy-in.
But heatmaps are just a preview of the benefits you can leverage from mobile analytics.
That’s why we recommend combining mobile app heatmaps with other quantitative and qualitative app insights—like session replays, app journey, and error analysis—to get a 360-degree understanding of what’s happening in your app and how to improve it for users and your bottom line.
FAQs about mobile app heatmaps
Mobile app heatmaps are different from mobile website heatmaps because you need to install a software development kit (SDK) in each app platform (like iOS or Android), whereas mobile website heatmaps are generated by adding a JavaScript snippet to web pages.
![[Visual] Jack Law](http://images.ctfassets.net/gwbpo1m641r7/6K99ulcVqLqKGyNZUaPiF8/145af0b27131005d862c790ddcafb3c5/Jack_Law.jpg?w=3840&q=100&fit=fill&fm=avif)