
Scroll maps—heatmaps that track scrolling behavior on a website or app—are a powerful visual analytics tool that help you understand how users interact with your web pages and page elements so you can make sure your site cultivates conversions and delivers an outstanding user experience.
Scroll maps quickly collect data on how visitors scroll through your website, so you can spot opportunities for user experience (UX) improvements, make changes, and, ultimately, increase conversions.
By the end of this article, you’ll know everything you need to know about scroll maps: what they are, how to set one up, and how to use them to find actionable insights that will supercharge your user experience.
What is a scroll map?
A scroll map is a type of website heatmap that visually shows how far users scroll down a page on a desktop, tablet, or mobile device. Scroll maps use a color gradient to represent the most- and least-viewed parts of a page, from hot (popular) to cold (unpopular). Red indicates the elements of your page users see the most, while blue represents low or no customer interaction.
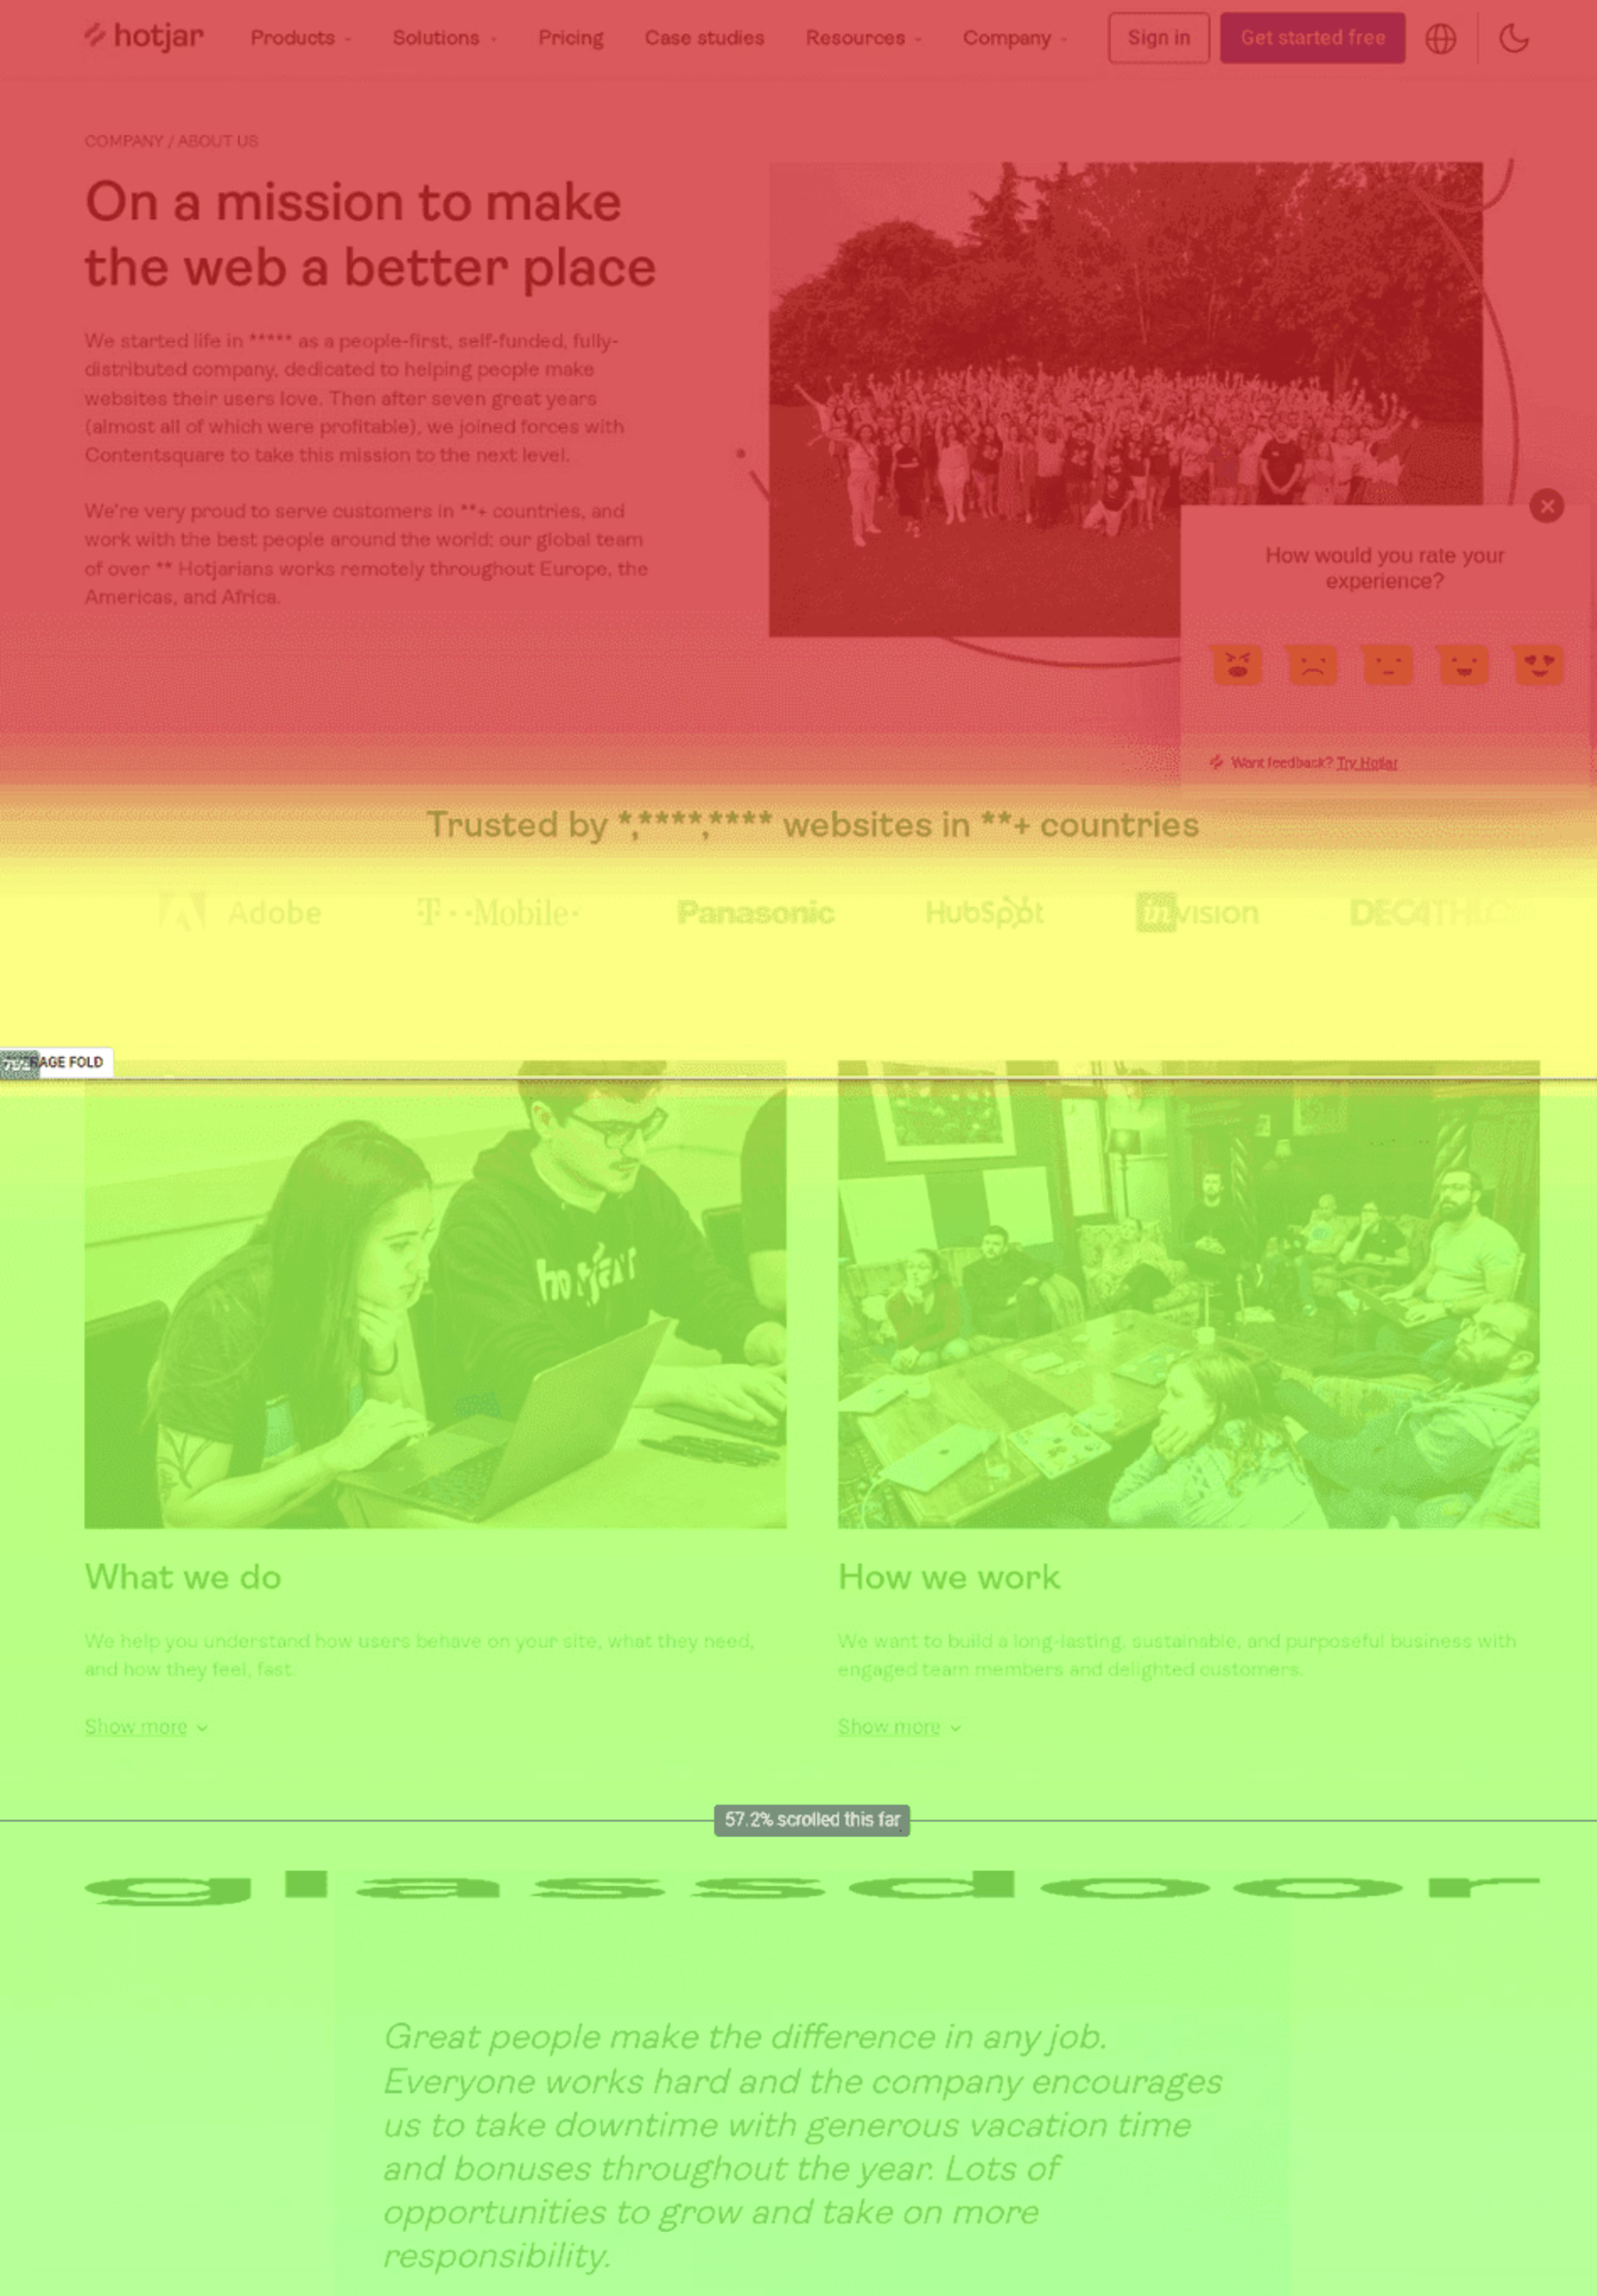
An example of a scroll map
Scroll maps aren’t just about color: they also let you know what percentage of users ventured further down the page. An average fold score is displayed as well, so you can easily visualize the part of the page most visitors see before they start scrolling.
Scroll maps vs. heatmaps
![[Visual] Scroll and click heatmaps](http://images.ctfassets.net/gwbpo1m641r7/1cNisZsreEbcEuxSgRdU0e/1578273411465de8cdb3558f0f543f91/image3__1_.jpg?w=1920&q=100&fit=fill&fm=avif)
Examples of scroll (left) and click (right) heatmaps
Heatmap (or heat map) is a broad term for different types of visual web analytics data. Scroll maps are one type of heatmap where the ‘hottest’ colors show the most viewed sections of the page, rather than the most clicked (or tapped) elements of it (this data is, not surprisingly, captured with a click map).
In other words, scroll maps generate heat zones of your website, app, or product pages from top to bottom, so they look more like a vertical rainbow instead of depicting the ‘confetti’ patterns typical of other types of heatmaps like click or move maps.
Check out these heatmap examples in action to see how scroll maps compare to the other types.
💡Pro tip: when you set up a heatmap in Contentsquare, the Heatmaps tool automatically collects data for all heatmap types—scroll, click, rage click, and move.
You can even combine all heatmap data in one single view with the engagement zones map or zoning analysis. This visualization helps you quickly identify what page elements users interact with the most, so you can validate that page’s UX and make sure it’s optimized for engagement.
![[Visual][product illustration] heatmaps Experience and revenue attribution](http://images.ctfassets.net/gwbpo1m641r7/1zbVNnUEAPWLxJJRXGFUY8/9161f29731e17938d83f3febd4f5d230/Experience_and_revenue_attribution.png?w=3840&q=100&fit=fill&fm=avif)
5 ways to use scroll maps
You can be as creative as you like when it comes to spotting data patterns and UX optimization opportunities. To help you out, here are five of the most common ways to use scroll maps.
1. Find out where you’re losing people's attention
Scroll maps show you how far down the page users get: colder colors (blues) mean fewer people have seen that section of your page.
![[Visual] Scroll map gradient](http://images.ctfassets.net/gwbpo1m641r7/18jhNJqqCZyd7NLpZLBC9G/94aa2eb913d850062453dde680d4a783/image2__19_.png?w=1920&q=100&fit=fill&fm=avif)
Scroll map color gradients indicate high (red) and low (blue) viewership
If your goal is to increase and hold user attention so people scroll further down the page—for example, if you have a long landing page and want to make sure they see all of the information on it—scroll map data will help you think practically about how you can tweak the UX design or copy to reduce drop-offs and increase conversion rates.
💡Pro tip: combine scroll maps with individual user session recordings (aka session replays) to watch how people actually interact with the page. With Contentsquare, you can easily watch how users actually use your page with our Session Replay tool.
![[Visual] Session recordings](http://images.ctfassets.net/gwbpo1m641r7/68ThWvJZ5mr02tKoxgg8uE/19bfbb10a6ff3027c2c3358aec05cc4f/01-Masthead.png?w=3840&q=100&fit=fill&fm=avif)
Start with heatmaps to get a sense for the hot and cold areas of your page. Then review replays to see why people behave the way they do.
2. Spot false bottoms
Sometimes, your visitors don’t realize there’s more content lower down the page. This is known as a ‘false bottom’, and it could be caused by white space, line breaks, or blocks that confuse and frustrate users. Using scroll map percentages, you can ‘depth test’ your pages to check for false bottoms and see how many people scroll past a certain element.
💡Pro tip: Contentsquare’s rage click map tracks when a user clicks on an element repeatedly, expecting an interaction that never happens, ultimately resulting in frustration and a quick exit from your site. These heatmaps are great for identifying potential website bugs and other areas of frustration that might be leading to a page’s high bounce rate.
3. Discover if users see content above the average fold
The part of a web page known as ‘above the fold’ is the area that the majority of people will see upon landing—the ‘fold’ is simply the cut-off point at the bottom of a user’s screen before they need to scroll.
A scroll map automatically calculates the average fold on your page for both desktop and mobile users. By looking at scroll map average fold data, you can place important elements (like calls-to-action) above the fold in a way that works across multiple devices, to promote user engagement as soon as visitors land on the page.
![[Visual] Scroll map showing fold with red arrow](http://images.ctfassets.net/gwbpo1m641r7/60LuCRHqjyaBxdezqSARR8/357c2f526005191858f50c915c99021d/image6__13_.png?w=1920&q=100&fit=fill&fm=avif)
Scroll maps show the average fold area that most users see before scrolling
4. Figure out if users can find what they need
You’d be forgiven for assuming that the goal of optimizing a page using a scroll map is to get as many people as possible to scroll all the way to the bottom. But you’d be wrong. In some cases, users scroll because they can’t navigate your site to find the useful content they need.
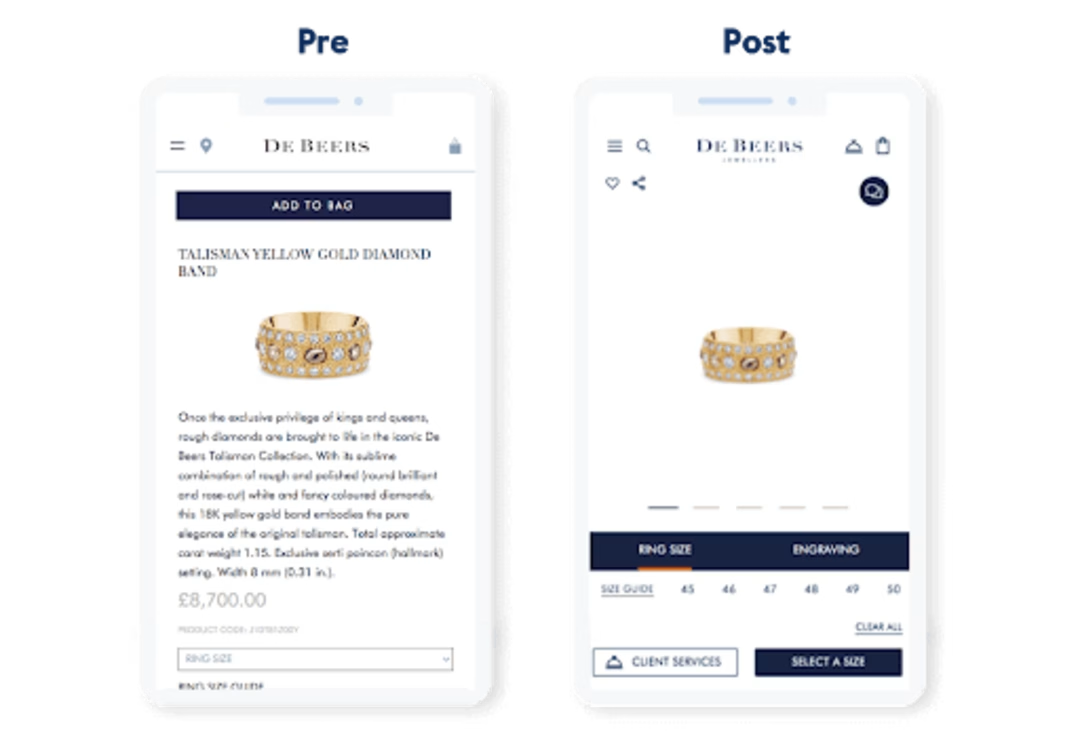
This endless scrolling was something De Beers noticed when they used Contentsquare Heatmaps to review their landing pages.
The team hypothesized that users weren’t seeing the add-to-cart button, hence the scrolling. So, they added a sticky CTA and conversions increased 10% as a result.
For us, we’re a small business of limited people and it’s just a very quick and easy way to get the data you want in a visual, digestible format. Especially when you’re a small team and everything is very fast-paced, you can log in and get the data you need, even if it’s the middle of a meeting. I think that’s really crucial when you’re working in a small business.
💡Pro tip: to get even more information about user behavior, set up an on-page survey with the Contentsquare Surveys tool and ask questions like “Did you find what you were looking for today?” This qualitative data will give you an extra layer of context when reviewing quantitative heatmaps data.
5. Learn if your page offers a good cross-device experience
Users might not behave the same way on desktop and mobile. If you’re optimizing a responsive website (one that re-sizes the same page to each device), a scroll heatmap will show you where users stop scrolling on mobile and desktop, so you can design a multi-device experience that works for all your users.
![{Visual] Scroll data for a mobile phone heatmap](http://images.ctfassets.net/gwbpo1m641r7/73pu3JrqlrFoFkxfdBQ8w0/e3d63965b1ce6693a5e2d815807f9106/image7__10_.png?w=1920&q=100&fit=fill&fm=avif)
Scroll data for a mobile phone heatmap
Scroll data is there to help you design pixel-perfect user experiences; you can refer to the heatmap data to find exactly where you need to place a CTA to capture users’ attention on desktop and mobile.
💡Pro tip: in general, mobile-optimized pages tend to be shorter, but it’s always best to collect your own scroll map data and find out how your users behave on mobile devices so you can determine the most appropriate page length and design for your audience.
How to set up scroll maps with Contentsquare
You can have scroll maps set up in 3 easy steps:
Step 1: Add Contentsquare’s tracking code to your website
Sign up with Contentsquare to get a unique tracking code.
Then, install Contentsquare’s tracking code on your site. Our detailed instructions (here) will help you install your code with a variety of different methods.
Step 2: Enter page URLs
Next, you’ll want to add the page URLs you wish to create scroll maps for. These instructions differ slightly depending on which plan you use:
If you’re on the Enterprise or Pro plan, head into ‘Zoning Analysis’ and click ‘Select a page or page group.’
![[Screenshot] Zoning analysis - in-app](http://images.ctfassets.net/gwbpo1m641r7/37fS84ppsSfjsCA6vdBtON/7bc93aa8f45ea17109ed115ca0e8e2c2/-Screenshot-_Zoning_analysis.png?w=3840&q=100&fit=fill&fm=avif)
Then input the page URLs you want to create scroll maps for and click ‘Apply.’
![[Screenshot] Zone-based heatmaps - New zoning - single page](http://images.ctfassets.net/gwbpo1m641r7/1MP38uAzJA2x1Gfnd2t4rS/9bc004e6f36b9a04f4d8b5eef8464cbd/-Screenshot-_Zone-based_heatmaps_-_New_zoning_-_single_page.png?w=3840&q=100&fit=fill&fm=avif)
Step 3: Review your scroll maps
Your scroll map will begin to populate as Contentsquare collects site data.
View your scroll maps by heading into the page you want to view and selecting selecting ‘Heatmaps’ and ‘Scroll map’ from the dropdowns.
![[Visual] review scrollmap heatmap](http://images.ctfassets.net/gwbpo1m641r7/4GH2uf8glN314BOjiUjifW/8c08388de4d5733ecadbc451cdcb738e/image3__18_.png?w=3840&q=100&fit=fill&fm=avif)
You can also toggle your heatmap to show desktop, tablet, or mobile sessions.
![[Visual] toggle your heatmap to show desktop, tablet, or mobile sessions.](http://images.ctfassets.net/gwbpo1m641r7/5Zs7cH08mipnf8s4ZArbZY/575a057d4c7a70084776f9560a09a6ce/image4__9_.png?w=2048&q=100&fit=fill&fm=avif)
Create a scroll map to better understand users
Scroll maps can identify which sections of your page users skip over—and, more importantly, the content they never even see.
Once you understand how visitors interact with your site, use tools like Session Replay to dig deeper into why they behave that way, so you can craft user experiences that truly delight.
FAQ on scroll maps
A scroll map is a type of heatmap that shows how far down a page users scroll on desktop, tablet, and mobile. Instead of showing where users click, it visualizes which sections are most viewed vs. least viewed using a hot-to-cold color gradient, and it also shows the percentage of users who reach different depths of the page.
![[Visual] Contentsquare's Content Team](http://images.ctfassets.net/gwbpo1m641r7/3IVEUbRzFIoC9mf5EJ2qHY/f25ccd2131dfd63f5c63b5b92cc4ba20/Copy_of_Copy_of_BLOG-icp-8117438.jpeg?w=1920&q=100&fit=fill&fm=avif)